Lesson Menu FiveMinute Check over Lesson 3 3
 Mathematical Practices Then/Now New Vocabulary Key")


")


- Slides: 30
Lesson Menu Five-Minute Check (over Lesson 3– 3) Mathematical Practices Then/Now New Vocabulary Key Concept: Slope-Intercept Form Example 1: Write and Graph an Equation Example 2: Graph Linear Equations Example 3: Graph Linear Equations Example 4: Write an Equation in Slope-Intercept Form Example 5: Real-World Example: Write and Graph a Linear Equation
Over Lesson 3– 3 Find the slope of the line that passes through the points (3, 5) and (7, 12). A. B. C. D.
Over Lesson 3– 3 Find the slope of the line that passes through the points (– 2, 4) and (5, 4). A. 0 B. C. D. undefined
Over Lesson 3– 3 Find the slope of the line that passes through the points (– 3, 6) and (2, – 6). A. 0 B. – 1 C. D. undefined
Over Lesson 3– 3 Find the slope of the line that passes through the points (7, – 2) and (7, 13). A. 0 B. 11 C. D. undefined
Over Lesson 3– 3 In 2012, there were 12, 458 fish in Hound’s Tooth Lake. After years of drought, there were only 968 fish in 2017. What is the rate of change in the population of fish for 2012– 2017? A. 3072 fish/year B. – 1976 fish/year C. – 2298 fish/year D. – 3072 fish/year
Over Lesson 3– 3 The fee for a banquet hall is $525 for a group of 25 people and $1475 for a group of 75 people. Included in the fee is a standard set-up charge. What is the fee person? A. $16 B. $18 C. $19 D. $20
Mathematical Practices 2 Reason abstractly and quantitatively. 8 Look for and express regularity in repeated reasoning. Content Standards F. IF. 7 a Graph linear and quadratic functions and show intercepts, maxima, and minima. S. ID. 7 Interpret the slope (rate of change) and the intercept (constant term) of a linear model in the context of the data.
You found rates of change and slopes. • Write and graph linear equations in slope-intercept from. • Model real-world data with equations in slope -intercept form.
• slope-intercept form
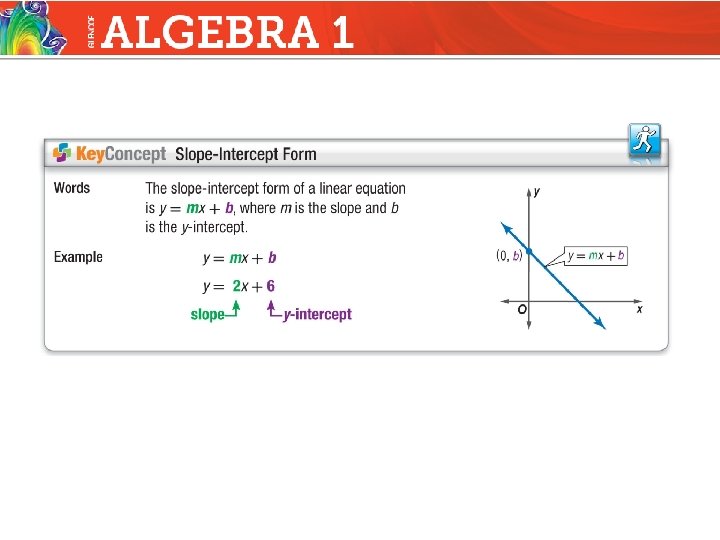
Write and Graph an Equation Write an equation in slope-intercept form of the line with a slope of and a y-intercept of – 1. Then graph the equation. Slope-intercept form
Write and Graph an Equation Now graph the equation . Step 1 Plot the y-intercept (0, – 1). Step 2 The slope is . From (0, – 1), move up 1 unit and right 4 units. Plot the point. Step 3 Draw a line through the points. Answer:
Write an equation in slope-intercept form of the line whose slope is 4 and whose y-intercept is 3. A. y = 3 x + 4 B. y = 4 x + 3 C. y = 4 x D. y = 4
Graph Linear Equations Graph 5 x + 4 y = 8. Then state the slope and y-intercept. Solve for y to write the equation in slope-intercept form. 5 x + 4 y = 8 5 x + 4 y – 5 x = 8 – 5 x Original equation Subtract 5 x from each side. 4 y = 8 – 5 x Simplify. 4 y = – 5 x + 8 8 – 5 x = 8 + (– 5 x) or – 5 x + 8 Divide each side by 4.
Graph Linear Equations Slope-intercept form Now graph the equation. The slope is , and the y-intercept is 2. Step 1 Plot the y-intercept (0, 2). Step 2 The slope is From (0, 2), move down 5 units and right 4 units. Plot the point. Step 3 Draw a line through the points. Answer:
Graph 3 x + 2 y = 6. A. B. C. D.
Graph Linear Equations Graph y = – 7. Then state the slope and y-intercept. Step 1 Plot the y-intercept (0, 7). Step 2 The slope is 0. Draw a line through the points with the y-coordinate 7. Answer:
Graph 5 y = 10. A. B. C. D.
Write an Equation in Slope-Intercept Form Which of the following is an equation in slope-intercept form for the line shown in the graph? A. B. C. D.
Write an Equation in Slope-Intercept Form Read the Test Item You need to find the slope and y-intercept of the line to write the equation. Solve the Test Item Step 1 The line crosses the y-axis at (0, – 3), so the y-intercept is – 3. The answer is either B or D.
Write an Equation in Slope-Intercept Form Step 2 To get from (0, – 3) to (1, – 1), go up 2 units and 1 unit to the right. The slope is 2. Step 3 Write the equation. y = mx + b y = 2 x – 3 Answer: The answer is B.
Which of the following is an equation in slopeintercept form for the line shown in the graph? A. B. C. D.
Write and Graph a Linear Equation HEALTH The ideal maximum heart rate for a 25 -year-old exercising to burn fat is 117 beats per minute. For every 5 years older than 25, that ideal rate drops 3 beats per minute. A. Write a linear equation to find the ideal maximum heart rate for anyone over 25 who is exercising to burn fat.
Write and Graph a Linear Equation
Write and Graph a Linear Equation B. Graph the equation. Then state the slope and y -intercept. The y-intercept is where the data begins. So, the y-intercept is 117 and the graph passes through (0, 117). The rate of change is the slope, so the slope is Answer: , 117
Write and Graph a Linear Equation C. Find the ideal maximum heart rate for a 55 -year-old person exercising to burn fat. The age 55 is 30 years older than 25. So, a = 30. Ideal heart rate equation Replace a with 30. Simplify. Answer: The ideal maximum heart rate for a 55 -yearold person is 99 beats per minute.
A. The amount of money spent on Christmas gifts has increased by an average of $150, 000 ($0. 15 million) per year since 1986. Consumers spent $3 million in 1986. Write a linear equation to find the average amount D spent for any year n since 1986. A. D = 0. 15 n B. D = 0. 15 n + 3 C. D = 3 n D. D = 3 n + 0. 15
B. The amount of money spent on Christmas gifts has increased by an average of $150, 000 ($0. 15 million) per year since 1986. Consumers spent $3 million in 1986. Graph the equation. A. B. C. D.
C. The amount of money spent on Christmas gifts has increased by an average of $150, 000 ($0. 15 million) per year since 1986. Consumers spent $3 million in 1986. Find the amount spent by consumers in 1999. A. $5 million B. $3 million C. $4. 95 million D. $3. 5 million