Lesson Menu FiveMinute Check over Lesson 3 2
 Mathematical Practices Then/Now New Vocabulary Key")


 and (7,")
")
")

 and (5,")

 = 1(r – 6) – 2 =")
 and (3,")
- Slides: 35
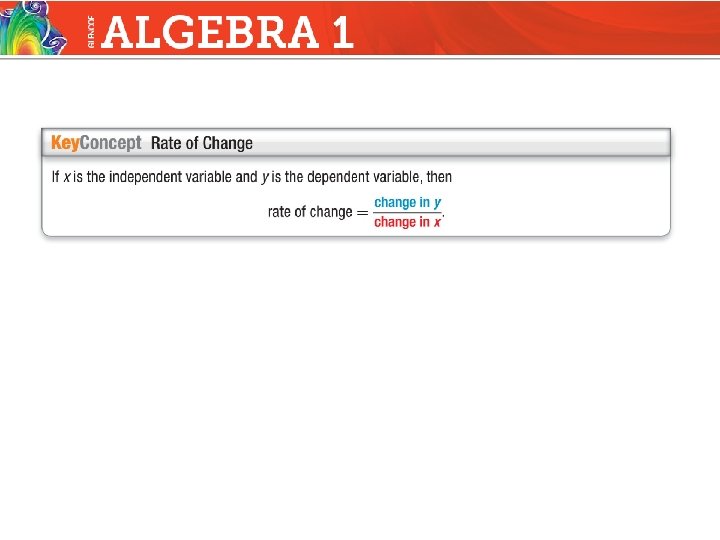
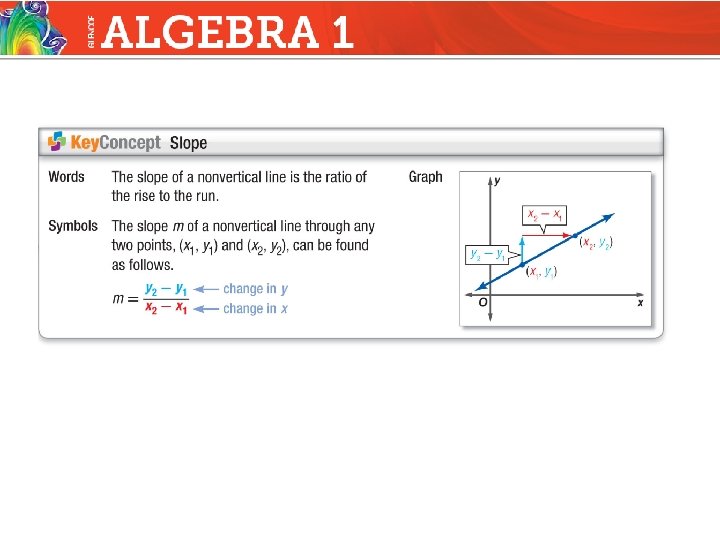
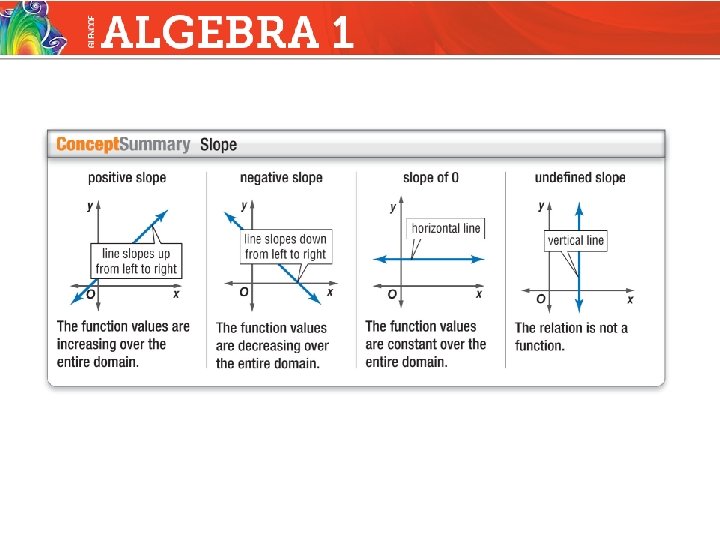
Lesson Menu Five-Minute Check (over Lesson 3– 2) Mathematical Practices Then/Now New Vocabulary Key Concept: Rate of Change Example 1: Real-World Example: Find Rate of Change Example 2: Real-World Example: Compare Rates of Change Example 3: Constant Rates of Change Key Concept: Slope Example 4: Positive, Negative, and Zero Slope Example 5: Undefined Slope Concept Summary: Slope Example 6: Find Coordinates Given the Slope
Over Lesson 3– 2 POOLS Libby starts draining the pool for cleaning. The function y = 10, 080 − 720 x represents the gallons of water y remaining in the pool after x hours. Find the zero and explain what it means in the context of the situation. A. 12; The pool will be drained in 12 hours. B. 12; The pool initially contained 12 gallons of water. C. 14; The pool will be drained in 14 hours. D. 14; The pool initially contained 14 gallons of water.
Over Lesson 3– 2 Graph y = – 4 x + 5. Where does the graph cross the x-axis? A. (0, 5) B. C. D.
Mathematical Practices 2 Reason abstractly and quantitatively. Content Standards F. IF. 6 Calculate and interpret the average rate of change of a function (presented symbolically or as a table) over a specified interval. Estimate the rate of change from a graph. F. LE. 1 a Prove that linear functions grow by equal differences over equal intervals, and that exponential functions grow by equal factors over equal intervals. Common Core State Standards © Copyright 2010. National Governors Association Center for Best Practices and Council of Chief State School Officers. All rights reserved.
You graphed ordered pairs in the coordinate plane. • Use rate of change to solve problems. • Find the slope of a line.
• rate of change • slope
Find Rate of Change DRIVING TIME Use the table to find the rate of change. Explain the meaning of the rate of change. Each time x increases by 2 hours, y increases by 76 miles.
Find Rate of Change Answer: The rate of change is This means the car is traveling at a rate of 38 miles per hour.
CELL PHONE The table shows how the cost changes with the number of minutes used. Use the table to find the rate of change. Explain the meaning of the rate of change. A. Rate of change is. This means that it costs $0. 05 per minute to use the cell phone. B. Rate of change is. This means that it costs $5 per minute to use the cell phone. C. Rate of change is. This means that it costs $0. 50 per minute to use the cell phone. D. Rate of change is. This means that it costs $0. 20 per minute to use the cell phone.
Compare Rates of Change A. TRAVEL The graph to the right shows the number of U. S. passports issued in 2012, 2014, and 2016. Find the rates of change for 2012– 2014 and 2014 – 2016. millions of passports years
Compare Rates of Change 2012– 2014: Substitute. Simplify. Answer: The number of passports issued increased by 1 million in a 2 -year period for a rate of change of 500, 000 per year.
Compare Rates of Change 2014– 2016: Substitute. Simplify. Answer: Over this 2 -year period, the number of U. S. passports issued increased by 4. 6 million for a rate of change of 2, 300, 000 per year.
Compare Rates of Change B. Explain the meaning of the rate of change in each case. Answer: For 2012– 2014, there was an average annual increase of 500, 000 in passports issued. Between 2014 and 2016, there was an average yearly increase of 2, 300, 000 passports issued.
Compare Rates of Change C. How are the different rates of change shown on the graph? Answer: There is a greater vertical change for 2014– 2016 than for 2012– 2014. Therefore, the section of the graph for 2014– 2016 is steeper.
A. Airlines The graph shows the number of airplane departures in the United States in recent years. Find the rates of change for 1995– 2000 and 2000– 2005. A. 1, 200, 000 per year; 900, 000 per year B. 8, 100, 000 per year; 9, 000 per year C. 900, 000 per year; 900, 000 per year D. 180, 000 per year; 180, 000 per year
B. Explain the meaning of the slope in each case. A. For 1995– 2000, the number of airplane departures increased by about 900, 000 flights each year. For 2000– 2005, the number of airplane departures increased by about 180, 000 flights each year. B. The rate of change was the same for 1995– 2000 and 2000– 2005. C. The number airplane departures decreased by about 180, 000 for 1995– 2000 and 180, 000 for 2000– 2005. D. For 1995– 2000 and 2000– 2005, the number of airplane departures was the same.
C. How are the different rates of change shown on the graph? A. There is a greater vertical change for 1995– 2000 than for 2000– 2005. Therefore, the section of the graph for 1995– 2000 has a steeper slope. B. They have different y-values. C. The vertical change for 1995– 2000 is negative, and for 2000– 2005 it is positive. D. The vertical change is the same for both periods, so the slopes are the same.
Constant Rate of Change A. Determine whether the function is linear. Explain. Answer: The rate of change is constant. Thus, the function is linear.
Constant Rate of Change B. Determine whether the function is linear. Explain. Answer: The rate of change is not constant. Thus, the function is not linear.
A. Determine whether the function is linear. Explain. A. Yes, the rate of change is constant. B. No, the rate of change is constant. C. Yes, the rate of change is not constant. D. No, the rate of change is not constant.
B. Determine whether the function is linear. Explain. A. Yes, the rate of change is constant. B. No, the rate of change is constant. C. Yes, the rate of change is not constant. D. No, the rate of change is not constant.
Positive, Negative, and Zero Slope A. Find the slope of the line that passes through (– 3, 2) and (5, 5). Let (– 3, 2) = (x 1, y 1) and (5, 5) = (x 2, y 2). Substitute. Simplify. Answer:
Positive, Negative, and Zero Slope B. Find the slope of the line that passes through Let (– 3, – 4) = (x 1, y 1) and (– 2, – 8) = (x 2, y 2). Substitute. Simplify. Answer: The slope is – 4.
Positive, Negative, and Zero Slope C. Find the slope of the line that passes through (– 3, 4) and (4, 4). Let (– 3, 4) = (x 1, y 1) and (4, 4) = (x 2, y 2). Substitute. Simplify. Answer: The slope is 0.
A. Find the slope of the line that passes through (4, 5) and (7, 6). A. 3 B. C. D. – 3
B. Find the slope of the line that passes through (– 3, – 5) and (– 2, – 7). A. 2 B. – 2 C. D.
C. Find the slope of the line that passes through (– 3, – 1) and (5, – 1). A. undefined B. 8 C. 2 D. 0
Undefined Slope Find the slope of the line that passes through (– 2, – 4) and (– 2, 3). Let (– 2, – 4) = (x 1, y 1) and (– 2, 3) = (x 2, y 2). Substitution Answer: Since division by zero is undefined, the slope is undefined.
Find the slope of the line that passes through (5, – 1) and (5, – 3). A. undefined B. 0 C. 4 D. 2
Find Coordinates Given the Slope Find the value of r so that the line through (6, 3) and (r, 2) has a slope of Slope formula Substitute. Subtract.
Find Coordinates Given the Slope 2(– 1) = 1(r – 6) – 2 = r – 6 – 2 + 6 = r – 6 + 6 4=r Answer: r = 4 Find the cross products. Simplify. Add 6 to each side. Simplify.
Find the value of p so that the line through (p, 4) and (3, – 1) has a slope of A. 5 B. C. – 5 D. 11