Lesson 4 The line of best fit April

Lesson #4: The line of best fit April 29, 2011

A line of best fit is a line that is drawn through the points of a linear relation. Lines of best fit: - Do not always pass through the origin (point (0, 0)) - Do not have to pass directly through the data points. - Must be drawn so as to take into consideration ALL of the points (even those that do not fit in) *points that are “extreme” and do not appear to fit in with the data are called OUTLIERS.

Lines of best fit can be used to: -interpolate: approximate values that fall inside the boundaries of the measured/collected data -extrapolate: approximate values that fall outside the boundaries of the measured/collected data

Determining the Equation of the line of best fit When you draw the line of best fit, try to ensure that the line passes through at least 2 exact corners (of the grid on the graph paper) because you will need to use the coordinates of two points in order to write the equation of the line of best fit. RECALL: y = mx + b

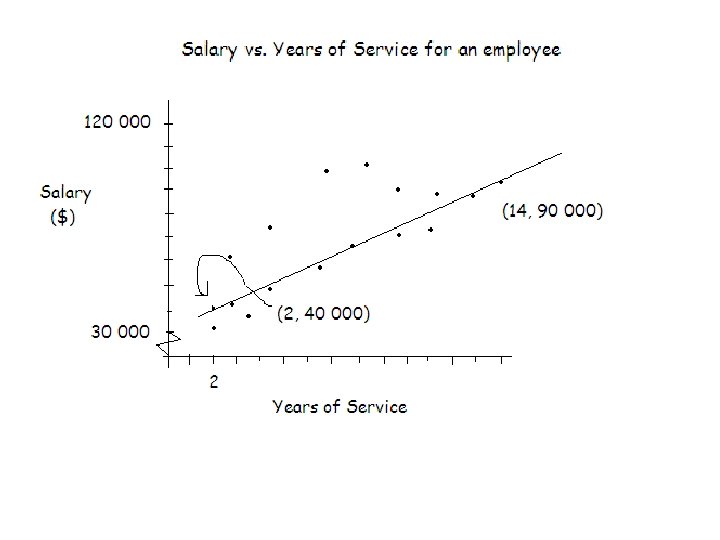
Steps to find the Equation of the line of best fit: 1. Determine the coordinates of 2 points that are on the line of best fit. (2, 40000) and (14, 90000) 2. Calculate the slope.

3. Plug the slope into the basic equation and plug the coordinates of one of the points in as well. Now solve the equation for “b”. 4. Write the equation of the line of best fit by using/plugging in the slope value and y-intercept value.

Now that we have an equation, we can use it to interpolate/extrapolate the data. Example: Estimate the salary of an employee that has put in 8 years of service. x=8 SUB x=8 into the equation y=?
 on the total yards and total")
Assignment: Use the data (handout – little sheet) on the total yards and total points scored for top teams in the NFL. 1. You must plot the data on a sheet of graph paper using a scatter plot. To do this you have to first identify which is the dependent and which is the independent variable. 2. Plot your points using the data table on the handout. 3. Draw a line of best fit. 4. Find the equation of the line of best fit. (Read the note above and look in the text if you're having trouble. ) Don't forget to label your axes and give your graph a title. HAND IN THIS ASSIGNMENT MONDAY
- Slides: 9