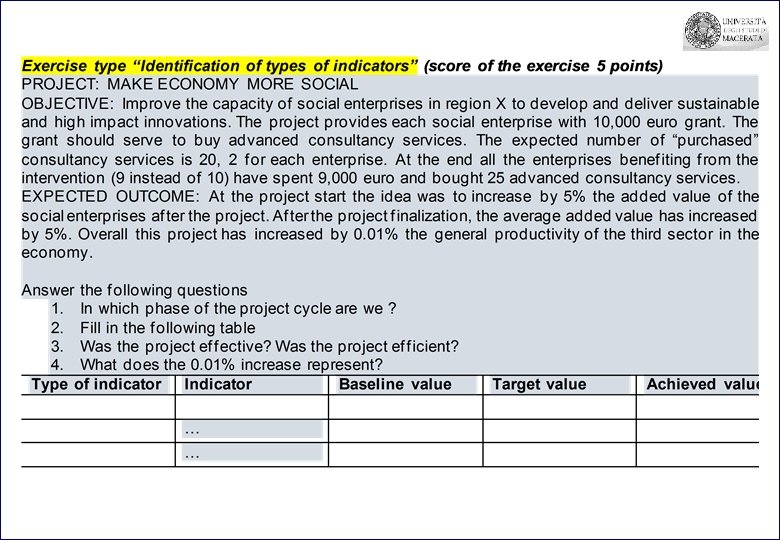
Lesson 3 Performance effectiveness efficiency Macerata 11 October

Lesson 3: Performance, effectiveness, efficiency Macerata, 11 October Andrea Gramillano, t 33 srl

Agenda 1. What do we need from the last lesson? 2. What is performance? 3. What does effectiveness mean? 4. What does efficiency mean? 5. Exercise on Cost / effectiveness analysis (efficiency – unit costs) 6. Exercise on effectiveness and efficiency (accessibility example) 7. Customer satisfaction (effectiveness = achieving a certain level of customer satisfaction) 8. Multicriteria analysis
 What is needed from the last lesson?")
1) What is needed from the last lesson?
 Relevance SWOT - PEST Before the project")
Phase Criteria Tool Time Identification (of needs) Relevance SWOT - PEST Before the project starts Formulation (feasibility study) Coherence (at least) Matrix analysis and document analysis Before the project starts Funding decision Implementation Performance Monitoring / During the project indicator implementation Multicriteria analysis Efficiency Effectiveness Evaluation and audit Impact Sustainability In an advanced phase and at the end

WORK OUT Project BRIDGE invests EUR 2 billion to build two bridges in order to improve the accessibility of the rural villages located in the North of the country. Accessibility in this area is very low. Project monitoring system (MS) provides the definition of indicators and describes the monitoring procedures. NAT STAT stands for national statistical institute How can you assess the following indicators? Type (input, outcome, context, impact) Km of roads renovated in 2015 (source: MS) Time spent to move (with an expected percentage decrease of 20% in three years, knowing that similar target have never been achieved in the past) Number of project activities finalized each year (source: MS) Number of inhabitants improving their living conditions (source not identified) Increase of wellbeing in 2015 in the country (source: NAT STAT) Euro spent (source: MS) Number of bridges built in 2014 in rural villages located in the South of the country (source: MS) Satisfaction of health services with an expected annual increase of 10% (source: NAT STAT, knowing that similar targets have been achieved in the past) Legend: Y = Yes; N = No; ? = it depends or not enough information available; / =not pertinent question Physical, financial, procedural S M A R T

Programme «IDP» The International Development Programme for 2007 -2013 provides an excellent opportunity for the region “POOR” to further progress its economic development, through priorities determined by the region itself and defined by a strong regional partnership drawn from all parts of the region. In addition to International Development Programme, the Regional Economic Strategy (RES) represents the “POOR’S” response with the following targets: • To raise the region’s GVA per head from 80% to 90% of the national average • To get between 61, 000 and 73, 000 more people in the region into work • To create between 18, 500 and 22, 000 new businesses Programme Priorities The International Development Programme comprise three priorities: • Priority One: Enhancing and Exploiting Innovation (53%). • Priority Two: Business Growth and Enterprise (43%) • Priority three: Addressing Climate Change Accordingly, through Priority 1, the strategy will: • Increase the region's value-added by investing in ‘opportunity’ to exploit the region's science and technology strengths to compete on the international markets • Invest in integrated projects that, on one level, will strengthen capacity to apply science, technology and innovation in businesses. The programme will invest exclusively by using financial instruments as: • Guarantee schemes in combination with grants • Loans
 coherent with the programme? (vertical coherence)")
External coherence: - Is the project A (B) coherent with the programme? (vertical coherence) - Is the project A coherent with project B? (horizontal coherence) - In terms of objective, activities, and type of support? Internal coherence - Has the project A (B) the appropriate internal coherence? - Objective and activities? - Activities and budget? the programme? (vertical coherence) - Is the project A coherent with project B? (horizontal coherence) Project A Project B Objective Improve the capacity of social enterprises to develop and deliver sustainable and high impact innovations Objective Introduce technologies, methods and tools to organise this circular approach to sediment management. Activities Research models Activities Organisation of meetings and drafting of manual for circular economy (e. g. recycling) on effective business Pilot test on new business models, evaluation of business models Pilot tests Establishing network New investments Building a motorway Budget Estimated budget 3, 800, 000. 00 Euro Type of support Guarantee scheme without combination with grant any Budget Estimated budget 5, 800, 000. 00 Euro Type of support Grant

Indicators: what is it needed? v. Definition v. Unit of measurement v Source of information v. Baseline (i. e. the initial value against which an indicator is subsequently measured) ü Refer to local context; or ü Refer to activities in previous programmes v. Target (combined with baseline information, provides information concerning the importance of the planned interventions)

Be careful, not ‘a robot’ • When you see bridge it is an output indicator (probably yes) • When you see km / square meters it is an output indicator (being physical) but pay attention • When do you see number of enterprises? ? What is that? Ø Number of enterprises submitting a proposal for building the bridge in the public procurement procedure Ø Number of enterprises supported to introduce innovations actually introducing innovation Ø Number of enterprises supported to introduced innovations actually introducing innovation and increasing turnover / jobs
 Performance")
2) Performance

Performance: problematic defintion. OECD definition: The degree to which a development intervention or a development partner operates according to specific criteria/ standards/ guidelines or achieves outcomes in accordance with stated goals or plans. Commission Defintion: The meaning of the word performance is not yet stable; it is therefore preferable to define it whenever it is used. Performance might mean that intended outcomes were obtained at a reasonable cost, and/or that the beneficiaries are satisfied with them. Efficiency and performance are two similar notions, but the latter extends, more broadly, to include qualitative dimensions.

Performance: When it does take place On going Evalaution Criteria the project activities are delivered on time, the outputs respect the targets, the resources are duly absorbed, the procedures are done according to the rules. Needs Resources (inputs) Output (implementation) outcome (Specific Objective)

Performance questions: The project: - is able to spend all the financial resources; - meets the procedural deadlines; - achieved the target in terms of physical realization. And in the next period: - What is needed to increase the project performance? (human resources? political support? administrative enforcement? - Will the project be successfully completed? - Which might be future challenges Performance evaluation is based on monitoring indicators (procedural, financial, physical, output indicators)

Procedural monitoring Most public activities have to follow a more or less rigid schedule in which the different steps are mandated and the deadlines fixed (i. e. ). Procedural monitoring usually provides information about how project pipelines are progressing (where and when calls for tenders have been published, contracts have been awarded, …). Final payment …… Contract awarded Call published Specifications ready …… …… Actual …… …… …… Expected Actual …… 19 -08 -10 Expected Actual 08 -08 -10 Expected 14 -08 -10 Actual Status Open Expected 08 -08 -10 Procedure P 1
 Unit of Measurement Target")
Physical monitoring Example of physical monitoring: Indicator (number of enterprises) Unit of Measurement Target Achievement Micro N 142 91 Small N 133 111 Medium N 39 21 Owner (women) N 50 40 Owner (<30 y) N 26 3 Start-up N 54 3

Financial monitoring Example of financial monitoring: Priority P 1 Expected expenditures Resources committed Expenditures Amount % (a) (b/a) (c/a) 133. 4 100. 4 75. 2 71. 8 53. 9

Multicriteria analysis
 Tool used to compare several interventions in relation to")
Multicriteria (assessment tool for performance) Tool used to compare several interventions in relation to several criteria. Multicriteria analysis is used also in the ex ante evaluation for comparing proposals. It can also be used in the ex post evaluation of an intervention, to compare the relative success of the different components of the intervention. Finally, it can be used to compare separate but similar interventions, for classification purposes. Multicriteria analysis may involve weighting, reflecting the relative importance attributed to each of the criteria. It may outcome in the formulation of a single judgement or synthetic classification, or in different classifications reflecting the stakeholders' diverse points of view. In the latter case, it is called multicriteria-multijudgement analysis. (from EVALSED)

Process Step 1 define criteria Step 2 scoring or ranking Step 4 aggregating Step 3 weighting

STEP 1: setting criterion Criterion 1: Financial Performance Project 1 Project 2 Project 3 Project 4 Project n… Criterion 2: Procedural Criterion 3: Physical realisation

STEP 2: Score or rank for judgment - It is needed to find a way to appraise the project according to different aspects since we used different measuring units for different aspects of different process - We can opt for: - A) Scoring: by assigning a numeric value to different “interval” of performance. For example 3 for “above average” – 1 for “on line with average” – 3 for “below average” - B) Ranking: we simply order the different projects according to their performance from the first to the last

STEP 2: Scoring Criterion 1: Criterion 2: Criterion 3: Project 1 1 Project 2 0 2 1 Project 3 3 1 1 Project 4 3 3 0 Project n…

STEP 3: Establishment of weight If some Criteria is more important than others it shall be given more importance. To do it we simple apply a multiplication factor > 1 (e. g. 1, 5). Some criteria may have such importance that they have to be singled out. This is the case for criteria determined by a veto threshold (For example “Physical” if some project has 0 performance, it is excluded by the analysis).
 Criterion 2: Criterion")
STEP 3: Apply the weight Criterion 1: ( * 1, 5) Criterion 2: Criterion 3: Project 1 1, 5 1 1 Project 2 0 2 1 Project 3 4, 5 1 1 Project 4 4, 5 3 out Project n…
")
STEP 4: Aggregate the score Criterion 1: Criterion 2: Criterion ( * 1, 5) 3: Total (with weight) Total (without weight) Project 1 1(1, 5) 1 1 3. 5 3 Project 2 0 2 1 3 3 Project 3 3(4, 5) 1 1 6, 5 5 Project 4 3(4, 5) 3 out 6 Project n…
 Project 1 Project")
WORK OUT: SME INCUBATOR Criterion 1: Economic (average increase of turnover) Project 1 Project 2 Project 3 Project 4 Criterion 2: New Jobs Criterion 3: Satisfaction for quality service Total

WORK OUT DATAS Project 1 2 3 4 Economic 80% 70% 30% 70% Physical 50 10 30 5 Quality High Low High Medium Quality levels Low Medium High

Apply weight A Economic * 1, 5 Physical Veto = N. of job < 10 B Physical *2 Quality Veto for “Low”
 Effectiveness")
3) Effectiveness
 The extent to which the development intervention’s objectives were achieved, or")
Effectiveness (definition 1) The extent to which the development intervention’s objectives were achieved, or are expected to be achieved, taking into account their relative importance. Note: Also used as an aggregate measure of (or judgement about) the merit or worth of an activity, i. e. the extent to which an intervention has attained, or is expected to attain, its major relevant objectives efficiently in a sustainable fashion and with a positive institutional developmental impact. (OECD)
 The term effectiveness has many possible meanings. The most common definition")
Effectiveness (definition 2) The term effectiveness has many possible meanings. The most common definition identifies effectiveness with “achievement of objectives”. This leaves open the definition to the different meanings of “objectives”. Objectives can be expressed quantitatively in terms of expected output or outcomes. The effectiveness is evaluated simply by comparing what has been obtained with what had been planned: outputs and outcome indicators are all is needed. (European Commission – DG REGIO EVALSED GUIDE)

EFFECTIVENESS: WHAT TO EVALUATE ? EUROPEAN COMMISSION Quality: effectiveness is evaluated by comparing outcomes with quality standards. OECD Effectiveness assesses whether the outcomes outlined in the logframe are delivered and if they are likely to produce the expected Ability of a given action to produce objective. Evaluating a desired change: comparing effectiveness should include what is observed after the action assessment of how people has taken place with what would (women and men) benefit from have happened without the action. the outcomes brought by the One needs data that allow project recovery of the counterfactual situation.

Evaluation Questions • To what extent were the originally defined objectives of the development intervention realistic? • To what extent have the (direct) objectives of the development intervention been achieved in accordance with the (adjusted, if applicable) target populations? • What are the (concrete) contributions of interventions for achieving the objectives of the development intervention? • What factors were crucial for the achievement or failure to achieve the project objectives so far (indication of strengths and weaknesses, e. g. the monitoring and evaluation system)? • What is the quality of development-policy, technical planning and coordination ?
 Efficiency")
2) Efficiency

Efficiency Definition Type of Questions • OECD: the project 1. Was the budget adequate? Was the outcomes have been spending commensurate with the achieved at reasonable delivery of activities and achieving cost with minimum waste of effort, time, money and outcomes? skills. • European Commission: obtaining a given output at the minimum cost or, equivalently, with maximizing output for a given level of resources. 2. Were the human, financial, material resources adequate in terms of quality and quantity to achieve the project outcomes? 3. To what extent were costs of the project justified by the benefits in comparison with similar projects or known alternative approaches?

Information and Data on OUTCOME Indicators Methods Quantitative - Financial - Physical - Procedural Qualitative - Opinions on the level of achievement - Perceptions on satisfaction • • Literature review Interview Community interview Project visit Focus group Case study Survey

Different way for collecting information
 Cost-effectiveness assessment")
3) Cost-effectiveness assessment

Cost - effectiveness Project A Project B Public contribution to each firm / project 100, 000 Euro 155, 000 Euro Number of jobs created in each firm 2 FTE 3 FTE Ratio 50000 51666

Cost – effectiveness Project A Project B Public contribution to each firm / project 100, 000 Euro 155, 000 Euro Number of jobs created in each firm 2 FTE 3 FTE Ratio 50000 51666

Cost - effectiveness Project A Project B Public contribution to each firm / project 100, 000 Euro 155, 000 Euro Number of jobs created in each firm 2 FTE 3 FTE Ratio 50000 51666
 Exercise on effectiveness")
4) Exercise on effectiveness

Effectiveness / Efficiency - exercise PROJECT: : ONE WAY TO CENTER OBJECTIVE: The project aimed at increasing accessibility by building three bridges in the period 20122015 investing 3 millions. At the end 4 millions were spent. In 2016, two bridges have been built. EXPECTED OUTCOME: At the project start the idea was to increase the accessibility by reducing the time to go from the city center to the periphery (from 50 minutes to 25 minutes). In 2016, going from the city center and to the periphery takes 20 minutes (thus less than in the expected outcome). The overall circulation in all the city improved a lot, with a general reduction of 5% of time to go from any area in the city to another one. TASKS • In which phase of the project cycle are we ? • Fill in the following table • Can you give any explanations of what happened to increased accessibility (at project area and city level)? • Was the project effective? Was the project efficient? Type of indicator Indicator Built bridges … … Baseline value Target value Achieved value
 Customer satisfaction (effectiveness = achieving a certain level of student’s satisfaction)")
5) Customer satisfaction (effectiveness = achieving a certain level of student’s satisfaction)

The Customer Satisfaction Customer satisfaction is a technique coming from Marketing. It aims to understand how customer expectations are met by products and services. More in detail, CS is based on the comparison of customers’ expectations and their perceived performance. It is positive when a product performs over the expectations. CS is measured at the individual level, but it is almost always reported at an aggregate level and it is often measured along various dimensions. There are different methods adopted in business. One of the most famous is the SERVQUAL by Parasuraman, Zeithaml and Berry.

IDENTIFY GAPS • GAP: between service quality specification and service delivery This gap may arise through service personnel being poorly trained, incapable or unwilling to meet the set service standard. • GAP: between service delivery and external communication Consumer expectations are highly influenced by statements made by company representatives and advertisements. • GAP: between expected service and experienced service This gap arises when the consumer misinterprets the service quality.

STEPS TO DEVELOP CUSTOMER SATISFACTION Establish Dimensions Define Questions Fix Scales Analyse outcomes Deliver Survey Set questionnaire

DIMENSION AND QUESTIONS DIMENSIONS • Dimensions represent different aspects of the services and products SERVQUAL model, refers to five dimensions of quality: q Reliability q Responsiveness q Assurance q Empathy q Tangibles QUESTIONS They represent the concrete translation of the dimensions in items to be asked to the customers. ES. A project related to vocational training defines the content of training, the methods and the materials. It might ask to students “how are you satisfied with the on line available documents? ”

FACTORS of the RATER model • Reliability: the ability to perform the promised service dependably and accurately • Assurance: the knowledge and courtesy of employees and their ability to convey trust and confidence • Tangibles: the appearance of physical facilities, equipment, personnel and communication materials • Empathy: the provision of caring, individualized attention to customers • Responsiveness: the willingness to help customers and to provide prompt service
 Employment situation (yes /")
Demographic information Age / Year (Master degree – Bachelor degree) Employment situation (yes / no) City and County (living in Macerata or not) Frequency of the service (Attendance…) Responses (based on a Likert scale)
 FACTORS of the RATER model Age")
Demographic information Responses (based on a Likert scale) FACTORS of the RATER model Age / Year (Master degree – Bachelor degree) Employment situation (yes / no) City and County (living in Macerata or not) Frequency of the service (Attendance…) • Reliability: the ability to perform the promised service dependably and accurately QUALITY OF THE SERVICE (LESSONS/CONTENTS) • Assurance: the knowledge and courtesy of employees and their ability to convey trust and confidence QUALITY OF THE SERVICE (LESSONS/PROFESSOR-QUALITY OF EXPLANATION) • Tangibles: the appearance of physical facilities, equipment, personnel and communication materials QUALITY OF THE ROOM / TIMING / ACCESSIBILITY • Empathy: the provision of caring, individualized attention to customers AVAILABILITY FOR INDIVIDUALISED SUPPORT • Responsiveness: the willingness to help customers and to provide prompt service AVAILABILITY FOR “HELP DESK” • …………. OPEN QUESTION FOR SUGGESTIONS
 and QUESTIONAIRE")
SCALE (LIKERT) and QUESTIONAIRE

SURVEY and ANALYSIS Survey • DEFINE YOUR TARGET • SAMPLE ? • tools: q PHONE q WEB q PERSONAL INTERVIEW ANALYSIS (descriptive statistics) Questions 1 … TOT. Resp. score Mode Exp.

WORKOUT: DO YOU LIKE THIS COURSE? From dimensions to questions STEPS Establish Dimensions Analyse outcomes Define Questions Deliver Survey Fix Scales Set questionnaire Dimensions Questions
 QUESTIONAIRE 1) Are the materials / contents relevant / useful")
Questions Very bad (1) QUESTIONAIRE 1) Are the materials / contents relevant / useful for your professional preparation? 2) Do you think that materials and contents provided during the lessons are adequate to prepare for the exam? 3) Did the course respect the predefined programme? 4) Was the professor available for providing additional information, when needed? 5) Are contents exposed in a clear way during the lessons ? 6)Is the classroom (furniture, room, computers …. ) adequate for the course? 7) Is the lesson schedule adequate compared to the entire students’ week timetable? 8) Is the professor answering the questions in an effective way? 9) Is the distribution of the hours dedicated to the subjects adequate? 10) Does the course fit your degree? 11) Was the professor able to attract the students’ attention? 12) Was the professor ready to provide supports and guidance after the class? 13) Did the professor respect the timetable (he was there for the lessons)? 14) Did the course meet your expectations? IF not please provide any suggestion… More bad than good (2) More good than bad (3) Very good (4)

Questions 1 2 3 4

ANALYSIS 1 2 3 4
 Performance")
6) Performance

Lesson 5: Impact and sustainability Macerata, 3 th November Andrea Gramillano, t 33 srl
 What do Impact and sustainability mean? v 2) Customer satisfaction v")
Agenda v 1) What do Impact and sustainability mean? v 2) Customer satisfaction v 3) CBA analysis: § Financial Aanalysis §Economic Analysis §Risk Analysis

Outcome Output Input

Impact Outcome Output Input

Efficiency, Impact and sustainability in the evaluation Process Impact as a contribution to the overall objective

Efficiency, Impact and sustainability in the evaluation Process Effectiveness: which outcome? Project Output / outcome 1 Outcome / output 2 Outcome / output 3 Efficiency At what cost? Sustainability: Will they last? Impact: Are they directly related? Impact as a net effect (counterfactual approach) – similar to added value

Sustainability Definition Type of Questions • OECD: Will the • 1. Are the outcomes likely to be political, institutional, sustained in the future? managerial, and Did national/regional/local technical, change last • 2. authorities, civil society take beyond the initiative? ownership of the outcomes of the project? • 3. Are changes in attitudes, behaviour patterns and institutional arrangements likely to last once the project is closed?

Impact Definition Type of Questions • OECD: Did the 1. To what extent was the project bring real objective achieved? How did the change ? outcomes influence the indirect beneficiaries? • European Commission: The 2. Did the project produce unintended change that can be effects? Why did these unintended credibly attributed to outcomes (positive or negative) an intervention. happen? 3. What was the influence of external factors (negative, positive, little/no influence) such as changes in policy legislation, general economic and financial conditions?

COST AND BENEFIT ANALYSIS

FRAMEWORK STEPS Sustainability Analysis Financial Analysis Economic Analysis Risk Analysis Key concepts • • Economic vs. Financial Discounting Externalities Shadow prices ( conversion factor) • Conditionality • Time Horizon

EXERCISE

Project – Renewal of a museum • Investment costs Machinery and equipment = 20, 000 euro (first year) Work = 20, 000 euro (second year) Materials = 10, 000 euro (second year) Other costs = 6, 000 euro (second year) Extraordinary maintenance = 6, 000 euro (8° year) • Operational costs (from 3 th year) General costs = 1, 000 euro (from 3 th year) Ordinary maintenance = 5, 000 euro (from 3 th year) Work = 2, 000 euro (from 3 th year) • Cash flows (from 3 th year) • Biglietti = 10, 000 euro (from 3 th year) • Financial resources • Own resources = 25, 000 euro (second year) • Public contribution = 35, 000 euro (first year)

Project – New wind power plant • Investment costs Machinery and equipment = 15, 000 euro a year (for three years) Work = 6, 000 euro a year (for three years) Materials, land= 1, 000 euro (for three years) Extraordinary maintenance = 6, 000 euro (8° year) Residual value = 5, 000 euro • Operational costs (from 4 th year) General costs = 500 euro Ordinary maintenance = 1, 000 euro Work = 500 euro • Cash flows (from 4 th year) • Tarif = 24, 000 euro (from 3 th year) • Financial resources • ? ? ?

Year 1 Cash flows Financi al resourc es Own resources Investm ent costs Machinery and equipments Public resources Work Land other costs Residual value Extraordinary maintenance Operati onal costs General costs Ordinary maintenance Work Rev and costs Revenues – costs cumulated Year 2 Year 3 Year 4 Year 5 Year 6 Year 7 Year 8 Year 9 Year 10

ANNEX

DISCOUNTING Discount rate: The rate at which future values are discounted to the present. Usually considering roughly equal to the opportunity cost of capital.
=1, 05 after")
DISCOUNTING Example: 1 Euro invested at 5% yearly rate, will become (1+5%)=1, 05 after one year; (1, 05)x(1, 05)=1, 1025 after two years; (1, 05)x(1, 05)=1, 157625 after three years. The economic present value of 1 Euro that will be spent or gained two years later is 1/1, 1025=0, 907029; three years later is 1/1, 157625=0, 863838.

DISCOUNTING /Most Member States have their own social discount rates for public sector projects. /These discount rates comprise between a maximunm 10% rate and a minimum 3% real rate. /In this context a real 5% discount rate may be an appropriate benchmark value: low enough to focus attention on project not passing the test, but not too far from the average official discounting rate.

5 FINANCIAL ANALYSIS • The financial analysis is made up of a series of tables that collect the financial flows of the investment: - total investment, - operating costs and revenue, - sources of financing, • The financial analysis should finally outcome in two tables summarising the cash flows to verify: – SUSTAINABILITY – RETURN OF INVESTIMENT

FINANCIAL SUSTAINABILITY TABLE Financial sustainability is verified if this row is more than or equal to zero for all the years considered.
 This value is calculated with a")
FINANCIAL INTERNAL RATE OF RETURN OF INVESTMENT (FRR/C) This value is calculated with a financial discount rate of 6% This rate of return measures the capacity of operating net revenues to sustain the investment costs regardless the way they are financed.

Net present value Rate of return

ECONOMIC ANALYSIS “The economic analysis appraises the project contribution to the economic welfare of the region or country. It is made on behalf of the whole society (region or country) instead of just the owner of the infrastructure like in the financial analysis. ”

The three steps for economic corrections STEP 1 - Fiscal corrections STEP 2 - Externalities corrections STEP 3 - From market to accounting price
. Phase 1. Fiscal correction. It is necessary to deduct from the flows of")
(1). Phase 1. Fiscal correction. It is necessary to deduct from the flows of financial analysis, payments that have no real resources counterpart, as for subsidies and indirect taxes on input and output. For direct public tranfers they are already not included in the starting table for financial analysis which considers investment costs and not financial resources.
. Phase 2. Externalities correction. It is necessary to include among outflows and inflows")
(2). Phase 2. Externalities correction. It is necessary to include among outflows and inflows also external costs and benefits for which there is no cash flow. Some examples could be costs for health services or losses in fisheries due to incresed pollution, time saved for investment in transports, specific infrastructures supplied by public sector for the project (a road built specifically for the project…) increased touristic flows, increased accessibility of the region…
. Phase 3. From market to accounting prices. It is necessary to determine a")
(3). Phase 3. From market to accounting prices. It is necessary to determine a vector of conversion factors including distortion of the market into prices. Such distortions affect input, outputs and wages.

STEP 1: fiscal corrections This value is calculated with a social discount rate of 5% STEP 3: From market to accounting prices STEP 2: Externalities corrections

8 SENSITIVITY AND RISK 4 The project examiner should check if risks associated with the project have been assessed by the applicant. 4 This check can be done by sensitivity analysis alone, and implies a certain amount of reasoning, if not of calculations, in terms of probabilities of the main variables affecting the expected outcome of the project.

8 SENSITIVITY AND RISK 4 Sensitivity analysis: A study of the impact that changes in crucial estimates concerning costs and benefits would have on the profitability or present value of a project 4 Probability distribution: One is often interested to know what the probability is of a project having a economic rate of return less than the minimum required rate.

8 SENSITIVITY AND RISK Sensitivity analysis is a deterministic procedure, aimed at understanding which variables influence the economic net present value or ERR of the project. Any independent variable for which 1% change outcomes in 1% change or more of ENPV or ERR is certainly a critical one, and needs to be estimated as reliably as possible.

8 SENSITIVITY AND RISK Risk assessment implies assigning probabilities to these critical variables and calculating the probability distribution of ERR.

SUM UP

PROGRAM AND PROJECT The Project / Program cycle The Chain of Public Interventions Identification Evaluation and review Policy Program Formulation Implementation Project (1) Other delivery policy tools: law, tax, agency, campaign. Project (2)

Why do we need a project? To make a change… The project is …. . • Project vs. routine • Project is limited in time • Resources are defined • Beneficiary identified To… Solve a problem / social need / change a behaviour: - Economic growth - Accessibility - Social inclusion …. .

Monitoring • To monitor means to observe. • Monitoring is the regular observation and recording of activities taking place in a project or program. It is a process of routinely gathering information on all aspects of the project. • To monitor is to check on how project activities are progressing. It is observation; ─ systematic and purposeful observation. • Monitoring also involves giving feedback about the progress of the project to the donors, implementers and beneficiaries of the project. • Reporting enables gathered information to be used in making decisions for improving the project performance.

Evaluation Based on monitoring, evaluation is the systematic collection and analysis of data needed to make decisions, a process in which most well-run programs engage from the outset ( American Evaluation Society) Evaluation tries to answer two distinctive questions: • Did the public intervention have an effect at all and if yes, how big – positive or negative – was this effect. The question is: Does it work? Is there a causal link? This is the counterfactual question • Why an intervention produces intended (and unintended) effects. The goal is to answer the “why and how it works? ” question. To answer this question is the aim of theory-based impact (European Commission – DG REGIO) An evaluation is an assessment, as systematic and objective as possible, of an on -going or completed project, programme or policy, its design, implementation and outcomes. The aim is to determine the relevance and fulfilment of objectives, developmental efficiency, effectiveness, impact and sustainability. An evaluation should provide information that is credible and useful, enabling the incorporation of lessons learned into the decision-making process of both recipients and donors ( OECD/DAC)

Monitoring, Auditing and Evalaution Monitoring: observing and collecting data form the project. What time is it? 12, 34 At what time is the train ? 11, 50 Evaluation: interpeting data to provide a subjuctive judgement for accountability and learning: • You did not catch the train because of…. . • An alternative can be……. .
 Realisation (output) Outcome END")
Project development SELECTION Implementation Identification and Formualtion Needs Resources (inputs) Realisation (output) Outcome END OF PROJECT After Conlcusion
 Realisation")
Project development and Evaluation Needs On going Evaluation Ex ante Evaluation Resources (inputs) Realisation (output) Outcome Monitoring Ex Post Evaluation
 Relevance ce Program / policy Needs Resources (inputs)")
Relevance and Coherence ( EX ANTE) Relevance ce Program / policy Needs Resources (inputs) Output (implementation) Outcome (Specific Objective) External coherence Internal Coherence
 Needs Performance ce Resources (inputs)")
Performance, Efficiency, Sustainibility, Effectiveness (on going / ex post) Needs Performance ce Resources (inputs) Output (implementation) Effectiveness ce Outcome (Specific Objective) Efficiencyce Sustainibility

Definitions • Relevance : the project outcomes and Impact CAN produce a change • External Coherence: the project is strategically aligned with the concerning policy (vertical) – the program works in synergy and complementarily with other contextual intervention (horizontal) • Internal coherence: the project objectives, activities, output, outcomes, impacts are logically connected • Performance: the project activities are delivered on time, the outputs respect the targets, the resources are duly absorbed, the procedures are done according to the rules. • Effectiveness: the project achieves outcomes / Impact accordingly with the targets • Efficiency: the project achieves outcomes / Impact accordingly with the targets with the minor costs and in the shorter time. • Impact: the project is capable to contribute significantly to the change • Sustainability: the project changes can last after the conclusion • Utility: Impacts obtained by the intervention correspond to society needs
- Slides: 102