LESSON 3 3 Slopes of Lines FiveMinute Check

 TEKS Then/Now New Vocabulary Key Concept: Slope of")


 Derive and use the distance, slope, and midpoint formulas to")


 and")

 and is parallel to OP with")

- Slides: 35
LESSON 3– 3 Slopes of Lines
Five-Minute Check (over Lesson 3– 2) TEKS Then/Now New Vocabulary Key Concept: Slope of a Line Example 1: Find the Slope of a Line Concept Summary: Classifying Slopes Example 2: Real-World Example: Use Slope as Rate of Change Postulates: Parallel and Perpendicular Lines Example 3: Determine Line Relationships Example 4: Use Slope to Graph a Line
Over Lesson 3– 2 In the figure, m 4 = 146. Find the measure of 2. A. 24 B. 34 C. 146 D. 156
Over Lesson 3– 2 In the figure, m 4 = 146. Find the measure of 7. A. 24 B. 34 C. 146 D. 156
Over Lesson 3– 2 In the figure, m 4 = 146. Find the measure of 10. A. 160 B. 146 C. 56 D. 34
Over Lesson 3– 2 In the figure, m 4 = 146. Find the measure of 11. A. 180 B. 160 C. 52 D. 34
Over Lesson 3– 2 Find m 11 + m 6. A. 180 B. 146 C. 68 D. 34
Over Lesson 3– 2 In the map shown, 5 th Street and 7 th Street are parallel. At what acute angle do Strait Street and Oak Avenue meet? A. 76 B. 75 C. 53 D. 52
Targeted TEKS G. 2(B) Derive and use the distance, slope, and midpoint formulas to verify geometric relationships, including congruence of segments and parallelism or perpendicularity of pairs of lines. Mathematical Processes G. 1(A), G. 1(G)
You used the properties of parallel lines to determine congruent angles. • Find slopes of lines. • Use slope to identify parallel and perpendicular lines.
• slope • rate of change
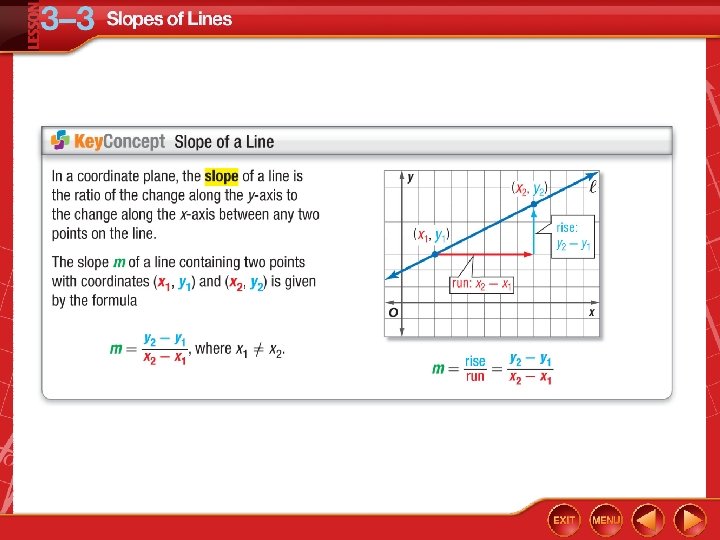
Find the Slope of a Line A. Find the slope of the line. Substitute (– 3, 7) for (x 1, y 1) and (– 1, – 1) for (x 2, y 2). Slope formula Substitution Simplify. Answer: – 4
Find the Slope of a Line B. Find the slope of the line. Substitute (– 2, – 5) for (x 1, y 1) and (6, 2) for (x 2, y 2). Slope formula Substitution Simplify. Answer:
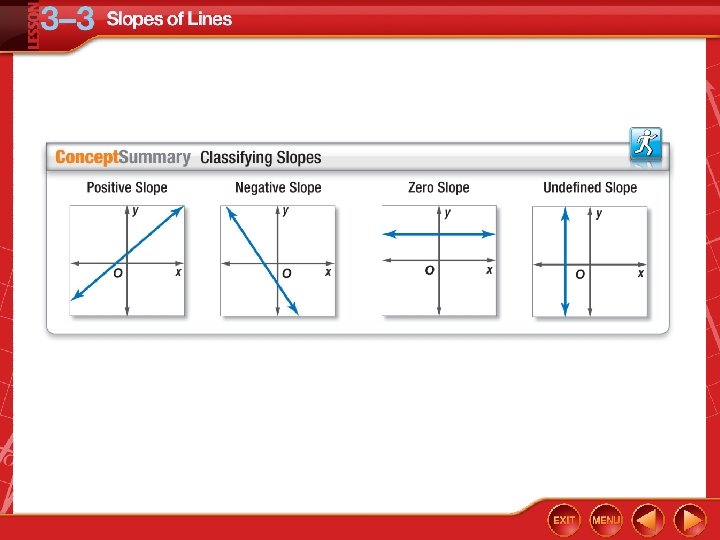
Find the Slope of a Line C. Find the slope of the line. Substitute (0, 4) for (x 1, y 1) and (0, – 3) for (x 2, y 2). Slope formula Substitution Simplify. Answer: The slope is undefined.
Find the Slope of a Line D. Find the slope of the line. Substitute (– 2, – 1) for (x 1, y 1) and (6, – 1) for (x 2, y 2). Slope formula Substitution Simplify. Answer: 0
A. Find the slope of the line. A. B. C. D.
B. Find the slope of the line. A. 0 B. undefined C. 7 D.
C. Find the slope of the line. A. B. C. – 2 D. 2
D. Find the slope of the line. A. 0 B. undefined C. 3 D.
Use Slope as Rate of Change RECREATION In 2000, the annual sales for one manufacturer of camping equipment was $48. 9 million. In 2005, the annual sales were $85. 9 million. If sales increase at the same rate, what will be the total sales in 2015? Analyze Use the data given to graph the line that models the annual sales y as a function of the years x since 2000. The sales increase is constant. Plot the points (0, 48. 9) and (5, 85. 9) and draw a line through them. You want to find the sales in 2015.
Use Slope as Rate of Change Formulate Find the slope of the line. Use this rate of change to find the amount of sales in 2015. Determine Use the slope formula to find the slope of the line. The sales increased at an average of $7. 4 million per year.
Use Slope as Rate of Change Use the slope of the line and one known point on the line to calculate the sales y when the years x since 2000 is 15. Slope formula m = 7. 4, x 1 = 0, y 1 = 48. 9, x 2 = 15 Simplify. Multiply each side by 15. Add 48. 9 to each side.
Use Slope as Rate of Change Answer: Thus, the sales in 2015 will be about $159. 9 million. Justify From the graph we can estimate that in 2015, the sales will be a little more than $150 million. Evalulate Since 159. 9 is close to 150, our answer is reasonable.
CELLULAR TELEPHONES Between 1994 and 2000, the number of cellular telephone subscribers increased by an average rate of 14. 2 million per year. In 2000, the total subscribers were 109. 5 million. If the number of subscribers increases at the same rate, how many subscribers will there be in 2010? A. about 251. 5 million B. about 166. 3 million C. about 180. 5 million D. about 194. 7 million
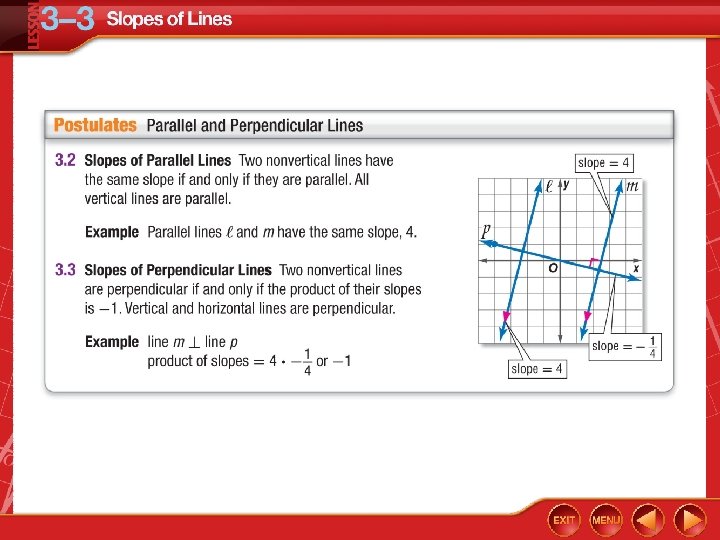
Determine Line Relationships Determine whether and are parallel, perpendicular, or neither for F(1, – 3), G(– 2, – 1), H(5, 0), and J(6, 3). Graph each line to verify your answer. Step 1 Find the slopes of and .
Determine Line Relationships Step 2 Determine the relationship, if any, between the lines. The slopes are not the same, so and are not parallel. The product of the slopes is So, perpendicular. and are not
Determine Line Relationships Answer: The lines are neither parallel nor perpendicular. Check When graphed, you can see that the lines are not parallel and do not intersect in right angles.
Determine whether AB and CD are parallel, perpendicular, or neither for A(– 2, – 1), B(4, 5), C(6, 1), and D(9, – 2) A. parallel B. perpendicular C. neither
Use Slope to Graph a Line Graph the line that contains Q(5, 1) and is parallel to MN with M(– 2, 4) and N(2, 1). First, find the slope of . Slope formula Substitution Simplify.
Use Slope to Graph a Line The slopes of two parallel lines are the same. The slope of the line parallel to Graph the line. Start at (5, 1). Move up 3 units and then move left 4 units. Label the point R. Draw . through Q(5, 1) is Answer: .
Graph the line that contains R(2, – 1) and is parallel to OP with O(1, 6) and P(– 3, 1). A. B. C. D. none of these
LESSON 3– 3 Slopes of Lines