Lesson 2 4 Graphical Misrepresentations of Data Objectives

Lesson 2 - 4 Graphical Misrepresentations of Data

Objectives • Describe what can make a graph misleading or deceptive

Vocabulary • None New

Common problems: • Vertical Axis – Inconsistent vertical scaling – Incorrect vertical scaling – Vertical axis that doesn’t start at zero • Scaling in pictures different than that reflected by the data • Class widths – Values overlap – Class widths different
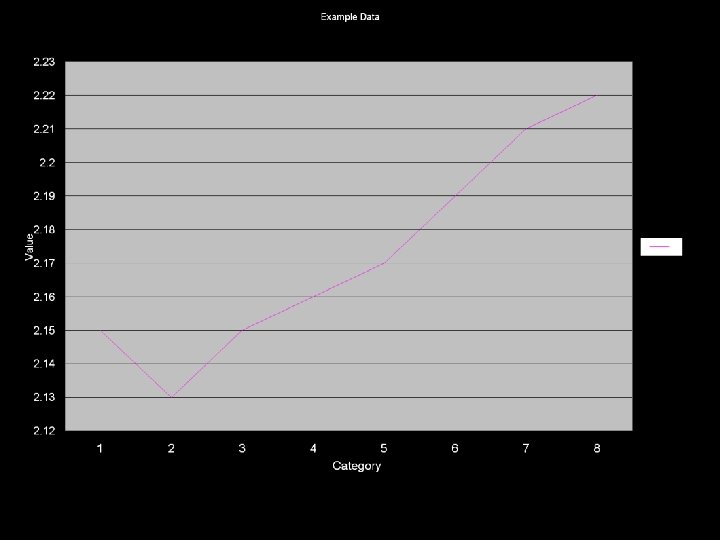
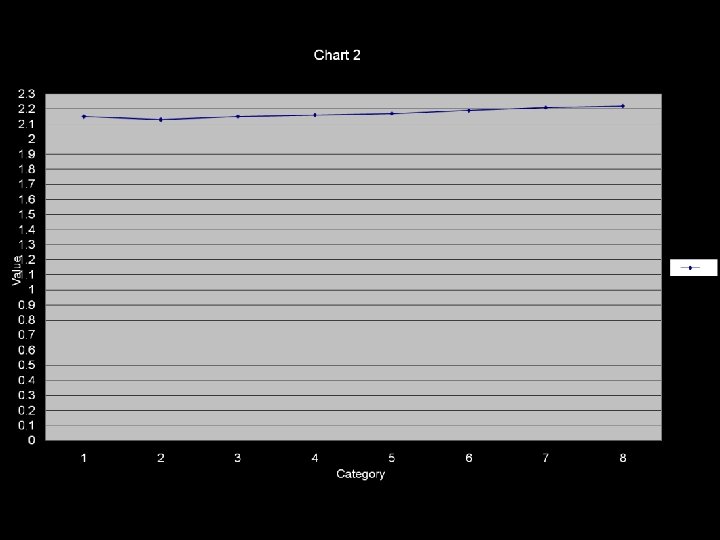

2, 5 Data 2 1, 5 Data 1 0, 5 0 1 2 3 4 5 6 7 8

US Hurricane Strikes By Decades 30 25 20 Total Major 15 10 5 0 1851 -1860 1861 -1870 1871 -1880 1881 -1890 1891 -1900 1901 -1910 1911 -1920 1921 -1930 1931 -1940 1941 -1950 1951 -1960 1961 -1970 1971 -1980 1981 -1990 1991 -2000 2001 -2004

Characteristics of Good Graphics: • Label the graphic clearly and provide explanations if needed • Avoid distortion. Don’t lie about the data • Avoid three-dimensions. Look nice, but often distract reader and result in misinterpretation • Don’t use more than one design in the same graphic. – Let the numbers speak for themselves – Sometimes graphs use a different design in a portion of the graphic to call attention to it

Summary and Homework • Summary – Good graphs speak for themselves – Avoid well-intended, but misleading flaws • Homework: – pg 107 -109: 1, 2, 7, 8, 13, 14
- Slides: 10