Lesson 13 More SGPLOT examples MAP Plotting Questions

 data")
; if eversmk = 2 then smoker = 0; else")


 • There")


; county =")


- Slides: 23
Lesson 13 More SGPLOT examples MAP Plotting Questions
* How to start a SAS program; * Starting with raw (text based) data ; data tomhs; infile ‘/folders/myfolders/tomhs. dat’; input statement with variables and formats; * Add new variables here; run; * Starting with SAS dataset; libname t ‘/folders/myfolders/’; data tomhs; set t. tomhs; * Add new variables here; run;
* Coding for smoker (0/1); if eversmk = 2 then smoker = 0; else smoker = 2 -nowsmk; Did you ever smoke cigarettes? 1 = yes, 2= no Var: eversmk Do you now smoke cigarettes? 1 = yes, 2= no Var: nowsmk Note: Second question only answered if first question is answered yes.
SCATTER vs SERIES vs REG vs STEP Obs 1 2 3 4 5 6 7 8 9 10 11 12 13 14 15 16 17 18 19 20 21 22 23 24 25 26 27 28 29 30 trt month cd 4 1 1 1 1 2 2 2 2 0 1 2 3 6 9 12 15 18 21 24 27 30 33 36 102 177 192 195 217 232 252 270 287 305 323 337 343 360 376 102 184 194 202 223 249 273 299 323 339 363 386 392 394 418 Want to plot mean CD 4 levels over time for each of two groups.
* Scatter Plot for 2 groups; proc sgplot; xaxis label = 'Months After Start of Therapy' values=(0 to 36 by 6); yaxis label = 'Mean CD 4 Level'; title 'Mean CD 4 After Start of Therapy by Treatment Type'; scatter x=month y=cd 4/group=trt ; format trt. F. ; label trt = 'Treatment Group'; run;
* Series plot connects the points, marker option needed to plot symbols at each visit; proc sgplot; series x=month y=cd 4/group=trt markers ; run;
* Regression plot does scatter plot and adds regression line; proc sgplot; reg x=month y=cd 4/group=trt run; ;
* Step plot connects points with a step function; proc sgplot; step x=month y=cd 4/group=trt ; run;
SAS MAPS: Choropleth Map
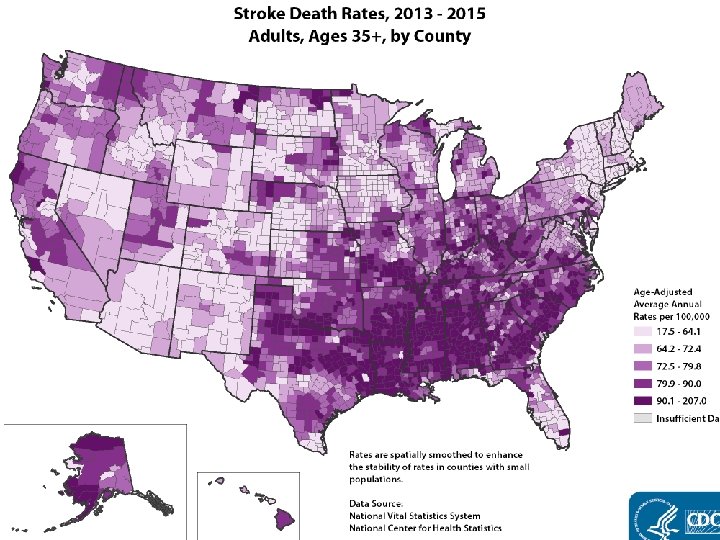
Map Design • There is an overall region (like country or state) • There are sub-divisions of the region (like counties within states or states within country) • Use color-coding to show data by sub-division (e. g. population, ethnicity, election results, length of growing season, stroke rates).
SAS Tools • SAS has map datasets with latitude and longitude coordinates • PROC GPROJECT projects the map dataset so points will plot properly on 2 D image. • PROC GMAP generates map with data associated with sub-regions of plot.
pattern 1 pattern 2 pattern 3 pattern 4 pattern 5 pattern 6 c=CXAAAAFF c=CX 6 F 6 FFF c=CX 3333 FF c=CXEEA 6 A 6 c=CXE 26262 c=CXCD 2626 ; ; ; Sets colors for 6 margin of victory levels. 1 -3 are shades of blue, 4 -6 are shades of red. * Choro is a choropleth map; proc gmap map=mn_county data=county all; id county; choro wincat/ discrete ; format wincat. ; label wincat = 'Margin' ; This is dataset run; Values 1 -6 Needs to be on each dataset with margin of victory (1 -6) for each county. SAS supplied dataset that draws map
data mn_county; Has data to draw all county set maps. county; lines in US. State=27 is MN where state = 27; run; proc print data=mn_county (obs=10); run; Obs STATE SEGMENT COUNTY X Y 1 2 3 4 5 6 7 8 9 10 27 27 27 1 1 1 1 1 1. 63672 1. 63669 1. 63668 1. 62412 1. 62422 1. 62411 1. 62409 1. 63068 1. 63066 1. 63705 0. 81313 0. 81686 0. 82083 0. 82076 0. 81623 0. 81016 0. 80561 0. 80554 0. 80714 0. 80709
proc gproject data=mn_county out=mn_county; id county; run; Obs 1 2 3 4 5 6 7 8 9 10 X -. 004946566 -. 004906222 -. 004879097 0. 003679749 0. 003628907 0. 003728457 0. 003760163 -. 000803074 -. 000787884 -. 005206215 Y 0. 002584 0. 006315 0. 010286 0. 010210 0. 005679 -0. 000393 -0. 004944 -0. 005021 -0. 003457 STATE 27 27 27 SEGMENT 1 1 1 1 1 COUNTY 1 1 1 1 1
Linking Data with Map Obs 1 2 3 4 5 6 7 8 9 10 11 12 13 14 15 16 17 18 19 20 county 1 3 5 7 9 11 13 15 17 19 21 23 25 27 29 31 33 35 37 39 county_name AITKIN ANOKA BECKER BELTRAMI BENTON BIG STONE BLUE EARTH BROWN CARLTON CARVER CASS CHIPPEWA CHISAGO CLAY CLEARWATER COOK COTTONWOOD CROW WING DAKOTA DODGE wincat 4 4 5 2 5 4 2 6 3 6 5 1 5 2 5 3 6 5 1 5 Coded 1 -6 dependent on level of difference between Romney and Obama
pattern 1 pattern 2 pattern 3 pattern 4 pattern 5 pattern 6 c=CXAAAAFF c=CX 6 F 6 FFF c=CX 3333 FF c=CXEEA 6 A 6 c=CXE 26262 c=CXCD 2626 ; ; ; Sets colors for 6 margin of victory levels. 1 -3 are shades of blue, 4 -6 are shades of red. proc gmap map=mn_county data=county all; id county; choro wincat/ discrete ; format wincat. ; label wincat = 'Margin' ; run; This is dataset with margin of victory (1 -6) for each county. Needs to be on each dataset
Obama versus Romney: 2012
Trump versus Clinton: 2016
libname e '~/Election/2012/'; data election; set e. president_county_2012; where candidate_id in('0301', '0401'); county = county_id*2 - 1; drop state pctvote; run; proc sort; by county_id candidate_id; data county; set election; by county_id; retain Romney. Votes Obama. Votes ; if first. county_id then do; Romney. Votes =. ; Obama. Votes =. ; end; if candidate_id = '0301' then Romney. Votes = votes_candidate; if candidate_id = '0401' then Obama. Votes = votes_candidate; if last. county_id then output; drop votes_candidate_id; run; data county; set county; Romney. Pct = 100*Romney. Votes / totvotes; Obama. Pct = 100*Obama. Votes / totvotes; votedifpct = Romney. Pct - Obama. Pct ; if if if run; votedifpct votedifpct < -15 then wincat = 3; else < - 5 then wincat = 2; else < 0 then wincat = 1; else < 5 then wincat = 4; else < 15 then wincat = 5; else >=15 then wincat = 6; SAS Program to create map
proc format; value wincat 1 = 'Obama 0 -5' 2='Obama 5 -15' 3='Obama 15+' 4 = 'Romney 0 -5' 5='Romney 5 -15' 6='Romney 15+'; proc print; format wincat. ; run; goptions reset=all border device=png gsfname=gsf; pattern 1 c=CXAAAAFF ; pattern 2 c=CX 6 F 6 FFF ; pattern 3 c=CX 3333 FF ; pattern 4 c=CXEEA 6 A 6 ; pattern 6 c=CXCD 2626 ; pattern 5 c=CXE 26262 ; data mn_county; set maps. county; where state = 27; run; proc gproject data=mn_county out=mn_county; id county; run; filename gsf “election 2012. png"; proc gmap map=mn_county data=county all ; id county; choro wincat/ discrete ; format wincat. ; label wincat = 'Margin' ; run; quit;
Where to get help for SAS? • • Google Help within PC SAS Documentation on web: http: //support. sas. com/documentation/onlinedoc/bookshelf/93/ Take a class from SAS Take a class from OIT at U of M http: //it. umn. edu/list-courses (free online classes) • UCLA website www. ats. ucla. edu/stat/sas