
Lesson 13 Introducing Exponential Equations Integrated Math 10
- Slides: 19
Lesson 13 Introducing Exponential Equations Integrated Math 10 - Santowski 12/28/2021 Integrated Math 10 - Santowski 1
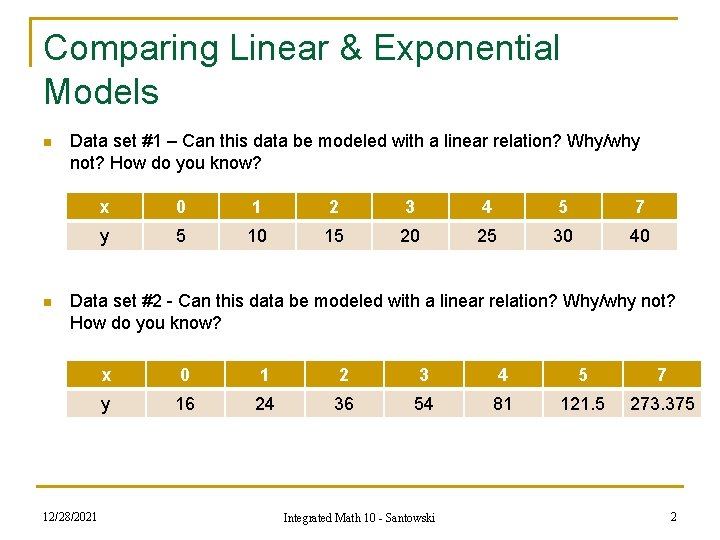
Comparing Linear & Exponential Models n n Data set #1 – Can this data be modeled with a linear relation? Why/why not? How do you know? x 0 1 2 3 4 5 7 y 5 10 15 20 25 30 40 Data set #2 - Can this data be modeled with a linear relation? Why/why not? How do you know? 12/28/2021 x 0 1 2 3 4 5 7 y 16 24 36 54 81 121. 5 273. 375 Integrated Math 10 - Santowski 2
HINT Any obvious number patterns in the data? ? n 12/28/2021 Integrated Math 10 - Santowski 3
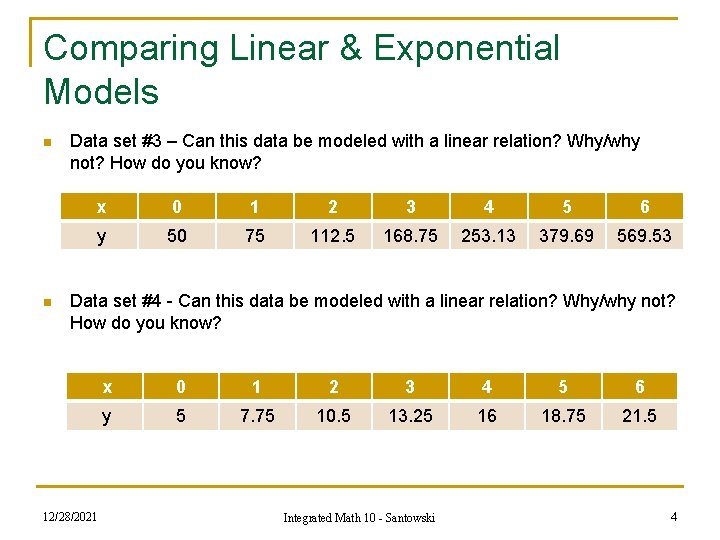
Comparing Linear & Exponential Models n n Data set #3 – Can this data be modeled with a linear relation? Why/why not? How do you know? x 0 1 2 3 4 5 6 y 50 75 112. 5 168. 75 253. 13 379. 69 569. 53 Data set #4 - Can this data be modeled with a linear relation? Why/why not? How do you know? 12/28/2021 x 0 1 2 3 4 5 6 y 5 7. 75 10. 5 13. 25 16 18. 75 21. 5 Integrated Math 10 - Santowski 4
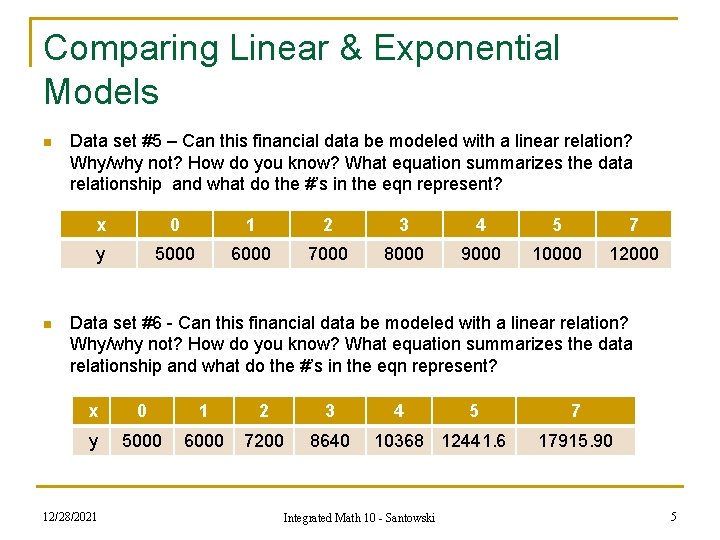
Comparing Linear & Exponential Models n n Data set #5 – Can this financial data be modeled with a linear relation? Why/why not? How do you know? What equation summarizes the data relationship and what do the #’s in the eqn represent? x 0 1 2 3 4 5 7 y 5000 6000 7000 8000 9000 10000 12000 Data set #6 - Can this financial data be modeled with a linear relation? Why/why not? How do you know? What equation summarizes the data relationship and what do the #’s in the eqn represent? x 0 1 2 3 y 5000 6000 7200 8640 12/28/2021 4 5 10368 12441. 6 Integrated Math 10 - Santowski 7 17915. 90 5
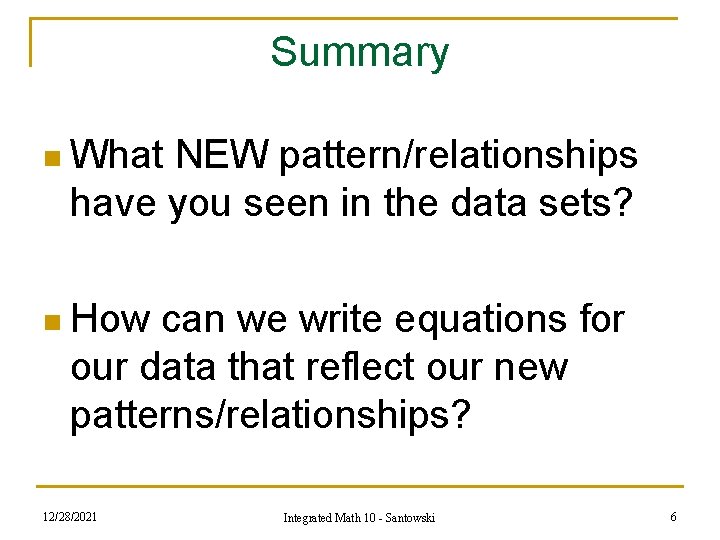
Summary n What NEW pattern/relationships have you seen in the data sets? n How can we write equations for our data that reflect our new patterns/relationships? 12/28/2021 Integrated Math 10 - Santowski 6
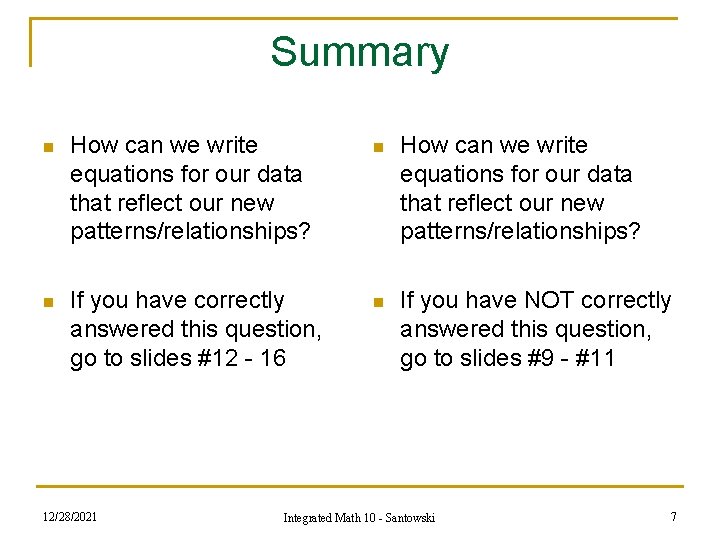
Summary n How can we write equations for our data that reflect our new patterns/relationships? n If you have correctly answered this question, go to slides #12 - 16 n If you have NOT correctly answered this question, go to slides #9 - #11 12/28/2021 Integrated Math 10 - Santowski 7
Additional data sets (if needed) 12/28/2021 Integrated Math 10 - Santowski 8
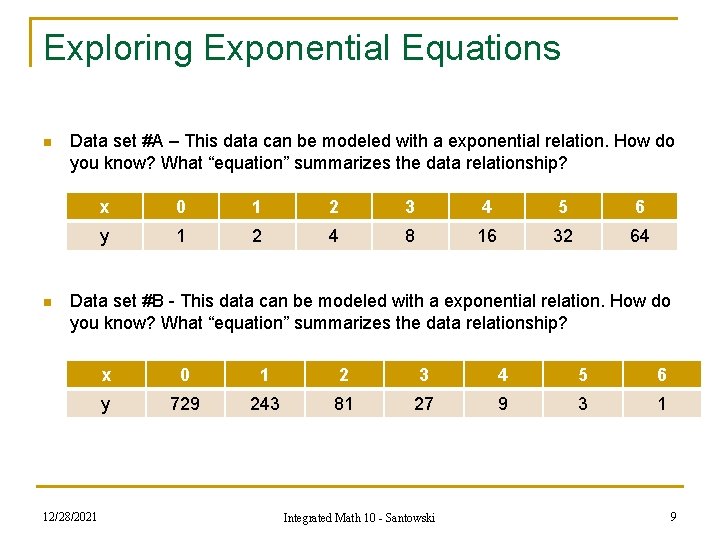
Exploring Exponential Equations n n Data set #A – This data can be modeled with a exponential relation. How do you know? What “equation” summarizes the data relationship? x 0 1 2 3 4 5 6 y 1 2 4 8 16 32 64 Data set #B - This data can be modeled with a exponential relation. How do you know? What “equation” summarizes the data relationship? 12/28/2021 x 0 1 2 3 4 5 6 y 729 243 81 27 9 3 1 Integrated Math 10 - Santowski 9
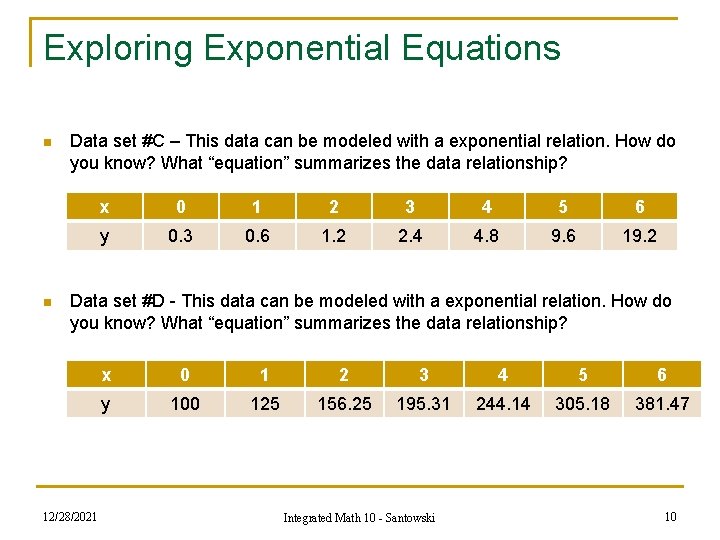
Exploring Exponential Equations n n Data set #C – This data can be modeled with a exponential relation. How do you know? What “equation” summarizes the data relationship? x 0 1 2 3 4 5 6 y 0. 3 0. 6 1. 2 2. 4 4. 8 9. 6 19. 2 Data set #D - This data can be modeled with a exponential relation. How do you know? What “equation” summarizes the data relationship? 12/28/2021 x 0 1 2 3 4 5 6 y 100 125 156. 25 195. 31 244. 14 305. 18 381. 47 Integrated Math 10 - Santowski 10
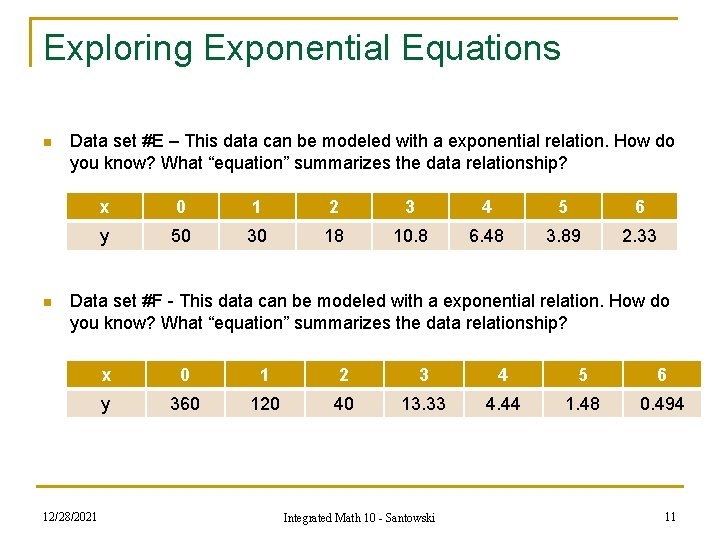
Exploring Exponential Equations n n Data set #E – This data can be modeled with a exponential relation. How do you know? What “equation” summarizes the data relationship? x 0 1 2 3 4 5 6 y 50 30 18 10. 8 6. 48 3. 89 2. 33 Data set #F - This data can be modeled with a exponential relation. How do you know? What “equation” summarizes the data relationship? 12/28/2021 x 0 1 2 3 4 5 6 y 360 120 40 13. 33 4. 44 1. 48 0. 494 Integrated Math 10 - Santowski 11
Application of Exponential Models 12/28/2021 Integrated Math 10 - Santowski 12
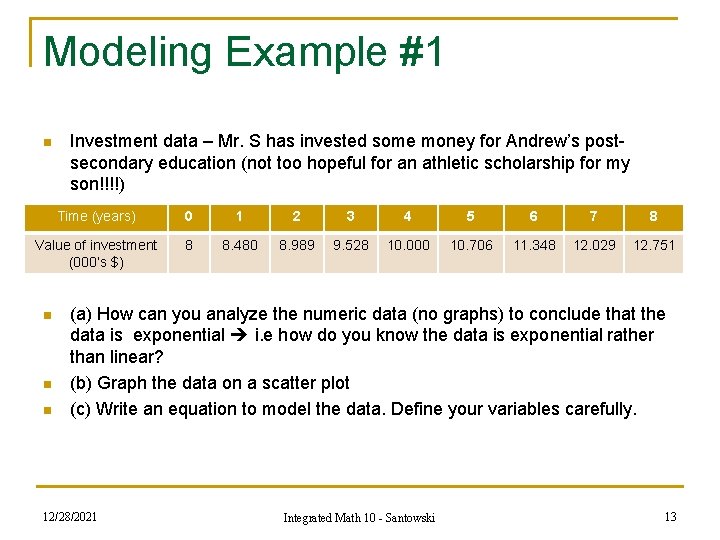
Modeling Example #1 n Investment data – Mr. S has invested some money for Andrew’s postsecondary education (not too hopeful for an athletic scholarship for my son!!!!) Time (years) 0 1 2 3 4 5 6 7 8 Value of investment (000’s $) 8 8. 480 8. 989 9. 528 10. 000 10. 706 11. 348 12. 029 12. 751 n n n (a) How can you analyze the numeric data (no graphs) to conclude that the data is exponential i. e how do you know the data is exponential rather than linear? (b) Graph the data on a scatter plot (c) Write an equation to model the data. Define your variables carefully. 12/28/2021 Integrated Math 10 - Santowski 13
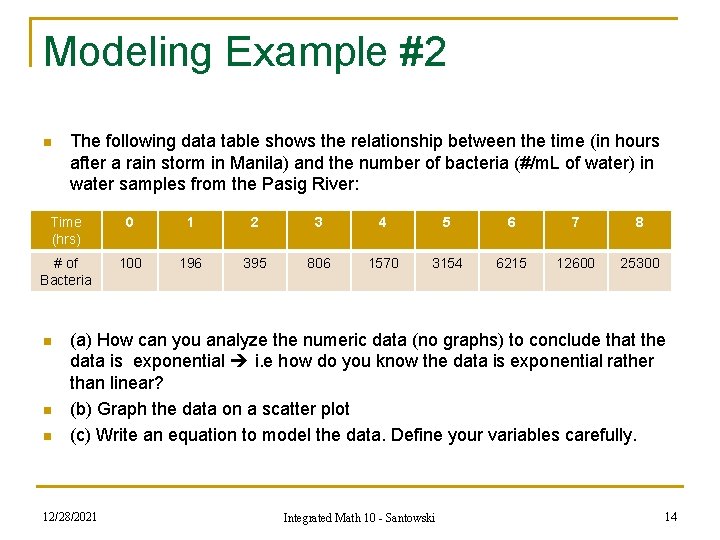
Modeling Example #2 n The following data table shows the relationship between the time (in hours after a rain storm in Manila) and the number of bacteria (#/m. L of water) in water samples from the Pasig River: Time (hrs) 0 1 2 3 4 5 6 7 8 # of Bacteria 100 196 395 806 1570 3154 6215 12600 25300 n n n (a) How can you analyze the numeric data (no graphs) to conclude that the data is exponential i. e how do you know the data is exponential rather than linear? (b) Graph the data on a scatter plot (c) Write an equation to model the data. Define your variables carefully. 12/28/2021 Integrated Math 10 - Santowski 14
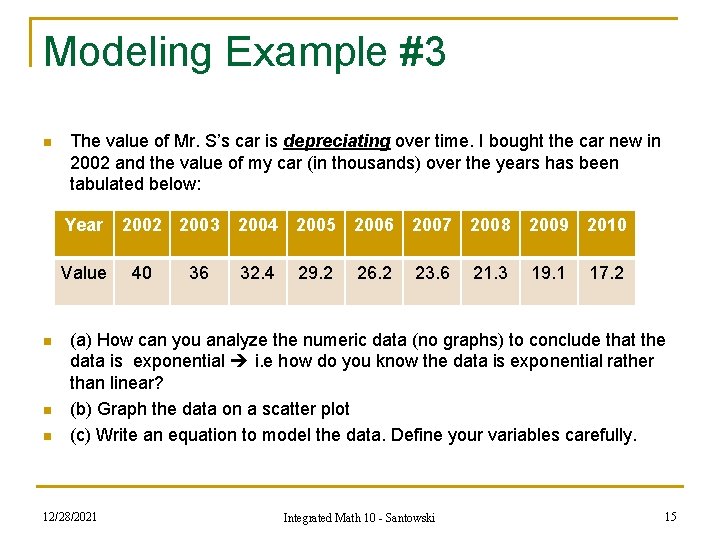
Modeling Example #3 n The value of Mr. S’s car is depreciating over time. I bought the car new in 2002 and the value of my car (in thousands) over the years has been tabulated below: Year Value n n n 2002 2003 40 36 2004 2005 2006 2007 2008 2009 2010 32. 4 29. 2 26. 2 23. 6 21. 3 19. 1 17. 2 (a) How can you analyze the numeric data (no graphs) to conclude that the data is exponential i. e how do you know the data is exponential rather than linear? (b) Graph the data on a scatter plot (c) Write an equation to model the data. Define your variables carefully. 12/28/2021 Integrated Math 10 - Santowski 15
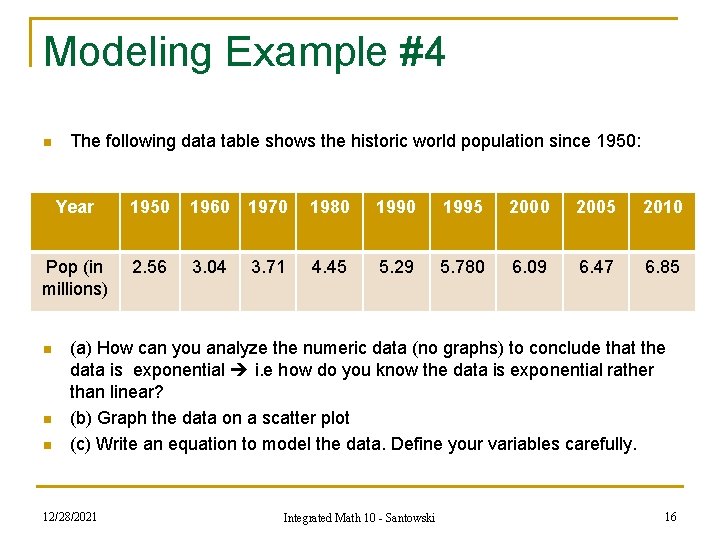
Modeling Example #4 n The following data table shows the historic world population since 1950: Year 1950 1960 1970 1980 1995 2000 2005 2010 Pop (in millions) 2. 56 3. 04 3. 71 4. 45 5. 29 5. 780 6. 09 6. 47 6. 85 n n n (a) How can you analyze the numeric data (no graphs) to conclude that the data is exponential i. e how do you know the data is exponential rather than linear? (b) Graph the data on a scatter plot (c) Write an equation to model the data. Define your variables carefully. 12/28/2021 Integrated Math 10 - Santowski 16
SUMMARY n Write a SINGLE equation that summarizes the data relationships you have investigated this lesson. 12/28/2021 Integrated Math 10 - Santowski 17
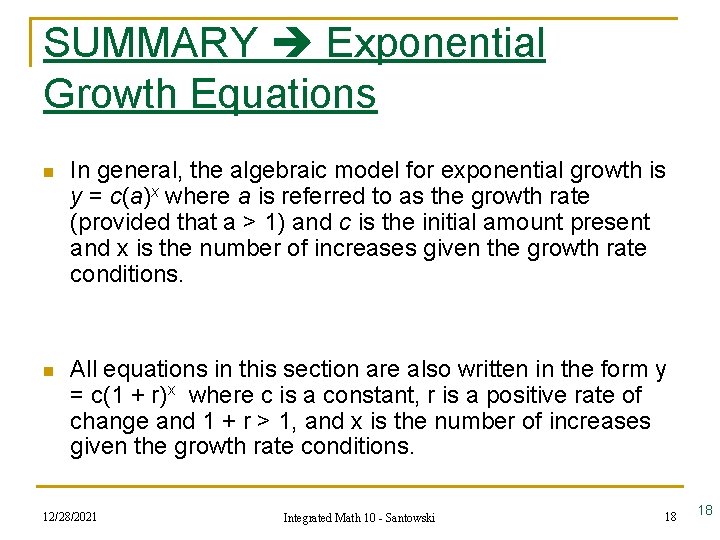
SUMMARY Exponential Growth Equations n In general, the algebraic model for exponential growth is y = c(a)x where a is referred to as the growth rate (provided that a > 1) and c is the initial amount present and x is the number of increases given the growth rate conditions. n All equations in this section are also written in the form y = c(1 + r)x where c is a constant, r is a positive rate of change and 1 + r > 1, and x is the number of increases given the growth rate conditions. 12/28/2021 Integrated Math 10 - Santowski 18 18
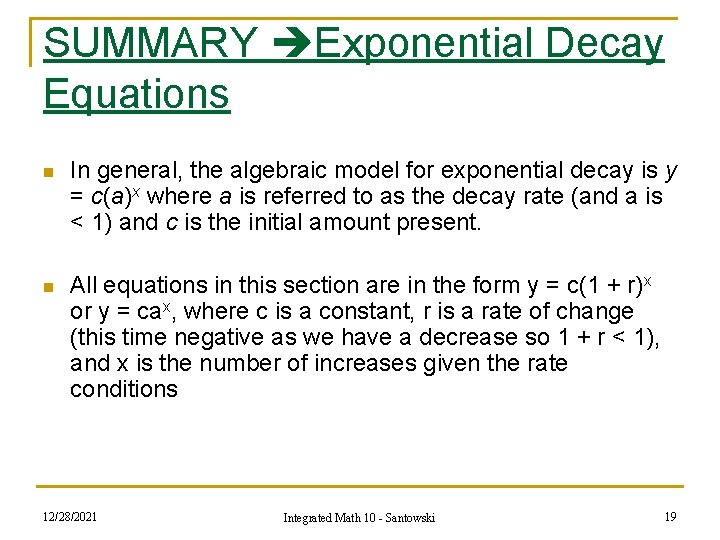
SUMMARY Exponential Decay Equations n In general, the algebraic model for exponential decay is y = c(a)x where a is referred to as the decay rate (and a is < 1) and c is the initial amount present. n All equations in this section are in the form y = c(1 + r)x or y = cax, where c is a constant, r is a rate of change (this time negative as we have a decrease so 1 + r < 1), and x is the number of increases given the rate conditions 12/28/2021 Integrated Math 10 - Santowski 19