Lesson 1 Section 1 6 Powers Polynomials Rational


 x 3+ 2 x 2 -3")

 if p = 0? What happens to f(x) if q")
 and")

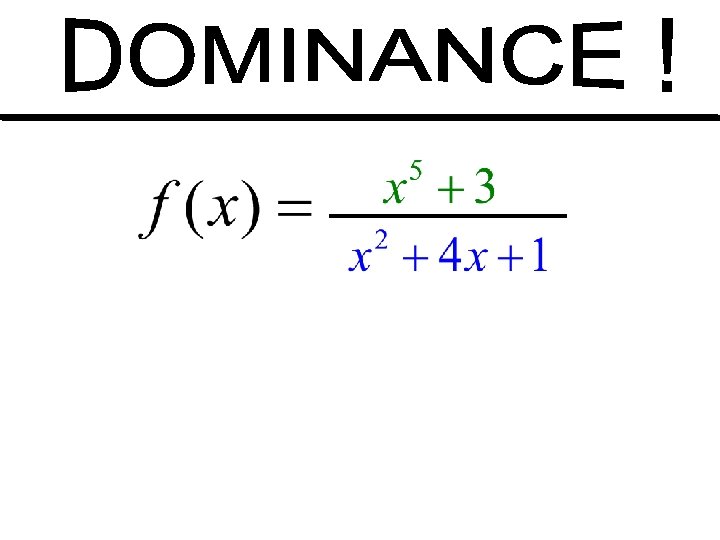
, who will dominate the fraction, the numerator")

 2 3 x Graph y = 2.")
 2 3 x Graph y = 2.")
 x 2 – 2 x – 3")
 x 2 – 2 x – 3")
- Slides: 16
Lesson 1: ____ Section 1. 6 Powers, Polynomials, & Rational Functions Even Degree : U-shaped Odd Degree : Seat-shaped
Polynomial Functions are a sum of powers at most • • at most The graphs are continuous (pencil never leaves the paper) All of the turns are smooth, gradual turns (no sharp corners) Domain is all real numbers Right & Left behavior are predictable based on lead coefficient and degree
Let’s try an example! y = (- 1/5) x 3+ 2 x 2 -3 x-4
Ex. Give a possible equation for the graph shown 2 1 5 10
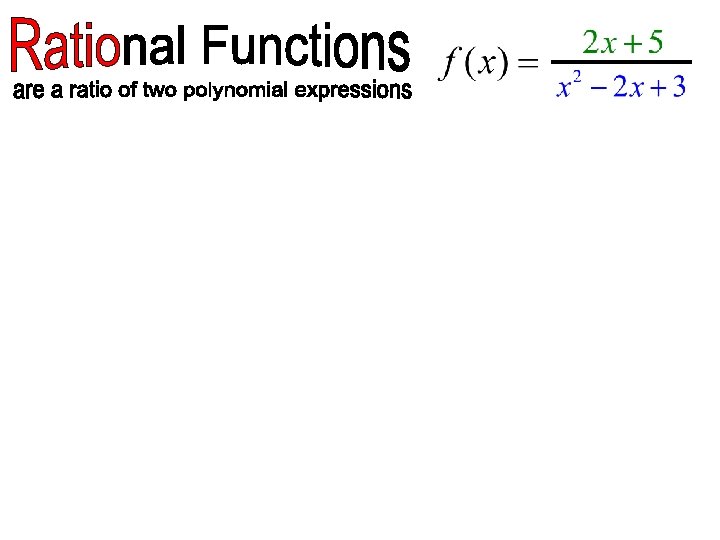
What happens to f(x) if p = 0? What happens to f(x) if q = 0?
GRAPHING RATIONAL FUNCTIONS CONCEPT SUMMARY GRAPHS OF RATIONAL FUNCTIONS Let p (x ) and q (x ) be polynomials with no common factors other than 1. The graph of the rational function p (x ) f (x ) = = q (x ) a m x m + a m – 1 x m – 1 + … + a 1 x + a 0 b n x n + b n – 1 x n – 1 + … + b 1 x + b 0 has the following characteristics. 1. x - intercepts are the real zeros of p (x ) 2. vertical asymptote at each real zero of q (x ) 3. at most one horizontal asymptote
GRAPHING RATIONAL FUNCTIONS CONCEPT SUMMARY GRAPHS OF RATIONAL FUNCTIONS a m x m + a m – 1 x m – 1 + … + a 1 x + a 0 p (x ) f (x ) = = q (x ) b n x n + b n – 1 x n – 1 + … + b 1 x + b 0 3. at most one horizontal asymptote at each zero of q (x ) • If m < n, the line y = 0 is a horizontal asymptote. • If m = n, the line y = am bn is a horizontal asymptote. • If m > n, the graph has no horizontal asymptote.
As x becomes extremely large (x ), who will dominate the fraction, the numerator or the denominator? As x becomes extremely large (x ), what will f(x) approach?
3 x 2 - 4 x + 3
Graphing a Rational Function (m = n) 2 3 x Graph y = 2. x – 4 SOLUTION The numerator has 0 as its only zero, so the graph has one x-intercept at (0, 0). The denominator can be factored as (x + 2)(x – 2), so the denominator has zeros at 2 and – 2. This implies vertical asymptotes at x = – 2 and x = 2. The degree of the numerator (2) is equal to the degree of the denominator (2), am so the horizontal asymptote is y = = 3. bn
Graphing a Rational Function (m = n) 2 3 x Graph y = 2. x – 4 To draw the graph, plot points between and beyond vertical asymptotes. To the left of x = – 2 Between x = – 2 and x = 2 To the right of x = 2 x yy – 4 4 – 3 5. 4 – 1 0 0 1 – 1 3 5. 4 4 4
Graphing a Rational Function (m > n) x 2 – 2 x – 3 Graph y =. x+4 SOLUTION The numerator can be factored as ( x – 3) and ( x + 1); the x-intercepts are 3 and – 1. The only zero of the denominator is – 4, so the only vertical asymptote is x = – 4. The degree of the numerator (2) is greater than the degree of the denominator (1), so there is no horizontal asymptote and the end behavior of the graph of f is the same as the end behavior of the graph of y = x 2 – 1 = x.
Graphing a Rational Function (m > n) x 2 – 2 x – 3 Graph y =. x+4 To draw the graph, plot points to the left and right of the vertical asymptote. To the left of x = – 4 To the right of x = – 4 x yy – 12 – 20. 6 – 9 – 19. 2 – 6 – 22. 5 – 2 2. 5 0 – 0. 75 2 – 0. 5 4 0. 63 6 2. 1