
Lesson 1 Pass the Squeeze 1 Describe the
Lesson 1: Pass the Squeeze
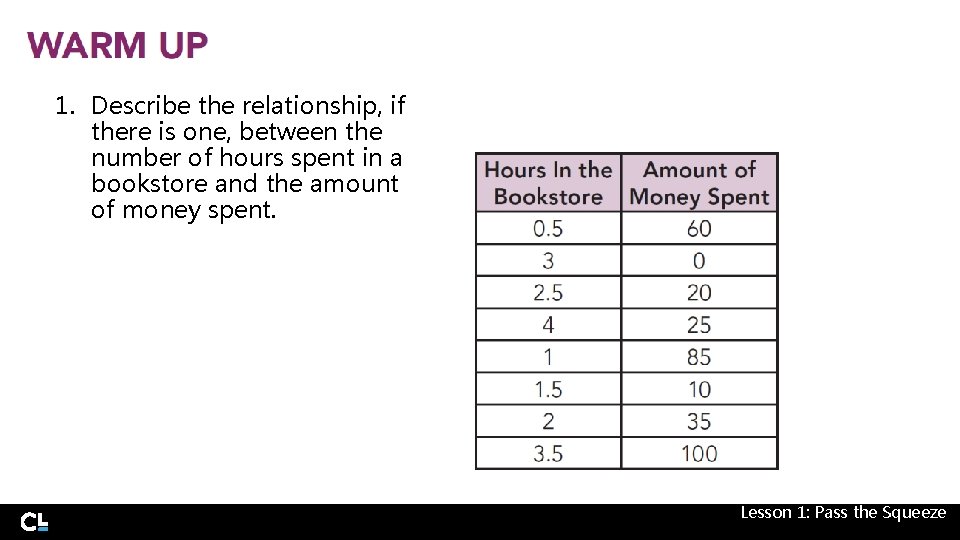
1. Describe the relationship, if there is one, between the number of hours spent in a bookstore and the amount of money spent. Lesson 1: Pass the Squeeze
LEARNING GOALS • Define bivariate data. • Collect and record bivariate data. • Construct and interpret scatter plots for bivariate data to investigate patterns of association. • Interpret collected data displayed on a scatter plot and in a table. • Use a scatter plot to determine if there is no relationship or a linear or non-linear relationship between two quantities. Lesson 1: Pass the Squeeze • Identify potential outliers in a scatter plot.
KEY TERMS • • bivariate data explanatory variable response variable association • • linear association positive association negative association outlier You have analyzed relationships and characteristics of many graphs. How can you describe patterns of association in a scatter plot of bivariate data? Lesson 1: Pass the Squeeze
The School Spirit Club plans to sell sweatpants and sweatshirt sets with the school’s logo. The club is determining if there is a way to package sweatshirt and sweatpants sets so that most of the students can buy a set that will fit. Lesson 1: Pass the Squeeze
1. Do you think there might be a relationship between the sweatpant size and the sweatshirt size a person would buy? Why or why not? Lesson 1: Pass the Squeeze
When collecting information about a person or thing, the specific characteristic of the information gathered can be called a variable. Previously, you have seen variables in mathematics refer to a letter or symbol to represent a number. In this case, a variable can refer to any characteristic that can change, or vary. 2. Name a variable that can affect a sweatshirt size. Lesson 1: Pass the Squeeze
3. Do you think collecting information about one sweatshirt characteristic is enough to determine which shirt sizes should be paired with which pant sizes? Lesson 1: Pass the Squeeze
The School Spirit Club decides to collect students’ heights and arm spans. They hope that collecting this information can determine if there is a relationship between sweatshirt size and sweatpant size. When you collect information about two separate characteristics for the same person, thing, or event, you have collected bivariate data. 4. Why is it important to record each student’s height and arm span? Lesson 1: Pass the Squeeze
One way to show the relationship between bivariate data is to create a graph that can represent the two variables. The School Spirit Club created a scatter plot using height as the x-coordinate and arm span as the y-coordinate. Lesson 1: Pass the Squeeze
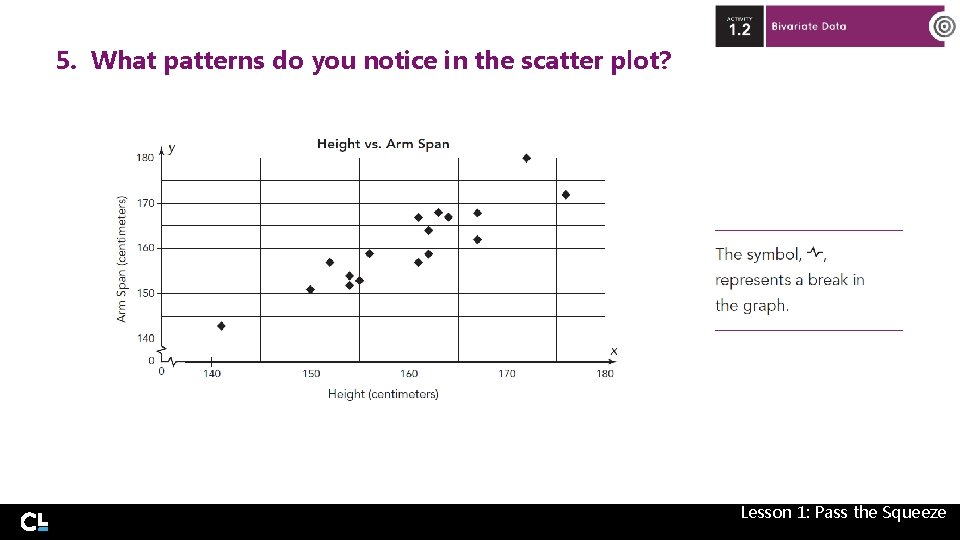
5. What patterns do you notice in the scatter plot? Lesson 1: Pass the Squeeze
6. Now that you have informally analyzed the data represented by a scatter plot, what conclusions can you reach about the relationship between a student's height and arm span? Lesson 1: Pass the Squeeze
7. How could your conclusions help the School Spirit Club decide how to package their sets of sweatshirts and sweatpants? Lesson 1: Pass the Squeeze
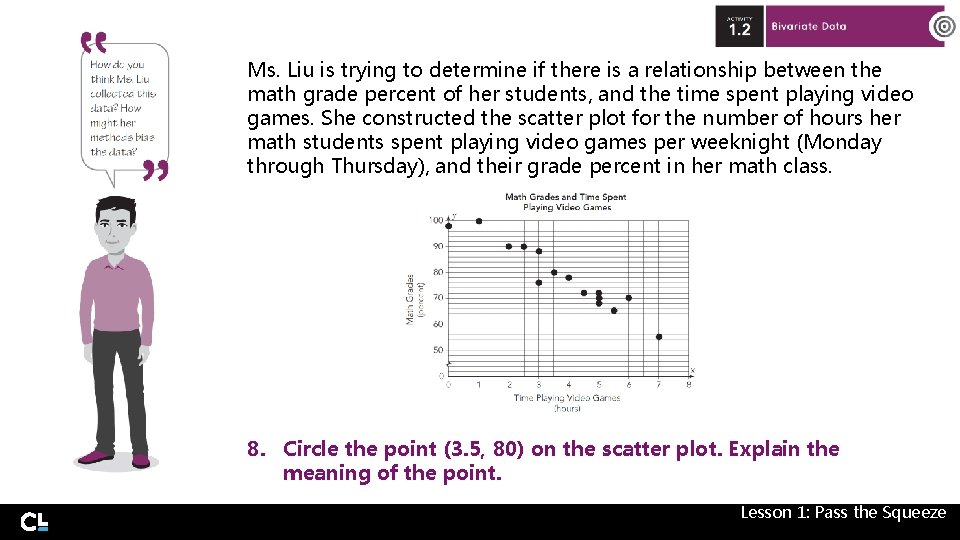
Ms. Liu is trying to determine if there is a relationship between the math grade percent of her students, and the time spent playing video games. She constructed the scatter plot for the number of hours her math students spent playing video games per weeknight (Monday through Thursday), and their grade percent in her math class. 8. Circle the point (3. 5, 80) on the scatter plot. Explain the meaning of the point. Lesson 1: Pass the Squeeze
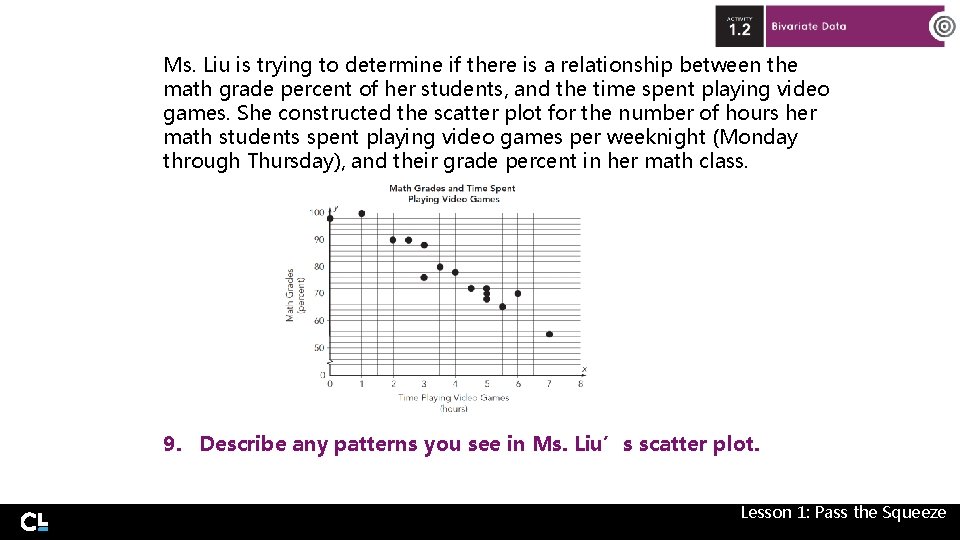
Ms. Liu is trying to determine if there is a relationship between the math grade percent of her students, and the time spent playing video games. She constructed the scatter plot for the number of hours her math students spent playing video games per weeknight (Monday through Thursday), and their grade percent in her math class. 9. Describe any patterns you see in Ms. Liu’s scatter plot. Lesson 1: Pass the Squeeze
10. What conclusions can you make about the relationship between math grade percent and time spent playing video games? Lesson 1: Pass the Squeeze
When you look for a relationship in bivariate data, often you are interested in determining whether one variable causes a change in the other variable. In this case, one variable, the explanatory variable, is designated as the independent variable, and the response variable, is designated as the dependent variable. Lesson 1: Pass the Squeeze
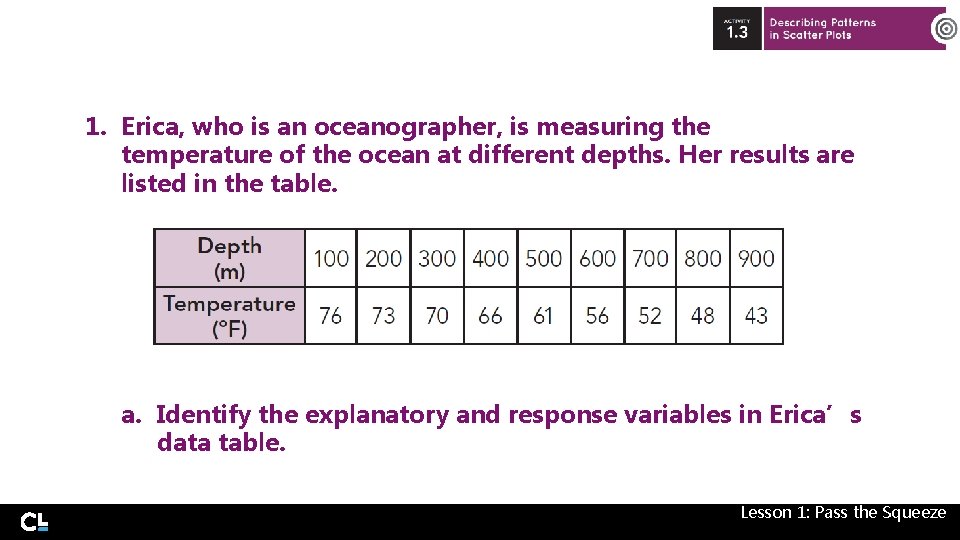
1. Erica, who is an oceanographer, is measuring the temperature of the ocean at different depths. Her results are listed in the table. a. Identify the explanatory and response variables in Erica’s data table. Lesson 1: Pass the Squeeze
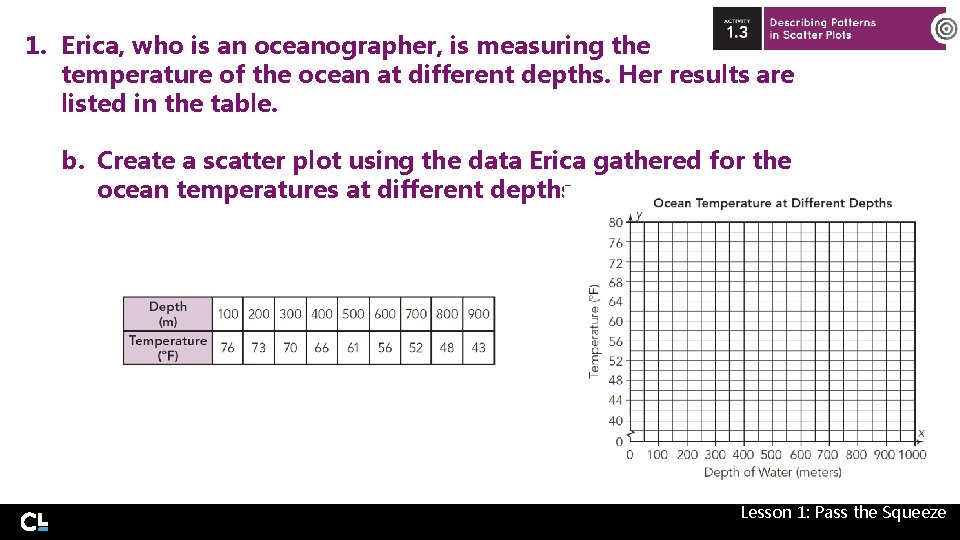
1. Erica, who is an oceanographer, is measuring the temperature of the ocean at different depths. Her results are listed in the table. b. Create a scatter plot using the data Erica gathered for the ocean temperatures at different depths. Lesson 1: Pass the Squeeze
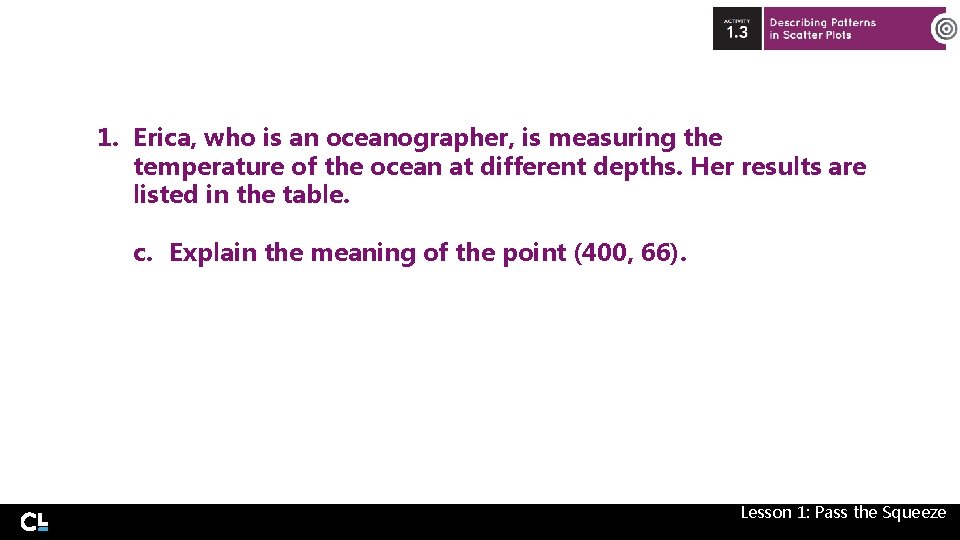
1. Erica, who is an oceanographer, is measuring the temperature of the ocean at different depths. Her results are listed in the table. c. Explain the meaning of the point (400, 66). Lesson 1: Pass the Squeeze
1. Erica, who is an oceanographer, is measuring the temperature of the ocean at different depths. Her results are listed in the table. d. What relationship does the scatter plot show between the depth of the ocean water and the temperature of the water? Lesson 1: Pass the Squeeze
As you have experienced, scatter plots can be great tools to identify patterns in bivariate data. Sometimes, these patterns or relationship are called associations. One common pattern that exists in data is when the points on a scatter plot form a linear association. In that case, the data values are arranged in such a way that, as you look at the graph from left to right, you can imagine a line going through the scatter plot with most of the points being close to the line. Lesson 1: Pass the Squeeze
1. Erica, who is an oceanographer, is measuring the temperature of the ocean at different depths. Her results are listed in the table. e. Explain how there seems to be a linear association between the depth of the ocean water and the water temperature. Lesson 1: Pass the Squeeze
If two variables have a linear association, you can then determine th type of association between two variables. The two variables have a positive association if, as the explanatory variable increases, the response variable also increases. If the response variable decreases as the explanatory variable increases, then the two variables have a negative association. Once you identify the pattern for two variabl with a linear relationship, you can state the association between the two variables. Lesson 1: Pass the Squeeze
1. Erica, who is an oceanographer, is measuring the temperature of the ocean at different depths. Her results are listed in the table. f. Describe the type of association that exists between the depth of the ocean water and the water temperature. State the association in terms of the variables. Lesson 1: Pass the Squeeze
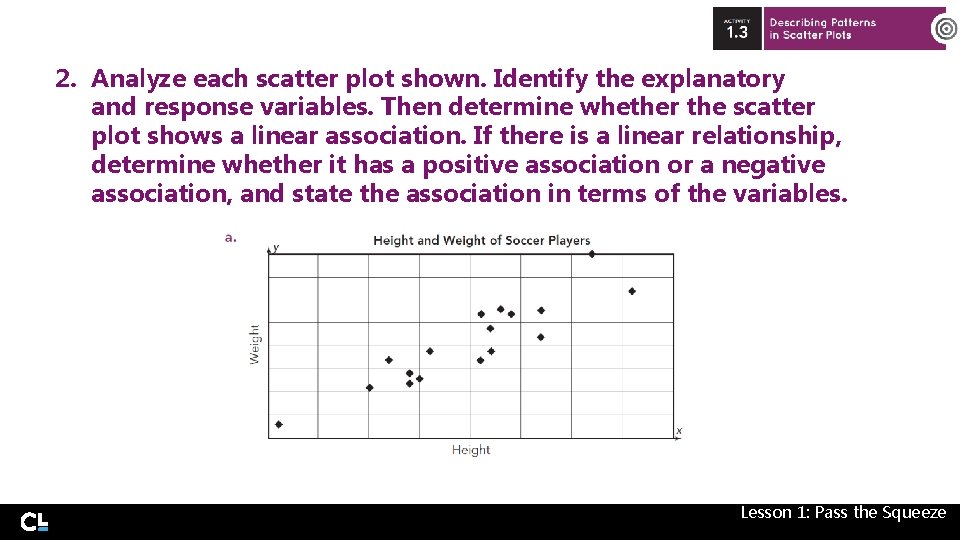
2. Analyze each scatter plot shown. Identify the explanatory and response variables. Then determine whether the scatter plot shows a linear association. If there is a linear relationship, determine whether it has a positive association or a negative association, and state the association in terms of the variables. Lesson 1: Pass the Squeeze
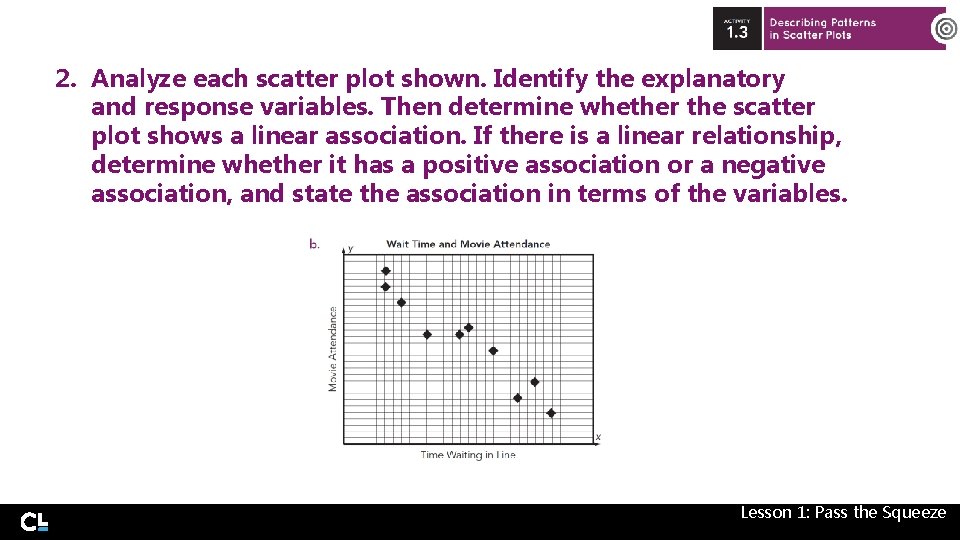
2. Analyze each scatter plot shown. Identify the explanatory and response variables. Then determine whether the scatter plot shows a linear association. If there is a linear relationship, determine whether it has a positive association or a negative association, and state the association in terms of the variables. Lesson 1: Pass the Squeeze
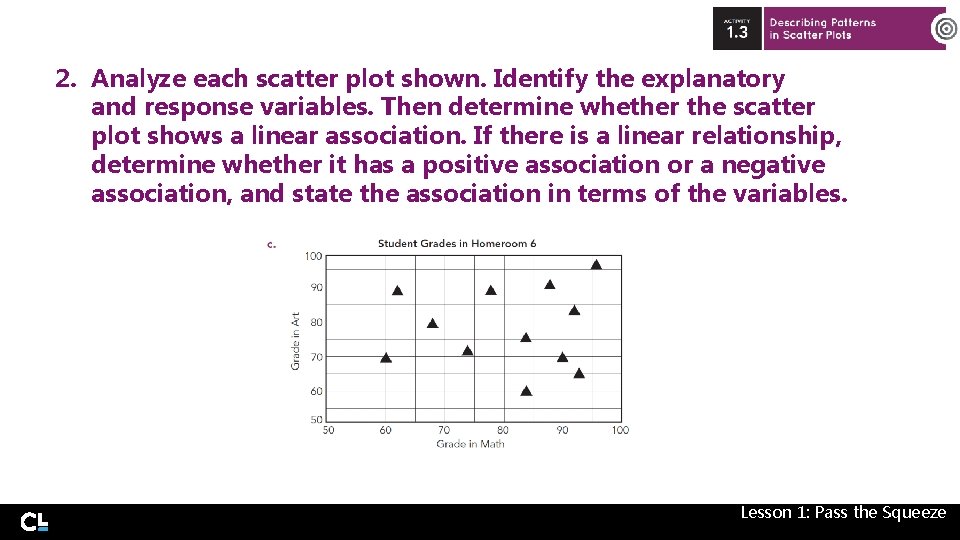
2. Analyze each scatter plot shown. Identify the explanatory and response variables. Then determine whether the scatter plot shows a linear association. If there is a linear relationship, determine whether it has a positive association or a negative association, and state the association in terms of the variables. Lesson 1: Pass the Squeeze
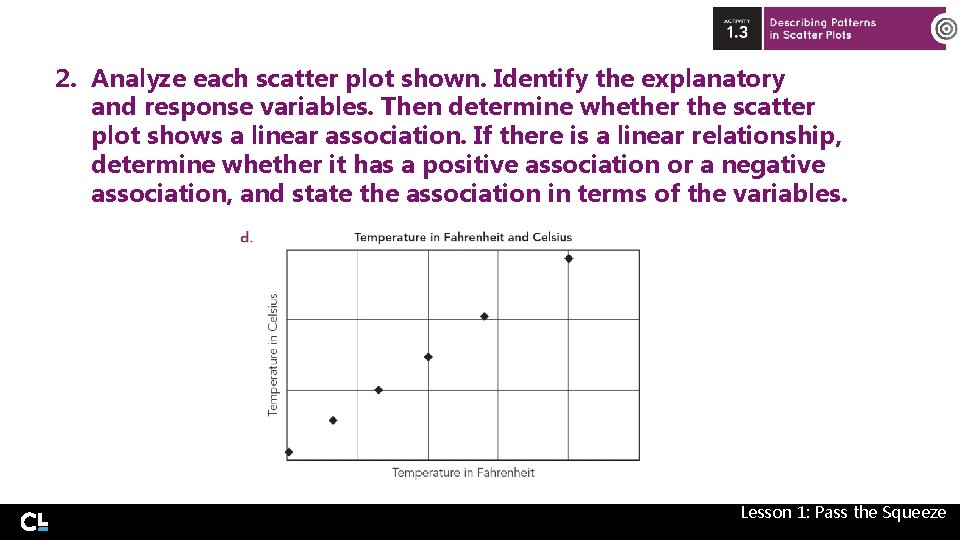
2. Analyze each scatter plot shown. Identify the explanatory and response variables. Then determine whether the scatter plot shows a linear association. If there is a linear relationship, determine whether it has a positive association or a negative association, and state the association in terms of the variables. Lesson 1: Pass the Squeeze
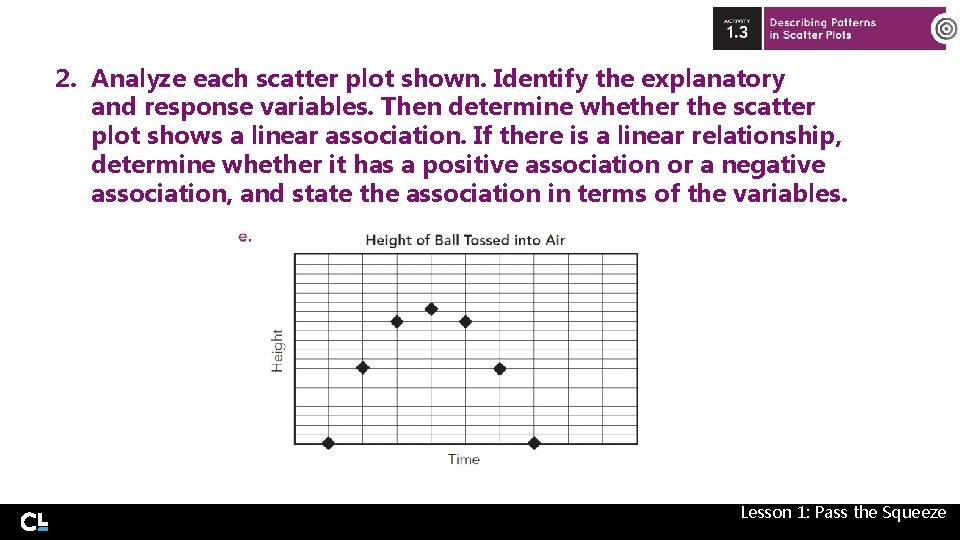
2. Analyze each scatter plot shown. Identify the explanatory and response variables. Then determine whether the scatter plot shows a linear association. If there is a linear relationship, determine whether it has a positive association or a negative association, and state the association in terms of the variables. Lesson 1: Pass the Squeeze
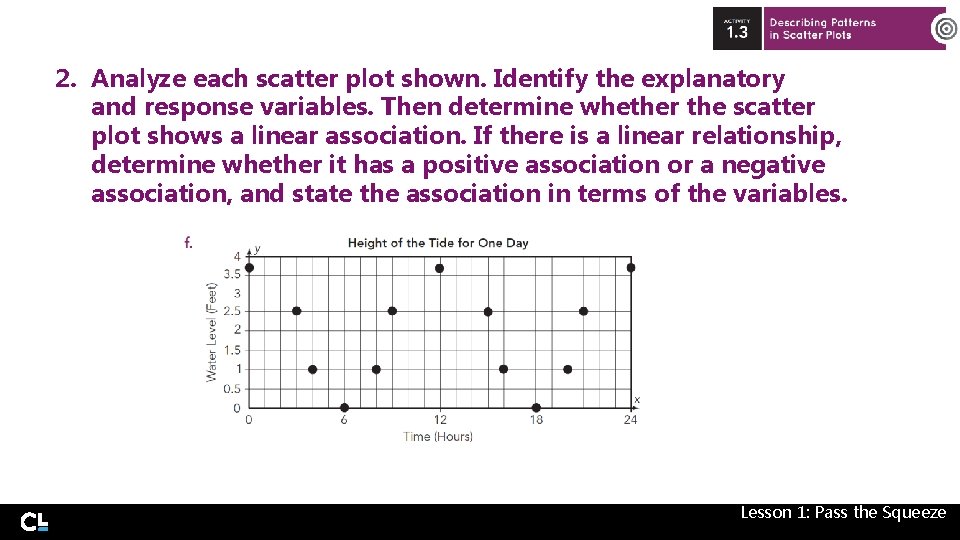
2. Analyze each scatter plot shown. Identify the explanatory and response variables. Then determine whether the scatter plot shows a linear association. If there is a linear relationship, determine whether it has a positive association or a negative association, and state the association in terms of the variables. Lesson 1: Pass the Squeeze
To be a safe driver, you need to understand the factors that affect a car’s stopping distance. The stopping distance depends on two factors: • The thinking distance is the distance travelled in between the driver realizing he needs to brake and actually braking. • The braking distance is the distance taken to stop once the brakes are applied. Lesson 1: Pass the Squeeze
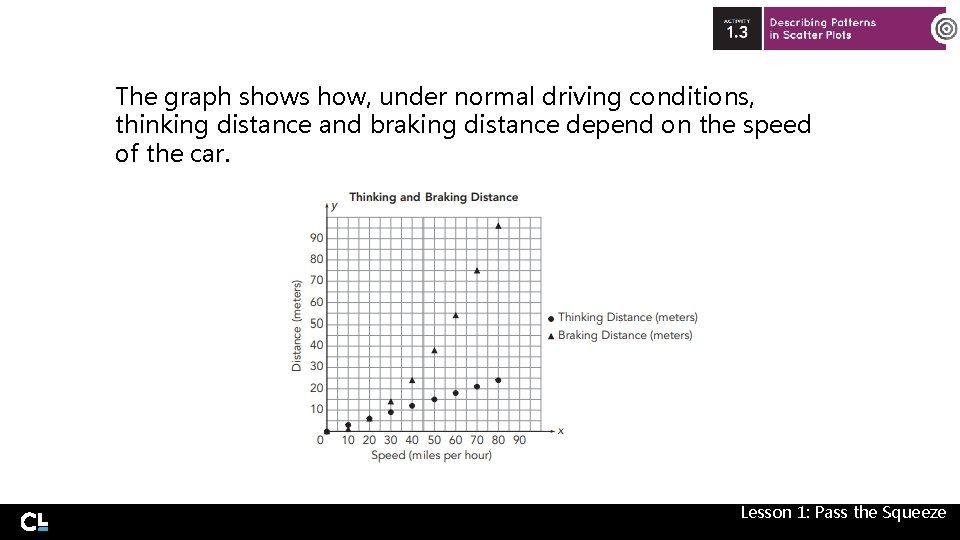
The graph shows how, under normal driving conditions, thinking distance and braking distance depend on the speed of the car. Lesson 1: Pass the Squeeze
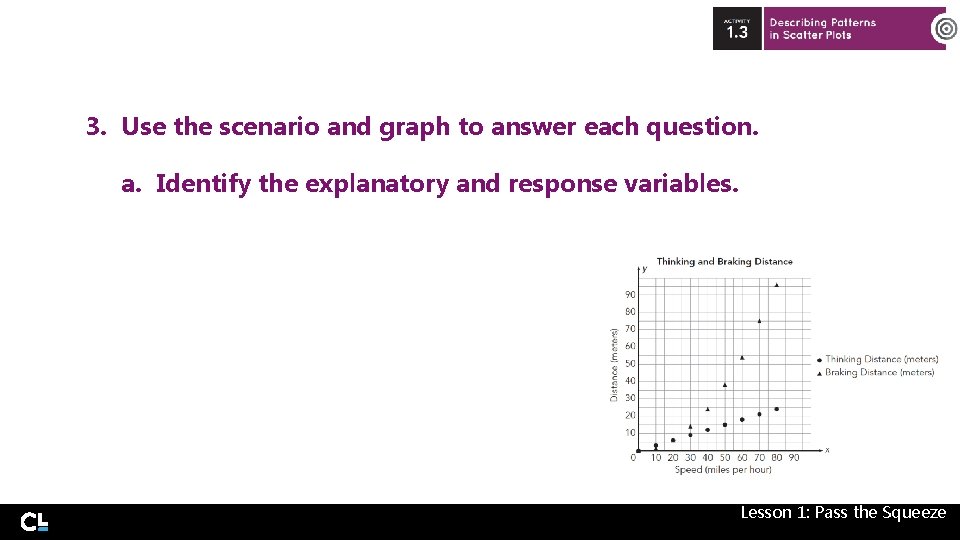
3. Use the scenario and graph to answer each question. a. Identify the explanatory and response variables. Lesson 1: Pass the Squeeze
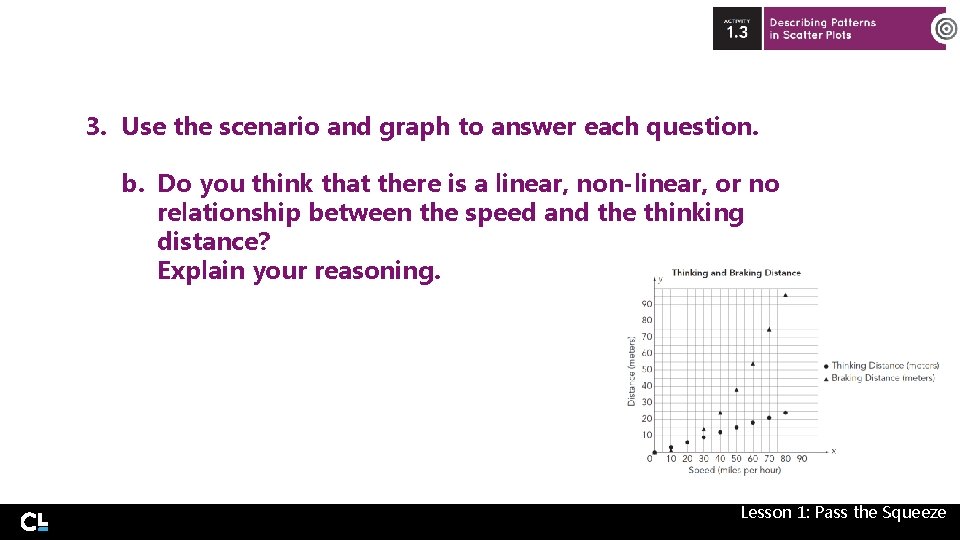
3. Use the scenario and graph to answer each question. b. Do you think that there is a linear, non-linear, or no relationship between the speed and the thinking distance? Explain your reasoning. Lesson 1: Pass the Squeeze
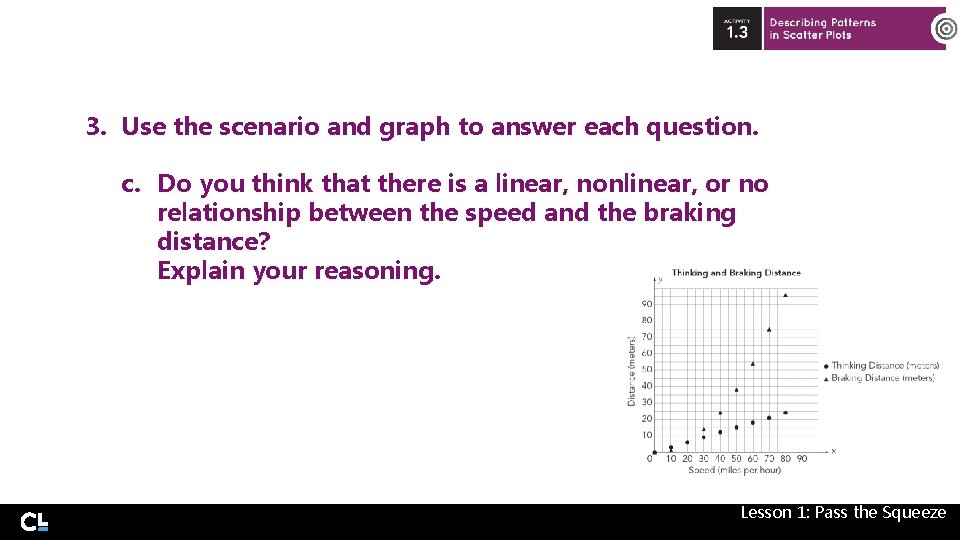
3. Use the scenario and graph to answer each question. c. Do you think that there is a linear, nonlinear, or no relationship between the speed and the braking distance? Explain your reasoning. Lesson 1: Pass the Squeeze
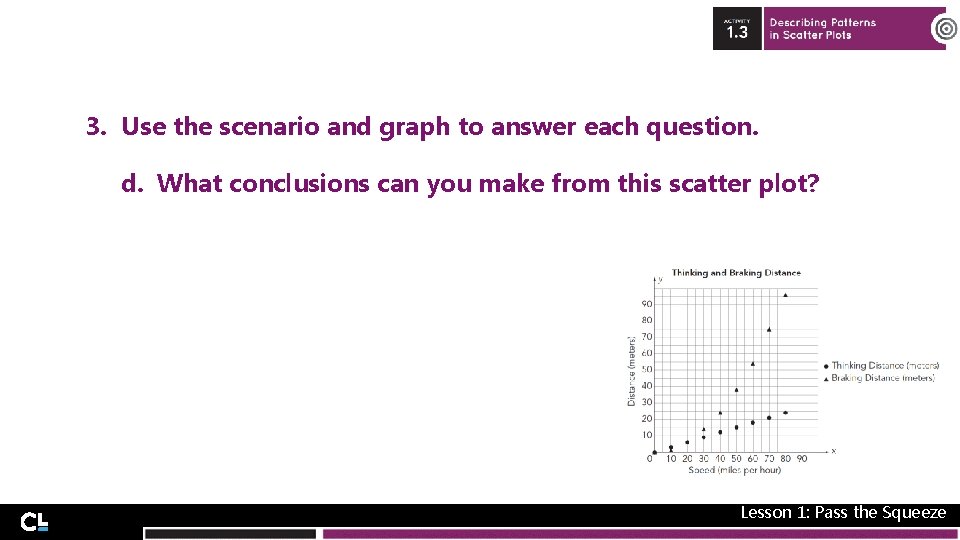
3. Use the scenario and graph to answer each question. d. What conclusions can you make from this scatter plot? Lesson 1: Pass the Squeeze
Another pattern that can occur in a scatter plot is an outlier. An outlier for bivariate data is a point that varies greatly from the overall pattern of the data. Lesson 1: Pass the Squeeze
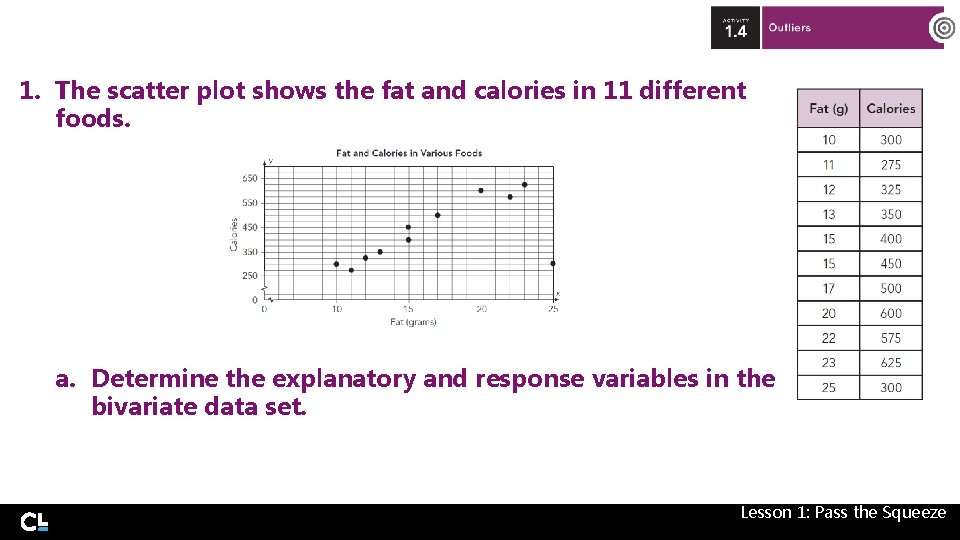
1. The scatter plot shows the fat and calories in 11 different foods. a. Determine the explanatory and response variables in the bivariate data set. Lesson 1: Pass the Squeeze
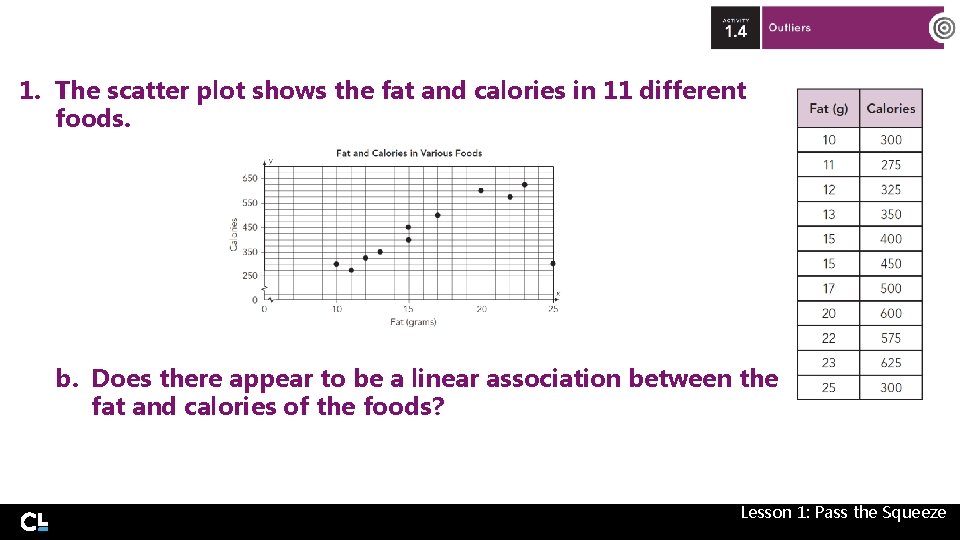
1. The scatter plot shows the fat and calories in 11 different foods. b. Does there appear to be a linear association between the fat and calories of the foods? Lesson 1: Pass the Squeeze
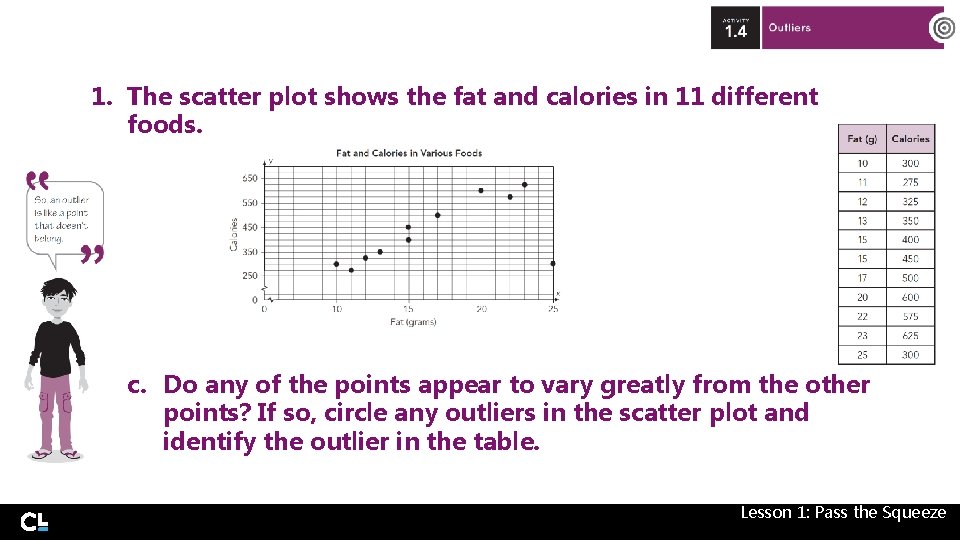
1. The scatter plot shows the fat and calories in 11 different foods. c. Do any of the points appear to vary greatly from the other points? If so, circle any outliers in the scatter plot and identify the outlier in the table. Lesson 1: Pass the Squeeze
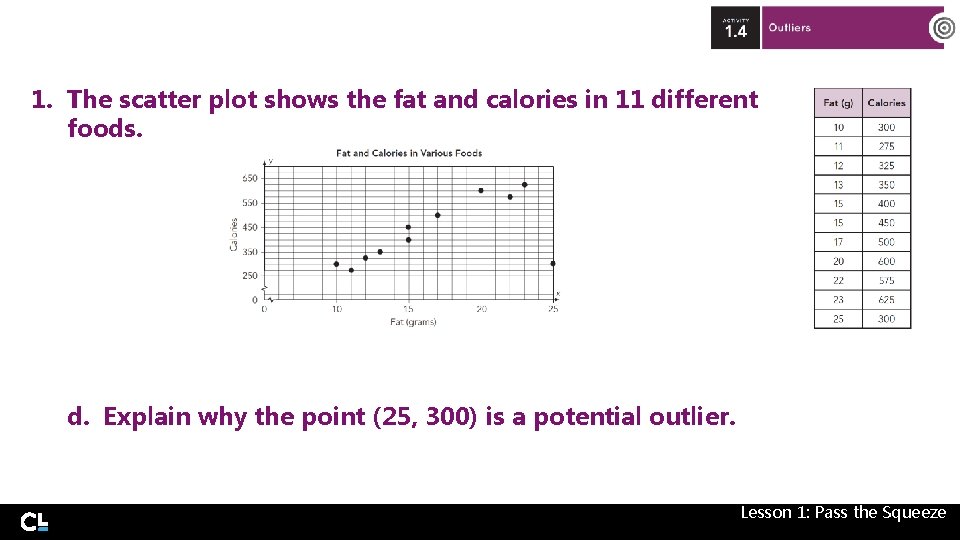
1. The scatter plot shows the fat and calories in 11 different foods. d. Explain why the point (25, 300) is a potential outlier. Lesson 1: Pass the Squeeze
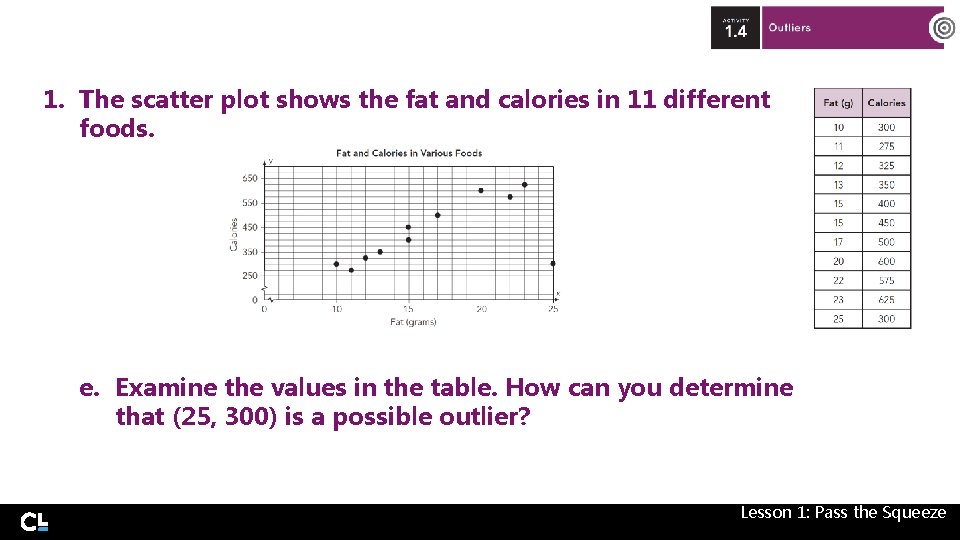
1. The scatter plot shows the fat and calories in 11 different foods. e. Examine the values in the table. How can you determine that (25, 300) is a possible outlier? Lesson 1: Pass the Squeeze
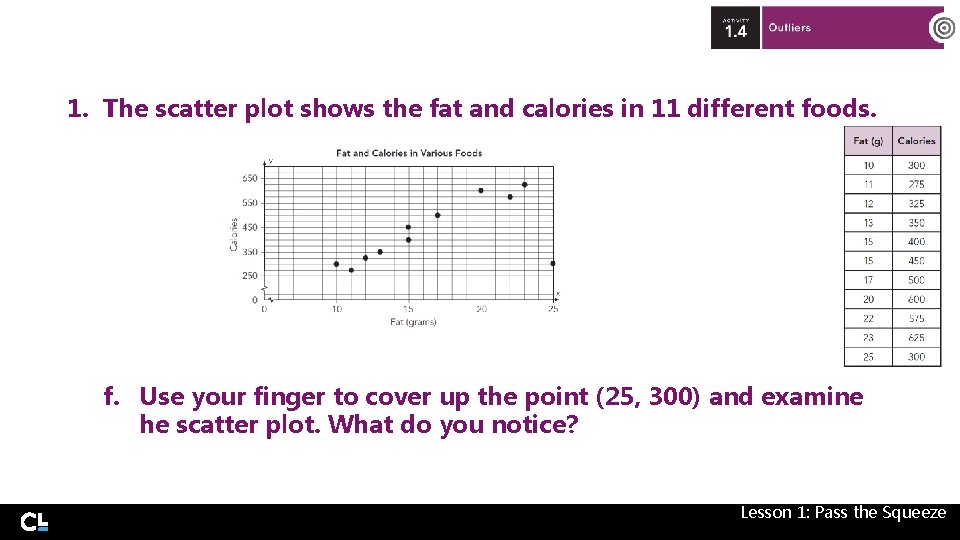
1. The scatter plot shows the fat and calories in 11 different foods. f. Use your finger to cover up the point (25, 300) and examine he scatter plot. What do you notice? Lesson 1: Pass the Squeeze
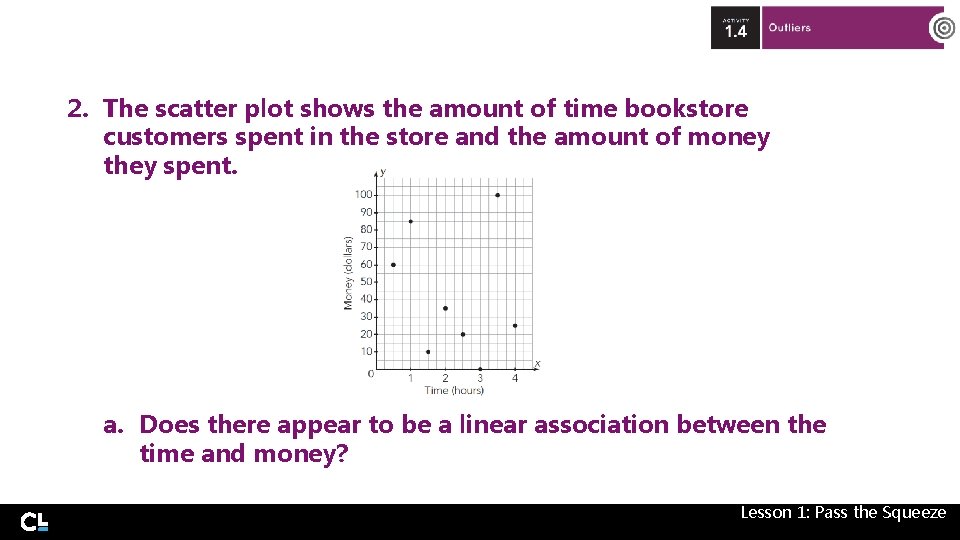
2. The scatter plot shows the amount of time bookstore customers spent in the store and the amount of money they spent. a. Does there appear to be a linear association between the time and money? Lesson 1: Pass the Squeeze
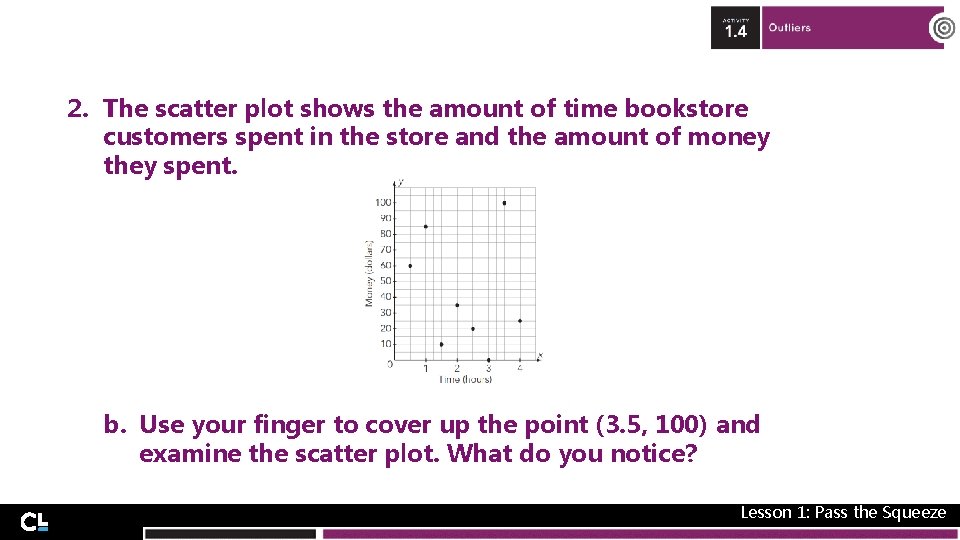
2. The scatter plot shows the amount of time bookstore customers spent in the store and the amount of money they spent. b. Use your finger to cover up the point (3. 5, 100) and examine the scatter plot. What do you notice? Lesson 1: Pass the Squeeze
1. Explain how you can determine if a scatter plot shows a linear, non-linear or no association. Lesson 1: Pass the Squeeze
2. Explain the difference between a positive association and a negative association of bivariate data. Lesson 1: Pass the Squeeze
3. Explain how you can identify an outlier in bivariate data. Do the data need to have a linear association? Lesson 1: Pass the Squeeze

- Slides: 50