Les nouveaux scnarios pour lanalyse des politiques climatiques


 Forçage radiatif en")


")


 Use of natural resource Consumption behaviors Localization choices Urbanization")


 SSP 2")

 Convergence (3 options) Energy sobriety (2 options) Availability of low C")


 7 6. 5")


")


- Slides: 58
Les nouveaux scénarios pour l’analyse des politiques climatiques Stéphane Hallegatte CIRED, Météo-France, Banque Mondiale
Des scénarios socio-économiques pour évaluer le coût du changement climatique • Les impacts du changement climatique et les coûts d’adaptation dépendent de l’intensité du changement climatique. • Mais aussi des évolutions socio-économiques: – Quelle part de la population vit dans l’extrême pauvreté? – Quelle est la part de l’agriculture vivrière dans les pays pauvres? – Quelle part de la population vit en ville? – De quelles technologies d’adaptation disposons-nous? –…
Des scénarios socio-économiques pour évaluer le coût des politiques de réduction des émissions • Les coûts des réductions d’émissions dépendent aussi des évolutions socio-économiques: – Quelle est la population mondiale? – Quelles sont les technologies disponibles? – Quels modes de consommation? – Quels développements économiques? – Quelles réserves de pétrole et de charbon? –…
Les SRES
Pourquoi de nouveaux scénarios? On a besoin: • De scénarios qui tiennent compte des nouvelles évolutions socio-économiques • De scénarios avec des baselines et des scénarios de réduction d’émission • De scénarios pertinents pour l’étude de l’adaptation et les impacts • De scénarios qui vont au delà de 2100 On construit un produit (des scénarios), mais surtout un processus pour organiser la recherche dans le domaine.
Les « Representative Concentration Pathways » ( trajectoires de concentrations représentatives) Forçage radiatif en W/m 2 11/26/2020 6
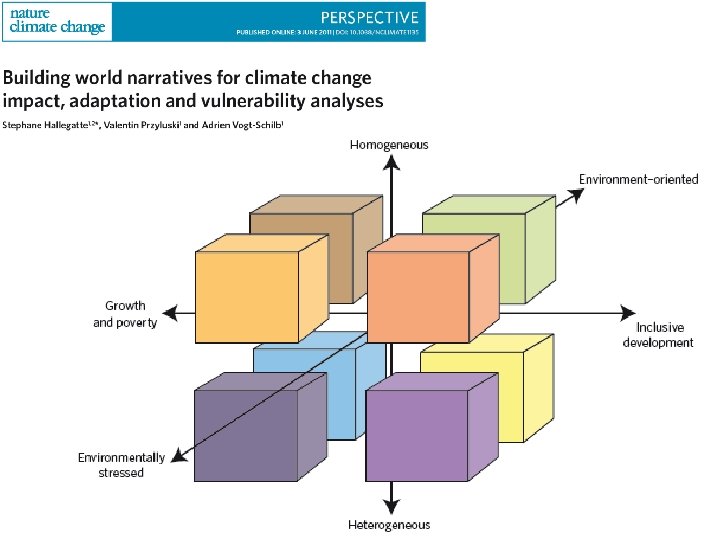
L’architecture “en matrice”
Permet de comparer les conséquences du même changement climatique dans différents scénarios socio-économiques
Permet de comparer le coût de politiques de réduction des émissions qui atteignent la même cible, dans différents scénarios socio-économiques Référence SSP 3 Référence SSP 1 Shared Policy Assumption
Les coûts de l’atténuation
Le coût de l’adaptation et les impacts résiduels
Des scénarios pour explorer l’incertitude sur les coûts d’atténuation et les impacts du CC
Couvrir les différents futurs possibles pour explorer l’incertitude
Les SSPs, d’après la réunion de Boulder (Nov 2 -4, 2011)
Couvrir les différents futurs possibles pour explorer l’incertitude
SSP 1 • Haute capacité d’adaptation, Haute capacité d’atténuation • Le monde est caractérisé par la coopération internationale, et le développement durable est une priorité • Monde fortement régulé, orienté vers l’environnement et le développement.
SSP 2 • Capacité d’adaptation moyenne, capacité d’atténuation moyenne • Un monde caractérisé par la continuation des tendances actuelles • Nombreuses vues contradictoires sur les déterminants de ce scénario • Plusieurs SSP 2? ? ?
SSP 3 • Faible capacité d’adaptation, faible capacité d’atténuation • Un monde caractérisé par la compétition entre pays, et par une croissance économique lente. • Politiques orientées vers la sécurité, barrières commerciales, peu d’efforts pour protéger l’environnement.
SSP 4 • Faible capacité d’adaptation, Haute capacité d’atténuation • Monde très inégal, à l’intérieur et entre les pays. • Une petite élite mondiale est responsable de l’essentiel des émissions de GES. • La plus grande partie de la population reste pauvre et vulnérable au changement climatique. • Governance et mondialisation sont efficaces, mais contrôlées par les élites, et à leur service.
SSP 5 • Haute capacité d’adaptation, Faible capacité d’atténuation • Développement “conventionnel”, orienté vers la croissance économique et les MDGs. • La préférence pour une croissance rapide conduit à une forte dépendance aux carburants fossiles. • La croissance permet d’atteindre des MDGs et de fournir les services nécessaires aux populations des pays en voie de développement.
A formal method to build socioeconomic scenarios Stéphane Hallegatte Avec Julie Rozenberg, Céline Guivarch, et Robert Lempert CIRED, Météo-France, RAND Corporation
SSP framework
Scenario elicitation methodology Identify drivers Model scenarios Select scenarios • Identify a priori the main drivers of future capacity to adapt and mitigate • Translate drivers into model parameters • Build a large number of model runs • Add “quantitative narratives” when necessary • Build relevant indicators • Select contrasted SSPs
Phase 1 Identify drivers Model scenarios Select scenarios • Identify a priori the main drivers of future capacity to adapt and mitigate • Translate drivers into model parameters • Build a large number of model runs • Add “quantitative narratives” when necessary • Build relevant indicators • Select contrasted SSPs
Environmental stress (environmentally-stressed vs. environmentally-friendly) Use of natural resource Consumption behaviors Localization choices Urbanization Industrial and commercial policies Economic structure Population Globalization (convergence vs. fragmented) Availability of fossil energy Carbon dependence (high vs. low dependence) Technologies Capacity to adapt Capacity to mitigate Governance efficiency Extreme poverty reduction Capital markets Labor markets Social protection Equity (inclusive growth vs. growthand-poverty)
Phase 2 Identify drivers Model scenarios Select scenarios • 4 dimensions • 13 drivers • Translate drivers into model parameters • Build a large number of model runs • Add “quantitative narratives” when necessary • Build relevant indicators • Select contrasted SSPs
Consumption behaviors Use of natural resource Availability of fossil energy Technologies Urbanizatio n Governance efficiency Industrial and commercial policies Economic structure Population Capital markets Extreme poverty reduction Social protection Labor markets
Descriptors translated into input parameters of the IMACLIM-R model Consumption behaviors Use of natural resource Availability of fossil energy Technologies Urbanizatio n Governance efficiency Industrial and commercial policies Economic structure Population Capital markets Extreme poverty reduction Social protection Labor markets
Descriptors translated into input parameters of the IMACLIM-R model Consumption behaviors Use of natural resource Availability of fossil energy Technologies Urbanizatio n Governance efficiency participatory approach This process can be done through a Industrial and commercial(see Sandrine’s presentation) Extreme poverty policies Economic structure Population Capital markets reduction Social protection Labor markets Parameter that is part of the narratives but does not appear in the model
288 scenarios with Imaclim. R
Phase 3 Identify drivers Model scenarios Select scenarios • 4 dimensions • 13 drivers • 288 scenarios • Build relevant indicators • Select contrasted SSPs
CO 2 emissions in the baseline Choosing indicators GDP per capital of the 20% poorest in a selection of developing countries
288 scenarios & 2 indicators
Definition of 5 SSP spaces with 4 thresholds
Main drivers according to the PRIM analysis SSP 1 (15% of cases) SSP 2 (10% of cases) SSP 3 (14% of cases) Equity (2 options) Convergence (3 options) Energy sobriety (2 options) Availability of low C technologies (2 options) improved Fast or medium high improved Medium or slow worsen low Availability of fossil fuels (2 options) Population (3 options) Capital markets (2 options) Medium or low 50% / 80% low 30% / 60% High or medium 55% / 90% SSP 4 (8% of cases) worsen slow high improved fast low SSP 5 (6% of cases) Coverage/ Density 90% / 85% Reduced imbalances 60% / 45%
= GDP cost to reach 550 ppm The issue of relevant indicators = share of jobs in agriculture
Equity (2 options) Convergence (3 options) Energy sobriety (2 options) Availability of low C technologies (2 options) high SSP 1 (15% of cases) Fast or medium SSP 2 (10% of cases) (14% of cases) high low Coverage/ Density Reduced imbalances 50%/80% 30%/60% low low low slow High or medium Reduced imbalances 55%/90% Constant imbalances 90%/85% High or medium SSP 4 slow Capital markets (2 options) medium Medium or slow (8% of cases) Population (3 options) Medium or low medium Medium or slow SSP 3 high Availability of fossil fuels (2 options) high SSP 5 (6% of cases) fast low low 60%/45% Reduced imbalances
Downscaling at local scale: an application on Paris Stéphane Hallegatte Avec Vincent Viguié et Julie Rozenberg CIRED et Météo-France
Modelling urban form over the very long term? The NEDUM 2 D model § Standard urban economics modelling (Alonso 1964, Mills 1967). § Three mechanisms : 1. Household tradeoff: • Lower transportation costs and shorter commuting time when living close to the city center; and • Larger dwellings and lower rent per square meter in remote areas 2. Investors optimize housing density as a function of rents and construction costs. 3. Different evolution timescales for rents, population density, buildings etc. § Simplifying hypotheses : Ø All households have the same income; Ø One trip per day towards the city center; Ø One city center. 44
VALIDATION ON 1900 -2010
Paris built area, 2006 Validation process We run the model from 1900 to 2010 using: • Data on population; • Data on average income; • Data on transportation cost, speed, and localization; • Construction costs change like income. 26 novembre 2020
Model dynamics validation on the built area, 1900 26 novembre 2020
Model dynamics validation on the built area, 1960 26 novembre 2020
Model dynamics validation on the built area, 1990 26 novembre 2020
Model dynamics validation on the built area, 2006 26 novembre 2020
Validation on local rents 51
Validation on local density 52
2010 -2100 SCENARIOS
Main hypotheses • 4 world scenarios with two dimensions: – Tensions on fossil fuel markets (resources, population, technology) – Ambitions of world climate policies. • High or low demographic scenarios for Paris urban area population
Paris urban area population : 2 scenarios Population (millions of households) 7 6. 5 6 5. 5 5 4. 5 Population low scenario 4 Population high scenario Historical data 3. 5 3 2. 5 2 1960 1980 2000 2020 2040 2060 2080 2100
Main hypotheses § 4 world scenarios with two dimensions: Ø Tensions on fossil fuel markets (resources, population, technology) Ø Ambitions of world climate policies. § High or low demographic scenarios for Paris urban area population § One simple scenarios for transport policies: Ø Infrastructure remains unchanged between 2010 and 2100 Ø Congestion on roads and public transport remains at current levels Ø Two simple options for land use planning: Ø No policy (autonomous or “potential” urbanization) Ø A green belt policy
Example of Paris urban area extension prospective scenario 26 novembre 2020
Paris built area extension – Urban sprawl Increase with high population Increase and then decrease with low population Stable with green belt Small impact of technology and fuel prices scenarios. Only local policies can control urban sprawl (e. g. , a green belt). 58
Input for mitigation policy analysis: Example: impact of a € 100/t. C carbon tax Monthly rent variation (€/m²/month) 59
Ttransport-related GHG emissions in Paris Small impact of local policies (green belt or not…) 60 Local policies cannot do much on GHG emissions (unless…)
Input for adaptation policy analysis: Adapting to high temperature and air conditioning Vulnerability to the 2003 heat wave, depending on urban forms and the use of AC. Heat stess (outdoor, shadow) in number of hours. Current Paris AC high-density scenario AC low-density scenario 1. Using AC has a negative impact on outdoor heat stress. 2. A high-density city appears more vulnerable to heat wave than a low-density city. 61
More ? On the scenario architecture: http: //www. isp. ucar. edu/socio-economic-pathways