
Lecturer 6 Financial ratio analysis Birmingham City Business
Lecturer 6: Financial ratio analysis Birmingham City Business School
Learning outcomes �Describe the benefits and purposes of the main types of financial ratios to analyse firm performance. �Define the main ratios to analyse profitability, liquidity, gearing and investment. �Calculate these ratios from given information.
Why do we use Financial Ratios? �In finance, a financial ratio is a ratio of two selected values taken from an company's financial statements. �There are many standard ratios used to evaluate the overall financial condition of a corporation. �The results of the financial ratios analysis are used to compare the current performance of the firm against 1. that of its industry competitors, 2. its own performance in past years, 3. ratios for other sections of the company. �Financial ratios may be used by managers, shareholders, investors and a firm's creditors.
Categories of Ratios �Profitability Ratios �Liquidity Ratios �Gearing Ratios �Investment Ratios
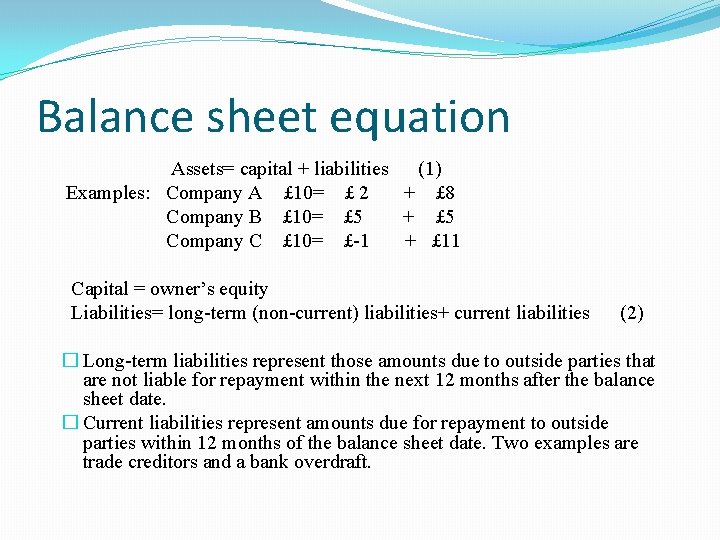
Balance sheet equation Assets= capital + liabilities (1) Examples: Company A £ 10= £ 2 + £ 8 Company B £ 10= £ 5 + £ 5 Company C £ 10= £-1 + £ 11 Capital = owner’s equity Liabilities= long-term (non-current) liabilities+ current liabilities (2) � Long-term liabilities represent those amounts due to outside parties that are not liable for repayment within the next 12 months after the balance sheet date. � Current liabilities represent amounts due for repayment to outside parties within 12 months of the balance sheet date. Two examples are trade creditors and a bank overdraft.
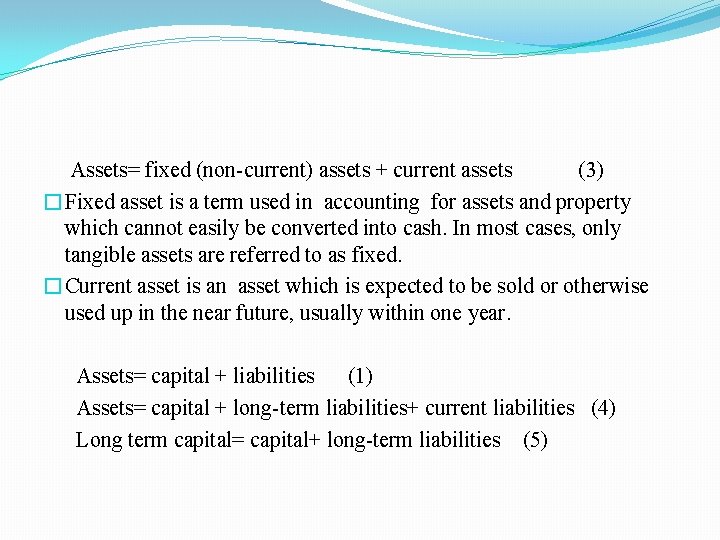
Assets= fixed (non-current) assets + current assets (3) �Fixed asset is a term used in accounting for assets and property which cannot easily be converted into cash. In most cases, only tangible assets are referred to as fixed. �Current asset is an asset which is expected to be sold or otherwise used up in the near future, usually within one year. Assets= capital + liabilities (1) Assets= capital + long-term liabilities+ current liabilities (4) Long term capital= capital+ long-term liabilities (5)
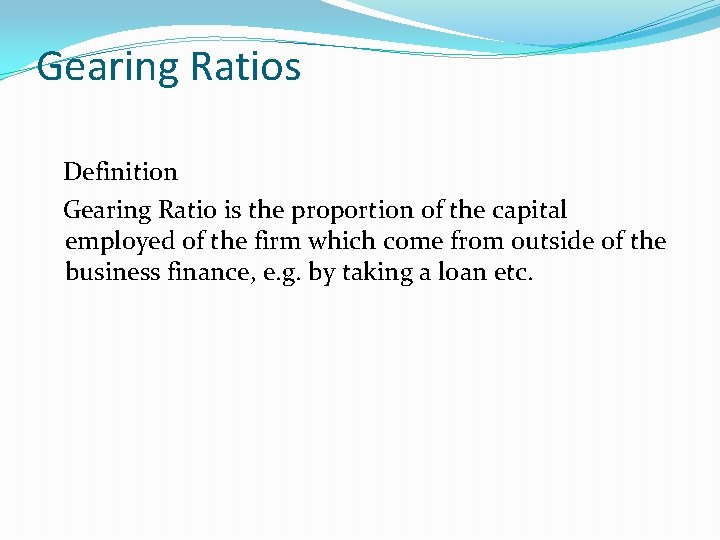
Gearing Ratios Definition Gearing Ratio is the proportion of the capital employed of the firm which come from outside of the business finance, e. g. by taking a loan etc.
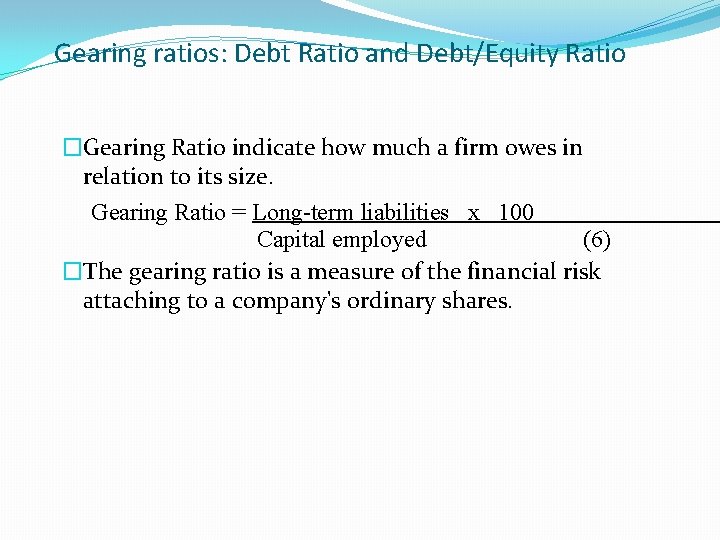
Gearing ratios: Debt Ratio and Debt/Equity Ratio �Gearing Ratio indicate how much a firm owes in relation to its size. Gearing Ratio = Long-term liabilities x 100 Capital employed (6) �The gearing ratio is a measure of the financial risk attaching to a company's ordinary shares.
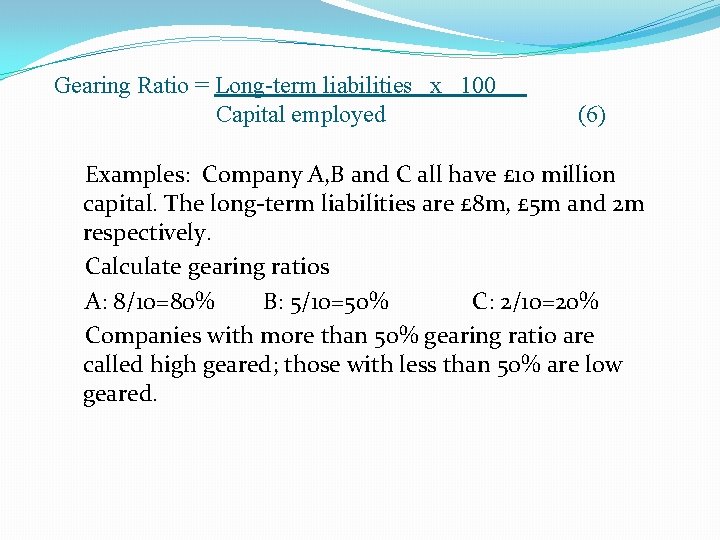
Gearing Ratio = Long-term liabilities x 100 Capital employed (6) Examples: Company A, B and C all have £ 10 million capital. The long-term liabilities are £ 8 m, £ 5 m and 2 m respectively. Calculate gearing ratios A: 8/10=80% B: 5/10=50% C: 2/10=20% Companies with more than 50% gearing ratio are called high geared; those with less than 50% are low geared.
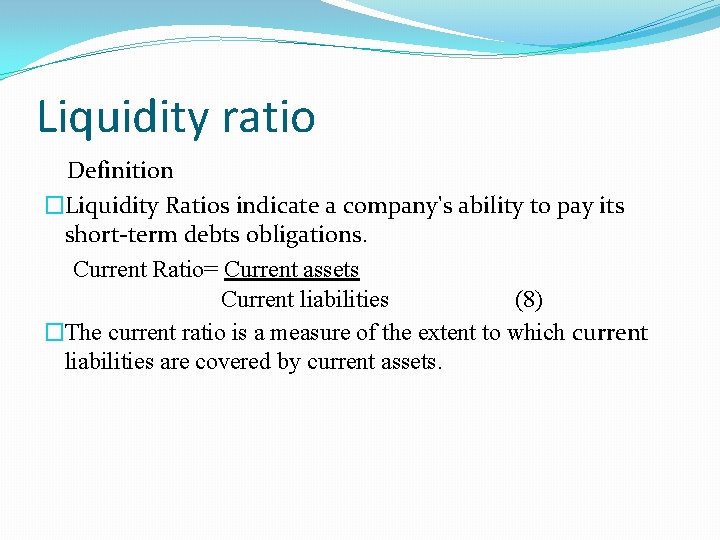
Liquidity ratio Definition �Liquidity Ratios indicate a company's ability to pay its short-term debts obligations. Current Ratio= Current assets Current liabilities (8) �The current ratio is a measure of the extent to which current liabilities are covered by current assets.
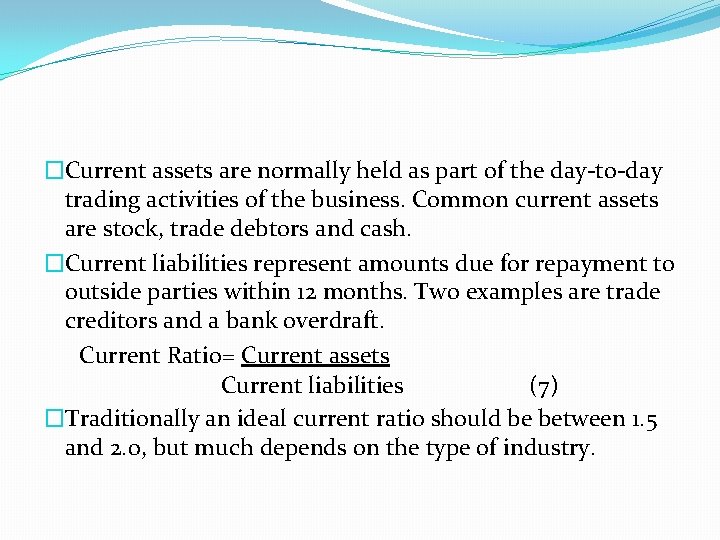
�Current assets are normally held as part of the day-to-day trading activities of the business. Common current assets are stock, trade debtors and cash. �Current liabilities represent amounts due for repayment to outside parties within 12 months. Two examples are trade creditors and a bank overdraft. Current Ratio= Current assets Current liabilities (7) �Traditionally an ideal current ratio should be between 1. 5 and 2. 0, but much depends on the type of industry.
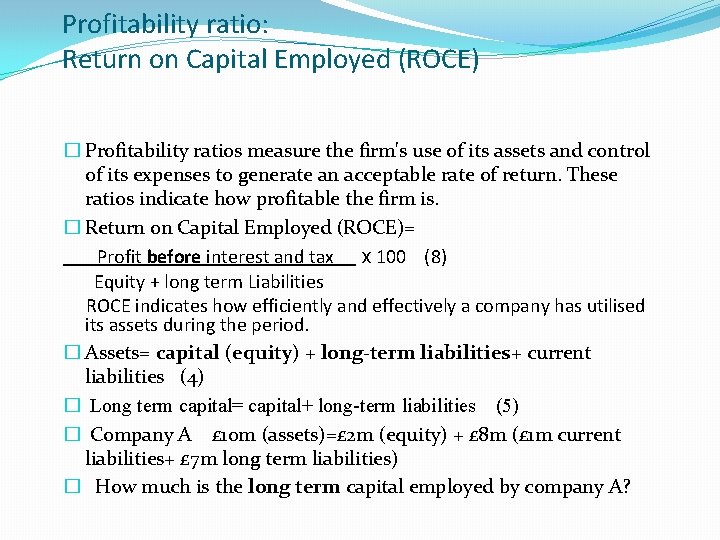
Profitability ratio: Return on Capital Employed (ROCE) � Profitability ratios measure the firm's use of its assets and control of its expenses to generate an acceptable rate of return. These ratios indicate how profitable the firm is. � Return on Capital Employed (ROCE)= Profit before interest and tax x 100 (8) Equity + long term Liabilities ROCE indicates how efficiently and effectively a company has utilised its assets during the period. � Assets= capital (equity) + long-term liabilities+ current liabilities (4) � Long term capital= capital+ long-term liabilities (5) � Company A £ 10 m (assets)=£ 2 m (equity) + £ 8 m (£ 1 m current liabilities+ £ 7 m long term liabilities) � How much is the long term capital employed by company A?
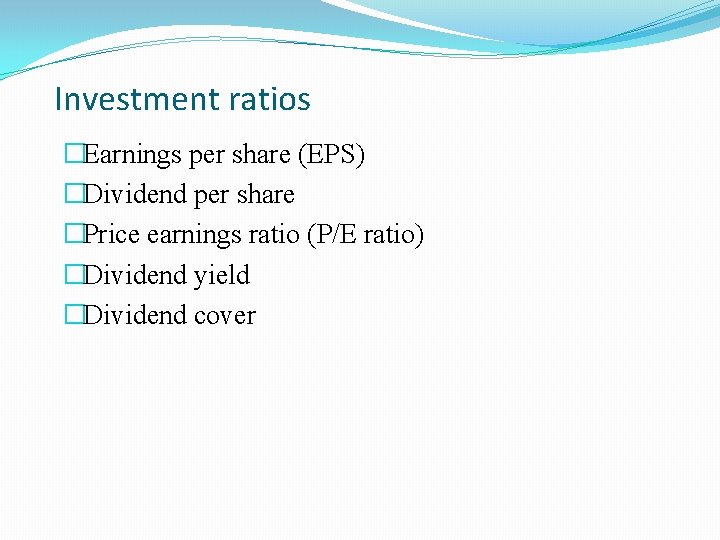
Investment ratios �Earnings per share (EPS) �Dividend per share �Price earnings ratio (P/E ratio) �Dividend yield �Dividend cover
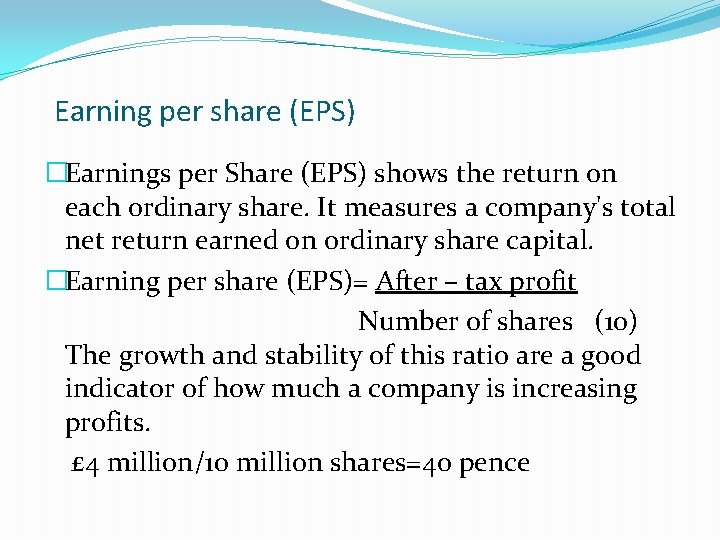
Earning per share (EPS) �Earnings per Share (EPS) shows the return on each ordinary share. It measures a company's total net return earned on ordinary share capital. �Earning per share (EPS)= After – tax profit Number of shares (10) The growth and stability of this ratio are a good indicator of how much a company is increasing profits. £ 4 million/10 million shares=4 o pence
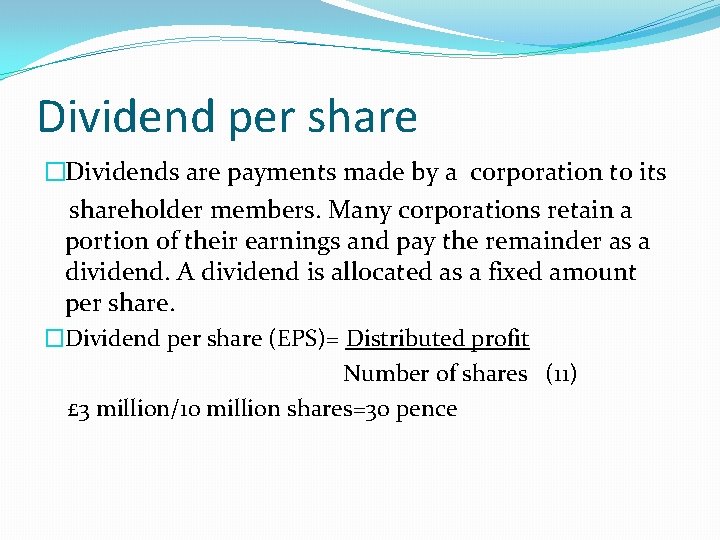
Dividend per share �Dividends are payments made by a corporation to its shareholder members. Many corporations retain a portion of their earnings and pay the remainder as a dividend. A dividend is allocated as a fixed amount per share. �Dividend per share (EPS)= Distributed profit Number of shares (11) £ 3 million/10 million shares=3 o pence
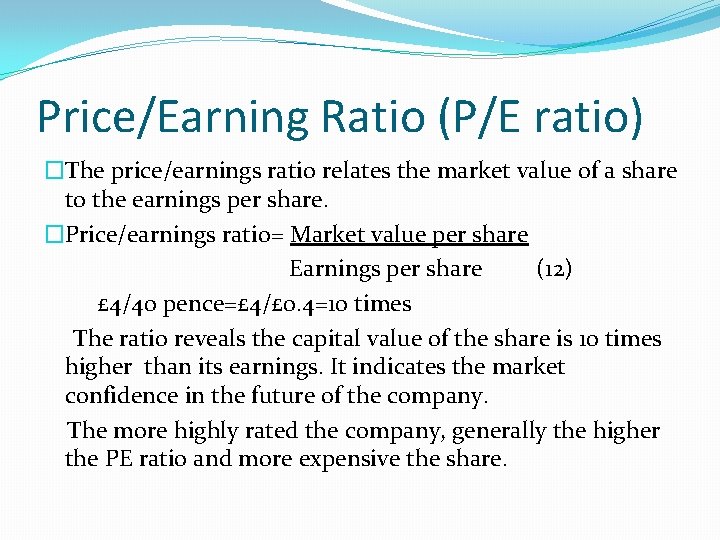
Price/Earning Ratio (P/E ratio) �The price/earnings ratio relates the market value of a share to the earnings per share. �Price/earnings ratio= Market value per share Earnings per share (12) £ 4/40 pence=£ 4/£ 0. 4=10 times The ratio reveals the capital value of the share is 10 times higher than its earnings. It indicates the market confidence in the future of the company. The more highly rated the company, generally the higher the PE ratio and more expensive the share.
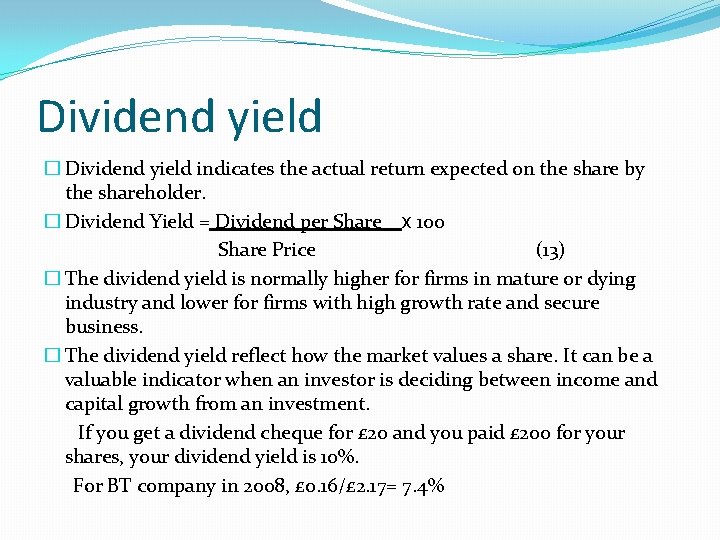
Dividend yield � Dividend yield indicates the actual return expected on the share by the shareholder. � Dividend Yield = Dividend per Share x 100 Share Price (13) � The dividend yield is normally higher for firms in mature or dying industry and lower for firms with high growth rate and secure business. � The dividend yield reflect how the market values a share. It can be a valuable indicator when an investor is deciding between income and capital growth from an investment. If you get a dividend cheque for £ 20 and you paid £ 200 for your shares, your dividend yield is 10%. For BT company in 2008, £ 0. 16/£ 2. 17= 7. 4%
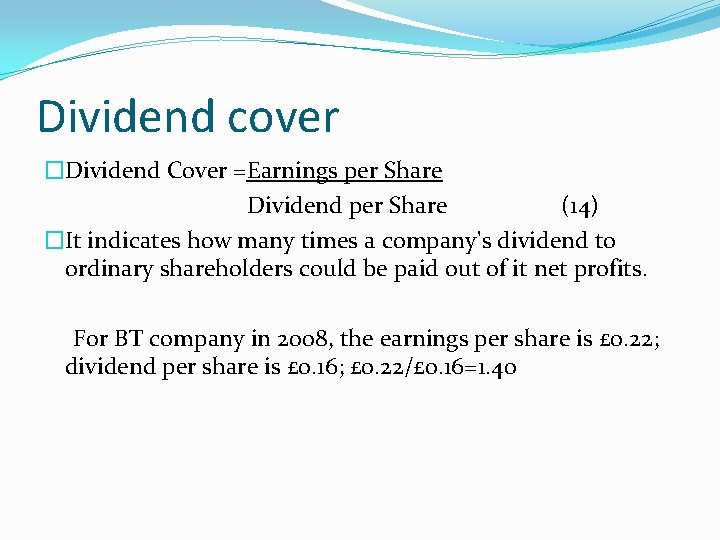
Dividend cover �Dividend Cover =Earnings per Share Dividend per Share (14) �It indicates how many times a company's dividend to ordinary shareholders could be paid out of it net profits. For BT company in 2008, the earnings per share is £ 0. 22; dividend per share is £ 0. 16; £ 0. 22/£ 0. 16=1. 40
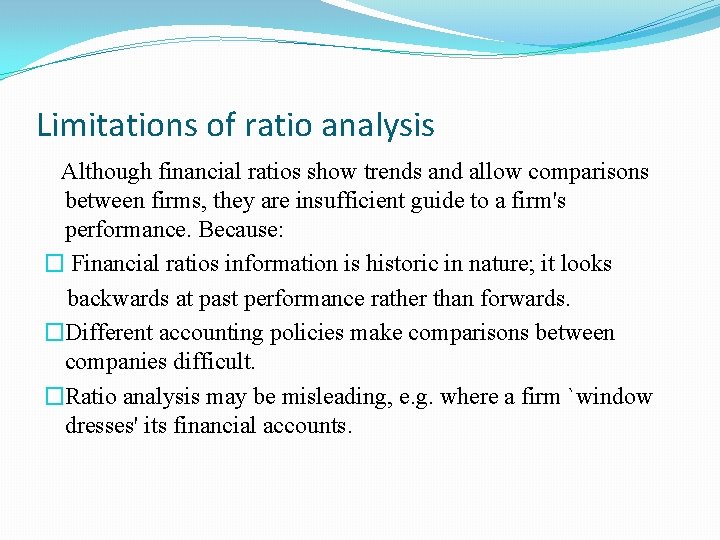
Limitations of ratio analysis Although financial ratios show trends and allow comparisons between firms, they are insufficient guide to a firm's performance. Because: � Financial ratios information is historic in nature; it looks backwards at past performance rather than forwards. �Different accounting policies make comparisons between companies difficult. �Ratio analysis may be misleading, e. g. where a firm `window dresses' its financial accounts.
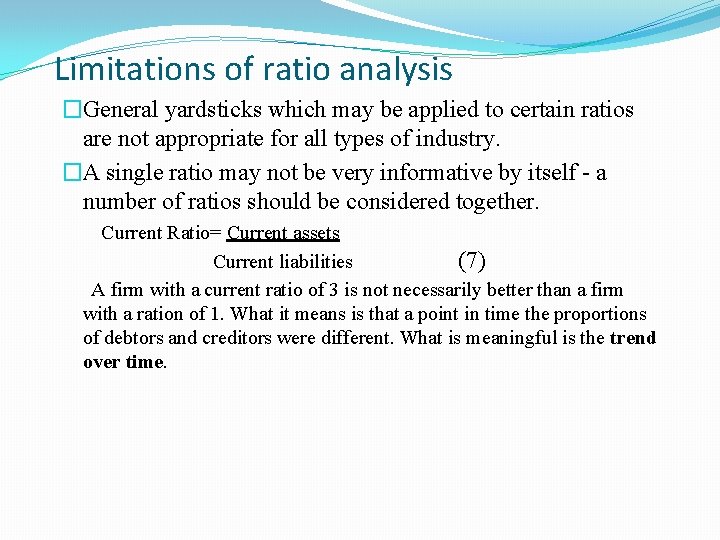
Limitations of ratio analysis �General yardsticks which may be applied to certain ratios are not appropriate for all types of industry. �A single ratio may not be very informative by itself - a number of ratios should be considered together. Current Ratio= Current assets Current liabilities (7) A firm with a current ratio of 3 is not necessarily better than a firm with a ration of 1. What it means is that a point in time the proportions of debtors and creditors were different. What is meaningful is the trend over time.
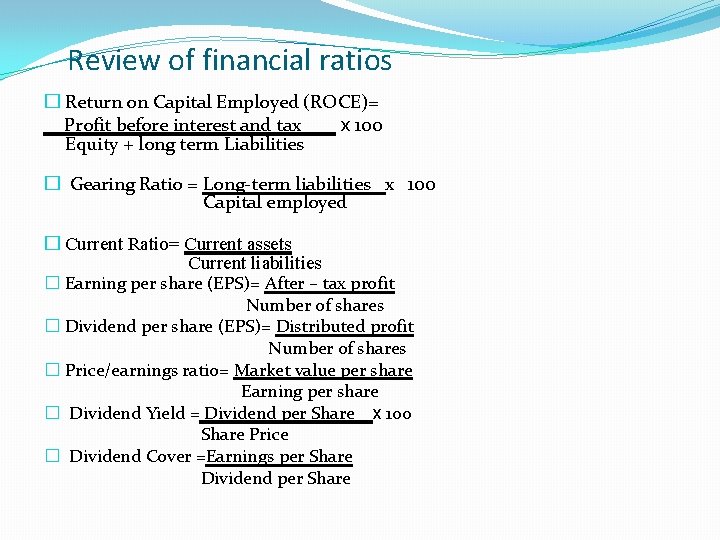
Review of financial ratios � Return on Capital Employed (ROCE)= Profit before interest and tax x 100 Equity + long term Liabilities � Gearing Ratio = Long-term liabilities x 100 Capital employed � Current Ratio= Current assets Current liabilities � Earning per share (EPS)= After – tax profit Number of shares � Dividend per share (EPS)= Distributed profit Number of shares � Price/earnings ratio= Market value per share Earning per share � Dividend Yield = Dividend per Share x 100 Share Price � Dividend Cover =Earnings per Share Dividend per Share
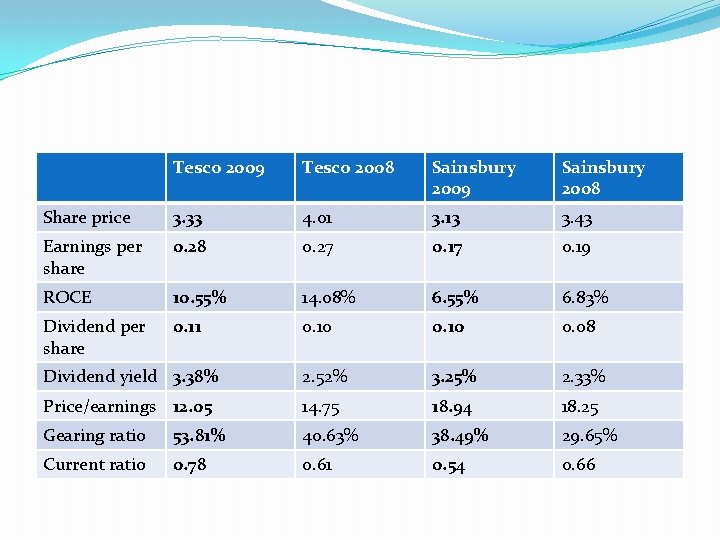
Tesco 2009 Tesco 2008 Sainsbury 2009 Sainsbury 2008 Share price 3. 33 4. 01 3. 13 3. 43 Earnings per share 0. 28 0. 27 0. 19 ROCE 10. 55% 14. 08% 6. 55% 6. 83% Dividend per share 0. 11 0. 10 0. 08 Dividend yield 3. 38% 2. 52% 3. 25% 2. 33% Price/earnings 12. 05 14. 75 18. 94 18. 25 Gearing ratio 53. 81% 40. 63% 38. 49% 29. 65% Current ratio 0. 78 0. 61 0. 54 0. 66
Bibliography Atrill P. Mclaney E. (2010) Accounting and Finance for Non-specialists. 7 th ed. Prentice Hall. Atrill, P. and Mc. Laney, E. (2002 ) Financial Accounting for Non-specialists. 3 rd ed. Prentice Hall. Black, G. (2009 ) Introduction to Accounting and Finance. 2 nd ed. Prentice Hall.
- Slides: 24