LECTURE 9 DEVELOP SCHEDULE Develop Schedule is the


 to shorten task")


-amount of time that a task can be delayed without causing a")


, its")


- Slides: 66
LECTURE 9 DEVELOP SCHEDULE
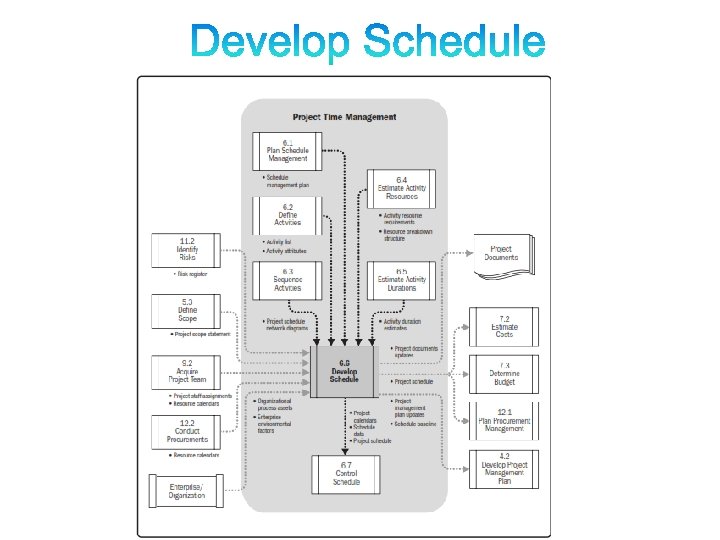
• Develop Schedule is the Process of analyzing activity sequences, durations, resource requirements, and schedule constraints to create the project schedule model. • The key benefit of this process is that by entering schedule activities, durations, resource availabilities, and logical relationships into the scheduling tool, it generates a schedule model with planned dates for completing project activities. .
Develop Schedule PROCESS OF ANALYZING ACTIVITY SEQUENCES, DURATIONS, RESOURCE REQUIREMENTS, AND SCHEDULE CONSTRAINTS TO CREATE THE PROJECT SCHEDULE MODEL. 1 2 Inputs Tools and Techniques 1. Schedule Management Plan 2. Activity List 3. Activity Attributes 4. Project Schedule Network Diagrams 5. Activity Resource Requirements 6. Resource Calendars 7. Activity Duration Estimates 8. Project Scope Statement 9. Risk Register 10. Project Staff assignments 11. Resource Breakdown Structure 1. Schedule Network Analysis 2. Critical Path Method 3. Critical Chain Method 4. Resource Optimization Techniques 5. Modeling Techniques 6. Leads and Lags 7. Schedule Compression 8. Scheduling Tools 3 Outputs 1. Schedule Baseline 2. Project Schedule 3. Schedule Data 4. Project Calendars 5. Project Management Plan updates 6. Project Documents Updates ______
INPUTS § § § § Schedule Management Plan Activity List Activity Attributes Project Schedule Network Diagrams Activity Resource Requirements Resource Calendars Activity Duration Estimates Project Scope Statement Risk Register Project Staff Assignments Resource Breakdown Structure Enterprise Environmental Factors Organizational Process Assets
INPUTS 6. 6. 1. 1 Schedule Management Plan
INPUTS 6. 6. 1. 2 Activity List
INPUTS 6. 6. 1. 3 Activity Attributes
INPUTS 6. 6. 1. 4 Project Schedule Network Diagrams
INPUTS 6. 6. 1. 5 Activity Resource Requirements
INPUTS 6. 6. 1. 6 Resource Calendars
INPUTS 6. 6. 1. 7 Activity Duration Estimates
INPUTS 6. 6. 1. 8 Project Scope Statement
INPUTS 6. 6. 1. 9 Risk Register
INPUTS 6. 6. 1. 10 Project Staff Assignments
INPUTS 6. 6. 1. 11 Resource Breakdown Structure
INPUTS 6. 6. 1. 12 Enterprise Environmental Factors
INPUTS 6. 6. 1. 13 Organizational Process Assets
TOOLS & TECHNIQUES • • Schedule Network Analysis Critical Path Method Critical Chain Method Resource Optimization Techniques Modeling Techniques Leads and Lags Schedule Compression Scheduling Tools
TOOLS & TECHNIQUES 6. 6. 2. 1 Schedule Network Analysis
Schedule Network Analysis • A technique used by project managers to analyze schedule information and generate realistic and optimal project schedules. • This analysis should be performed upon completion of the draft schedule and network diagram and after each schedule update. • It involves: • Identifying the schedule impact of task dependencies • Identifying critical path tasks and understanding the impact of the critical path on the schedule. • Analyzing the effects of schedule constraints and externally imposed dates • Understanding which tasks can experience delays without delaying the overall schedule • Conducting “what if” analysis of various activity durations (for example, what if the testing activities take twice as long as is currently planned? ) • Assessing resource allocation and leveling to prevent resource overallocation • Assessing fast tracking or crashing options
TOOLS & TECHNIQUES 6. 6. 2. 4 Resource Optimization Techniques
Resource Leveling Resource leveling is the process of changing schedule resource allocation to resolve over-allocations or conflicts. Resource leveling is applied to a schedule that has already been analyzed by the critical path method. This technique is used to adjust a project schedule if shared resources are only available at certain times, or in limited quantities, or if a Project Manager wants to maintain resource usage at a constant level. Resource leveling is often used to correct resource over-allocations and will often change the critical path. The network diagram should be recreated after resource leveling to assess the updated critical path.
TOOLS & TECHNIQUES 6. 6. 2. 4 Resource Optimization Techniques
TOOLS & TECHNIQUES 6. 6. 2. 4 Resource Optimization Techniques
TOOLS & TECHNIQUES 6. 6. 2. 6 Leads and Lags
Schedule Compression Techniques As a result of network diagram analysis, project teams may identify a need to compress the schedule. Schedule compression shortens the project schedule in order to meet schedule deadlines without reducing the project scope. Schedule compression techniques include crashing and fast tracking. If utilized, project teams should recreate and reassess the network diagram to ensure that no new schedule issues have emerged.
TOOLS & TECHNIQUES 6. 6. 2. 7 Schedule Compression
Crashing involves either adding resources or increasing work hours (overtime, weekends) to shorten task duration. Shorter task durations typically result in higher task costs, so project teams must determine, prior to crashing, whether the total costs savings is enough to justify the higher costs. Crashing almost always requires cost increases because it usually necessitates new tasks. Crashing is a controversial technique because adding project resources can increase project complexity or risk and may ultimately have a negative impact on the schedule. Crashing does not involve reducing project scope or eliminating project tasks.
Fast Tracking Fast tracking is a schedule compression technique in which project phases or activities usually conducted sequentially are performed in parallel to reduce duration. Care must be taken to ensure that parallel work does not create additional work or increase risk. Fast tracking frequently results in increased complexities in task dependencies, so additional project controls must be implemented to ensure ongoing and accurate insight into schedule performance
TOOLS & TECHNIQUES 6. 6. 2. 5 Modeling Techniques
What-If Scenario Analysis This analysis examines the schedule impact of various scenarios, such as the delayed delivery of a major deliverable. What-if scenario analysis may include simulation that calculates multiple project durations with different sets of activity assumptions. Multiple network diagrams may be generated to visually convey the impact of varying scenarios. Project managers can use the results of this analysis to determine schedule feasibility under adverse conditions and prepare relevant contingency plans
TOOLS & TECHNIQUES Critical Path Method
TOOLS & TECHNIQUES Critical Path Method
History • Developed in the 1950 s by the US Navy • Originally, the critical path method considered only logical dependencies between terminal elements • Since then, it has been expanded to allow for the inclusion of resources related to each activity, through processes called activitybased resource assignments and resource leveling.
CPM • The Critical Path Method or Critical Path Analysis, is a mathematically based algorithm for scheduling a set of project activities • It is an important tool for effective project management • Commonly used with all forms of projects, including construction, software development, research projects, product development, engineering, and plant maintenance, among others • Any project with interdependent activities can apply this method of scheduling
CPM • The longest path of planned activities to the end of the project • The earliest and latest that each activity can start and finish without making the project longer • Determines “critical” activities (on the longest path) Prioritize activities for the effective management and to • shorten the planned critical path of a project by: • Pruning critical path activities • “Fast tracking" (performing more activities in parallel) • “Crashing the critical path" (shortening the durations of critical path activities by adding resources)
Basic Rules for Constructing the Network Diagram • Networks typically flow from left to right. • An activity cannot begin until all of its preceding activities are complete. • Arrows indicate precedence and flow and can cross over each other. • Identify each activity with a unique number. • Looping is not allowed. • Conditional statements are not allowed • Use unique start and stop nodes.
Definitions • Float(slack)-amount of time that a task can be delayed without causing a delay to: – subsequent tasks (free float) – project completion date (total float) • Critical path is the sequence of activities which add up to the longest overall duration. It is the shortest time possible to complete the project. Any delay of an activity on the critical path directly impacts the planned project completion date (there is no float on the critical path). A project can have several, parallel, near critical paths. An additional parallel path through the network with the total durations shorter than the critical path is called a sub-critical or non-critical path. • Critical activity–activity with zero float • Resource leveling – iterative process of assigning crews to activities in order to calculate their duration
Activity Duration Dependency A 7 B 3 C 6 A D 3 B E 3 D, F F 2 B G 3 C H 2 E, G
TOOLS & TECHNIQUES 6. 6. 2. 2 Critical Path Method
• We identify the tasks in the Project and specify the resources needed for each one • We allocate to each task sufficient time that we are confident will allow it to be completed with those resources. That is, the time the task should take on average, plus some contingency to give us the confidence we seek • We apply task dependencies, and work out the longest path of tasks in the Project • The time along this path is the Critical of the Project
• As long as every task completes on time (within its contingency), its successors will be started on time • As soon as any task finishes late (outside its contingency), its successors will start late, and this normally means they will finish late • In order to rescue a Project which shows any lateness, we have to squeeze the remaining tasks in the Project • Typically we have to compromise on time, cost or scope and reschedule
• If we allow more time for every task in the plan, each task is less likely to be late, but the Project end date will be later. . . • If we allow less time, the end date will be earlier, but the Project is more likely to overrun • BUT I have to deliver the Project on time
• The dependencies of the activities play an important role in making a project faster or slower and meeting the deadline of the project. You don’t have to be working on the less critical activities when you have most critical ones delaying and pending. • Even the larger projects could be easily handled with the help of critical path method. You don’t have to look at a jumbled and cluttered network; instead, when you have a chart in front of you that is organized, you can make sense of everything and work more efficiently on all the activities. • Working with the floats is another great benefit that critical path method gives to the project manager. When you know that delay in a certain activity wouldn’t affect your project much, you could actually take advantage of this flexibility and work on other critical activities in the meantime.
• The first and the main disadvantage of the technique is its application on more complex and bigger tasks. When you have bigger tasks involving large number of activities, you end up with a big chart which looks more incomprehensible than comprehensible. • Secondly, critical path model is an optimistic model which assumes that all resources will be available at all times and can be utilized whenever they are needed. However, practically this was not always possible. Many times this assumption led to delay in projects and more spending. • In the critical path method, even if an activity is completed before its planned completion date, the time gain cannot be utilized by the next activity, because the next activity has to wait until its early start date. Usually this happens because the resource allocated to the next activity may not be available at the moment. However, the opposite is not true. If any previous activity is delayed, this delay will be passed to the next activity and this may cause delay in the project. In the critical path method, delays accumulate but gain does not • The critical path method is also infected with Student Syndrome, where team members do not start the task until the last moment.
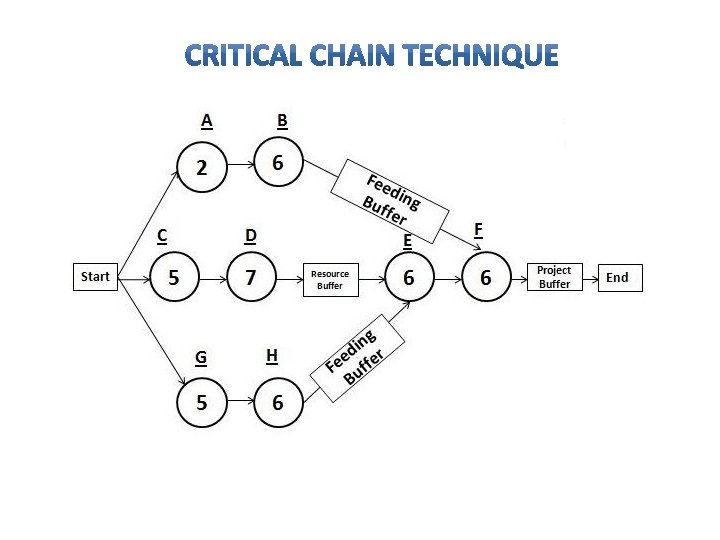
• Critical chain method is a modified form of the critical path method. Here, availability of resources is considered while creating the project schedule. • In critical chain project management, instead of float, buffers are used. These buffers are designed in such a way that they completely eliminate the concept of float or slack. •
• Remove all contingencies from activities, regardless of whether you have added the calculated contingencies or any percentage of it. If you’ve used • Align the activities with late finish dates and remove resource constraints. Give priority to critical chain activities while assigning resources. • Add feeding buffers to non-critical chains so that their durations become equal to the critical chain. Add project buffer to end of the critical chain, but before the project end date. The project buffer should be approximately half the contingency you removed from the activities. This helps improve the efficiency, and reduces the schedule duration.
• The project based on the critical chain method completes 10% to 30% faster than that based on the critical path method • It is a more practical approach • It encourages team members to perform efficiently • It improves the productivity
TOOLS & TECHNIQUES Critical Chain Method
TOOLS & TECHNIQUES Critical Chain Method
TOOLS & TECHNIQUES Critical Chain Method
TOOLS & TECHNIQUES Schedule Compression • • Crashing. Schedule compression technique in which cost and schedule tradeoffs are analyzed to determine how to obtain the greatest amount of compression for the least incremental cost. Crashing does not always produce a viable alternative and can result in increased cost. Fast tracking. A schedule compression technique in which phases or activities that normally would be done in sequence are performed in parallel. An example would be to construct the foundation for a building before all the architectural drawings are complete. Fast tracking can result in rework and increased risk. This approach can require work to be performed without completed detailed information, such as engineering drawings. It results in trading cost for time, and increases the risk of achieving the shortened project schedule.
TOOLS & TECHNIQUES Scheduling Tools
OUTPUTS Schedule Baseline Project Schedule Data Project Calendars Project Management Plan Updates Project Documents Updates
OUTPUTS 6. 6. 3. 1 Schedule Baseline
OUTPUTS 6. 6. 3. 2 Project Schedule
OUTPUTS 6. 6. 3. 2 Project Schedule
OUTPUTS 6. 6. 3. 2 Project Schedule • • • Bar charts. These charts, with bars representing activities, show activity start and end dates, as well as expected durations. Milestone charts. These charts are similar to bar charts, but only identify the scheduled start or completion of major deliverables and key external interfaces. Project schedule network diagrams. These diagrams, with activity date information, usually show both the project network logic and the project’s critical path schedule activities.
OUTPUTS 6. 6. 3. 2 Project Schedule Reference: Figure 6. 21. PMBOK® Guide, 5 th Ed
OUTPUTS 6. 6. 3. 3 Schedule Data
OUTPUTS 6. 6. 3. 3 Schedule Data Supporting data for the project schedule includes at least the schedule milestones, schedule activities, activity attributes and documentation of all identified assumptions and constraints. The amount of additional data varies by application area. Information frequently supplied as supporting detail includes, but is not limited to: • • Resource requirements by time period, often in the form of a resource histogram Alternative schedules, such as best-case or worst-case, not resource leveled, with or without imposed dates Schedule contingency reserves.
OUTPUTS 6. 6. 3. 4 Project Calendars
OUTPUTS 6. 6. 3. 5 Project Management Plan Updates
OUTPUTS 6. 6. 3. 6 Project Documents Updates