Lecture 6 WHAT WE ARE GOING TO COVER


 is not equal")


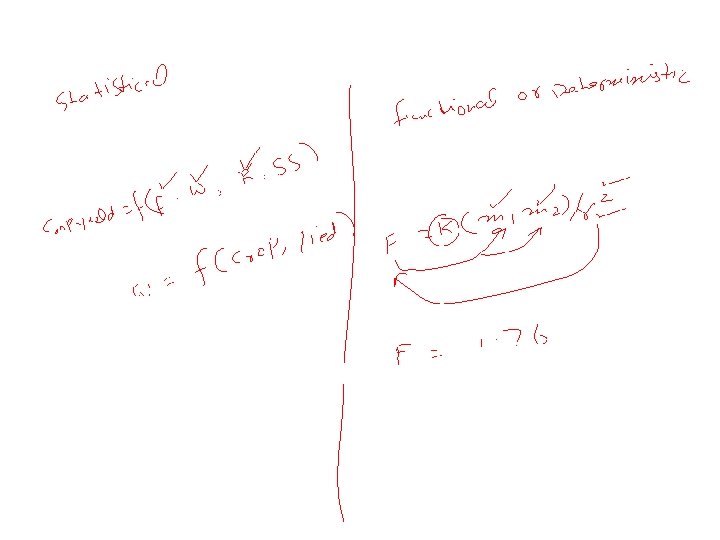


 E(Y/Xi)=f(Xi)--------------------A The above equation is called conditional expectation function(CEF) or Population")


- Slides: 20
Lecture 6 WHAT WE ARE GOING TO COVER TODAY Ø Correlation Ø Causation Ø Regression
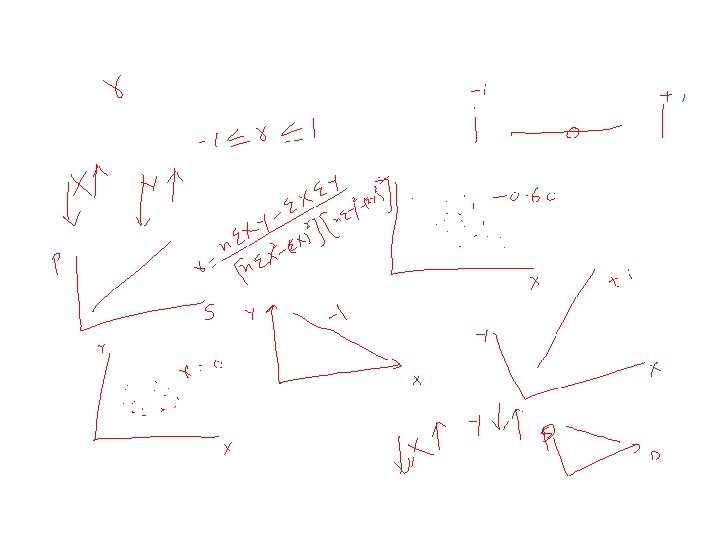
Correlation •
Causation versus correlating Causation 1. Cause and effect 2. Asymmetric Y=f(x) is not equal to x=f(y) 3 - Causation is necessarily correlation Correlation •
Notation Dependent variable Independent variable Explained variable Explanatory variable Predictand Predictor Regressand Regressor Response Stimulus Endogenous Exogenous Outcome Covariate Controlled variable Control variable LHS RHS
Regression • History- Francis Galton • Tall parents-----tall children • However average height of children less than parents • Short parents……. . Short children • However average height of children was greater than parents. The average height of children tend to move or regress the average height of population as a whole. Galton law of universal Regression Karl Pearson verified it by collecting data from 1000 people and called it regression to mediocrity
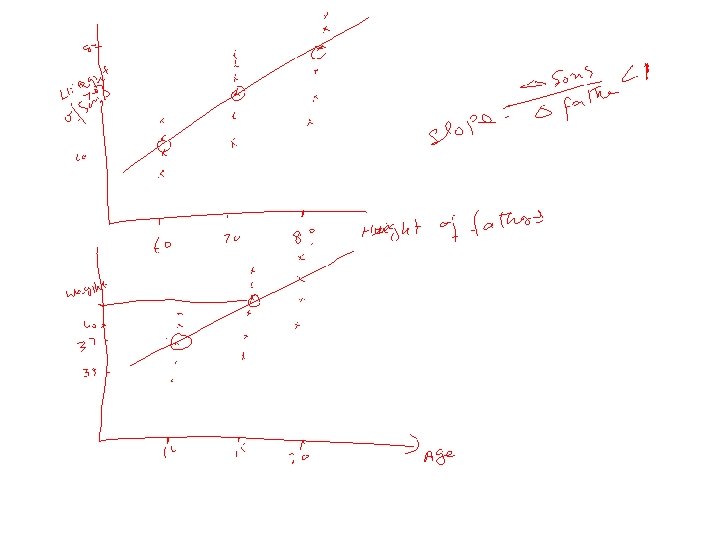
Modern concept Regression analysis concerned with the study of dependence of one variable (dependent variable) on one or more variables (explanatory variables) with a view to estimate or predict the average/mean value of the DV in term of the given/fixed value of the known EV variable. • Example 1 - sons height and fathers height • Example 2 - height at different age level • Note that this line has a positive slope but the slope is less than 1, which is in conformity with Galton’s regression to mediocrity.
Statistical Versus Deterministic Relationship Regression concerns with statistical relationship not functional or deterministic dependence of variables as in physics. • Example 1: Dependency of crop yield • Y= f ( temp, sunshine, rainfall, fertilizers, ………. ) • Measurement of error, many other variable, prediction is not 100% correct • Newton's law of gravity • F becomes random if the measurement error arises in k.
Statistical versus deterministic Relationship Statistical Ø Concerned with dependency Functional or Deterministic variable Ø Concerned with variable dependency Ø Variables are random Ø Variables are non random Ø Statistical dependency Ø Deterministic or functional dependency Ø Can not be predicted with accuracy Ø Can be predicted accurately Ø Example: Crop yield Ø Example: Newton's law
Regression versus causation • Although the regression analysis deal with dependency of one variable on other variables • It does not necessarily imply causation. • A statistical relationship, however strong can never establish causal connection. • There is no statistical reason to assume that rainfall does not depend on crop yield. • Our idea of causation must come from outside statistics ultimately from some theory or other information. • Key Point: a statistical relationship in itself cannot logically imply causation.
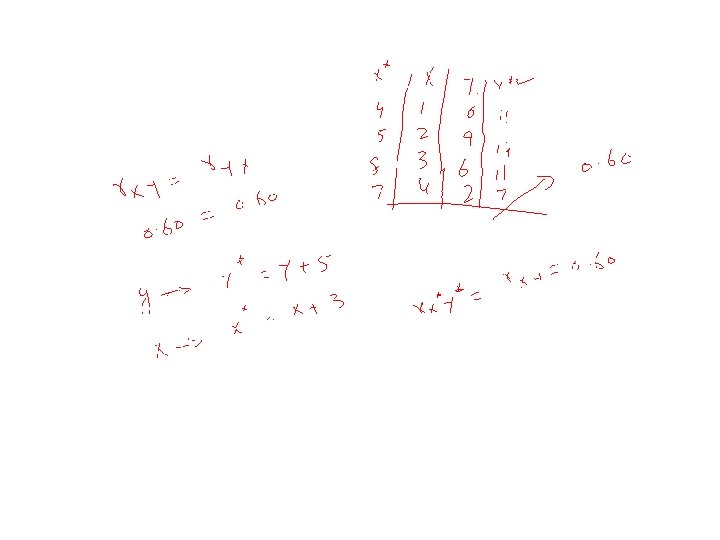
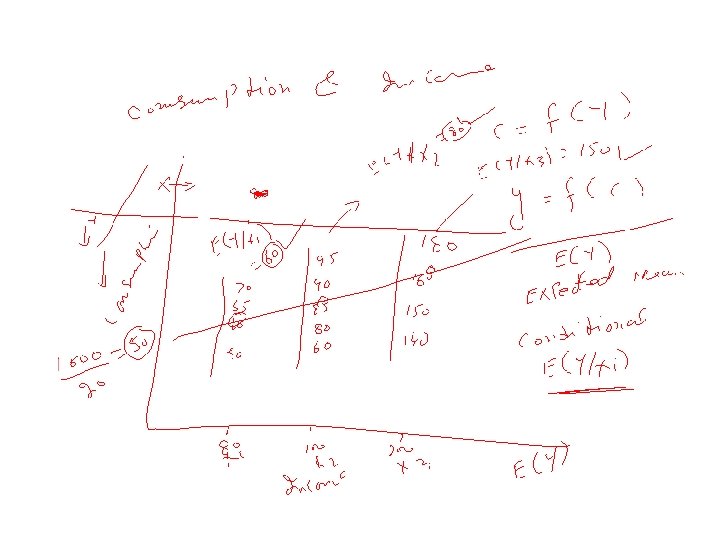
Simple or Bivariate Regression • Regression analysis is largely concerned with estimating and/or predicting the (population) mean value of the dependent variable on the basis of the known or fixed values of the explanatory variable(s). • Example: EXPENDITURE-INCOME • Conditional Mean: E(Y/X) • Unconditional Mean: E(Y) • The population regression line is simply the locus of the conditional mean of the dependent variable for the fixed values of the explanatory variable.
Population Regression Function(PRF) E(Y/Xi)=f(Xi)--------------------A The above equation is called conditional expectation function(CEF) or Population Regression Function PRF. What form the f(Xi) assume- important question E(Y/Xi)= B 1+B 2 Xi --------(B) B 1 and B 2 are unknown but fixed parameters known as regression coefficients. B 1 and B 2 also known as intercept and slope coefficients. Other names are Regression, Regression equation, Regression model used synonymously. The purpose of the regression is to estimate the values of the parameters i. e. unknown parameters B 1 and B 2
Summary • Correlation and causation • Regression and causation
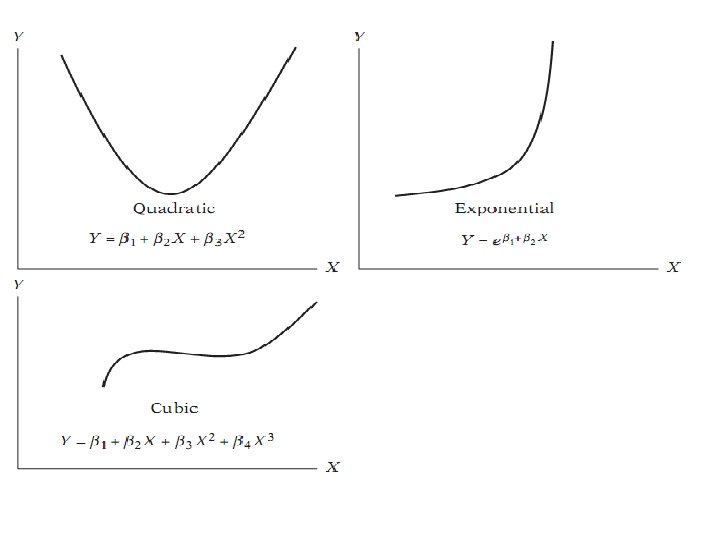
Linearity •