
Lecture 5 Maximum Likelihood and model selection Joe










- Slides: 41
Lecture 5 Maximum Likelihood and model selection Joe Felsenstein
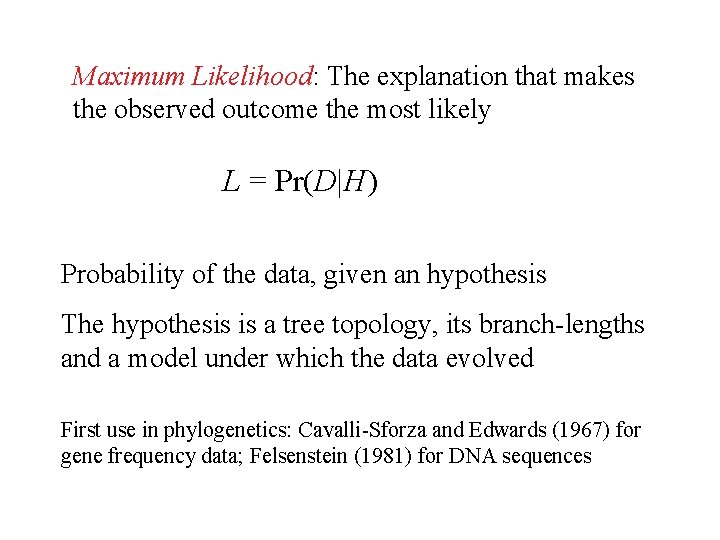
Maximum Likelihood: The explanation that makes the observed outcome the most likely L = Pr(D|H) Probability of the data, given an hypothesis The hypothesis is a tree topology, its branch-lengths and a model under which the data evolved First use in phylogenetics: Cavalli-Sforza and Edwards (1967) for gene frequency data; Felsenstein (1981) for DNA sequences
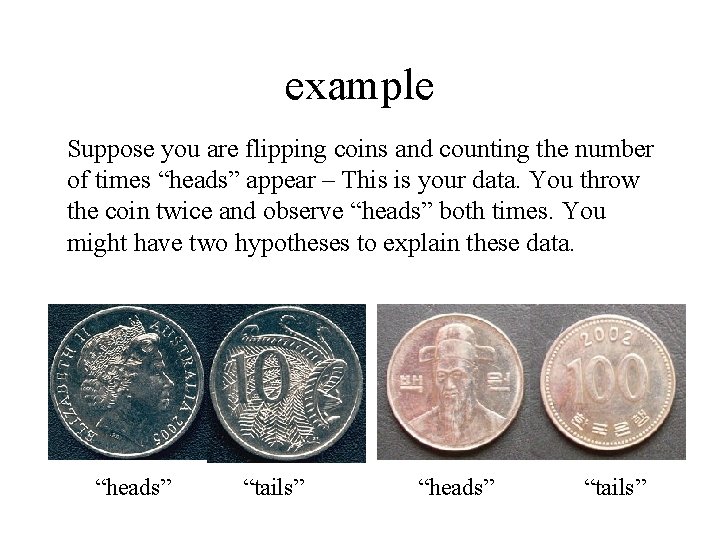
example Suppose you are flipping coins and counting the number of times “heads” appear – This is your data. You throw the coin twice and observe “heads” both times. You might have two hypotheses to explain these data. “heads” “tails”
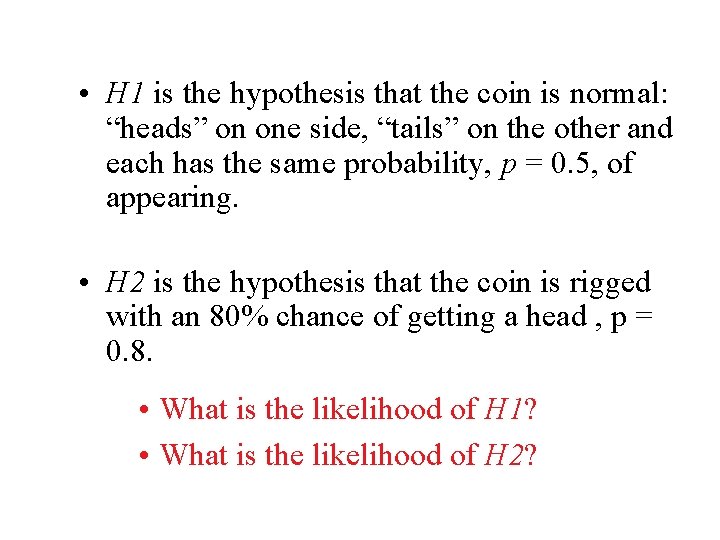
• H 1 is the hypothesis that the coin is normal: “heads” on one side, “tails” on the other and each has the same probability, p = 0. 5, of appearing. • H 2 is the hypothesis that the coin is rigged with an 80% chance of getting a head , p = 0. 8. • What is the likelihood of H 1? • What is the likelihood of H 2?
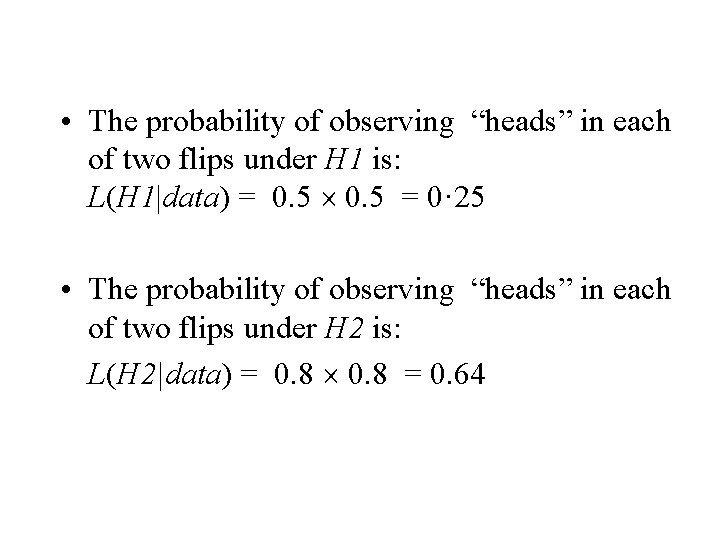
• The probability of observing “heads” in each of two flips under H 1 is: L(H 1|data) = 0. 5 = 0· 25 • The probability of observing “heads” in each of two flips under H 2 is: L(H 2|data) = 0. 8 = 0. 64
Since the probability of observing the data under H 2 is greater than under H 1, you might argue that the “rigged” coin hypothesis is the more likely. However, if you flipped the same coin 20 times and got “heads” 8 times, would H 2 still be the better explanation of the data?
• Note that you could flip “heads” and “tails” in different orders • E. g. HTHHTHTTHTTTTHHTTHTT • Or HHHHTTTTTT There actually 20 choose 8 ways to do this
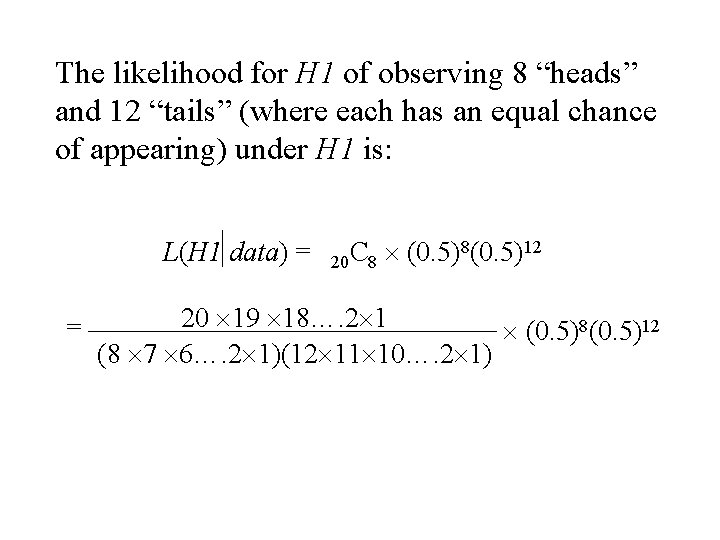
The likelihood for H 1 of observing 8 “heads” and 12 “tails” (where each has an equal chance of appearing) under H 1 is: L(H 1 data) = = 8(0. 5)12 C (0. 5) 20 8 20 19 18…. 2 1 (0. 5)8(0. 5)12 (8 7 6…. 2 1)(12 11 10…. 2 1)
Numbers can be very low, so normally take natural logs ln. L(H 1)= 2. 119 The likelihood for H 2 of observing 8 “heads” and 12 “tails” (where “heads has a probability of 0. 8 of appearing) under H 2 is: L(H 2 data) = 20 C 8 (0. 8)8(0. 2)12 ln. L(H 2)= 9. 355 Maximum likelihood is less likely to be misleading with more data
The maximum likelihood estimate (MLE) Plotting likelihood (or –ln. L) values for different parameter values (e. g. equilibrium base frequency for Adenine, πA) gives the likelihood surface. The best score on this surface (the lowest point) identifies the maximum likelihood estimate (MLE), and indicates the hypothesis best supported by the data. Here the MLE for πA ≈ 0. 35 πA
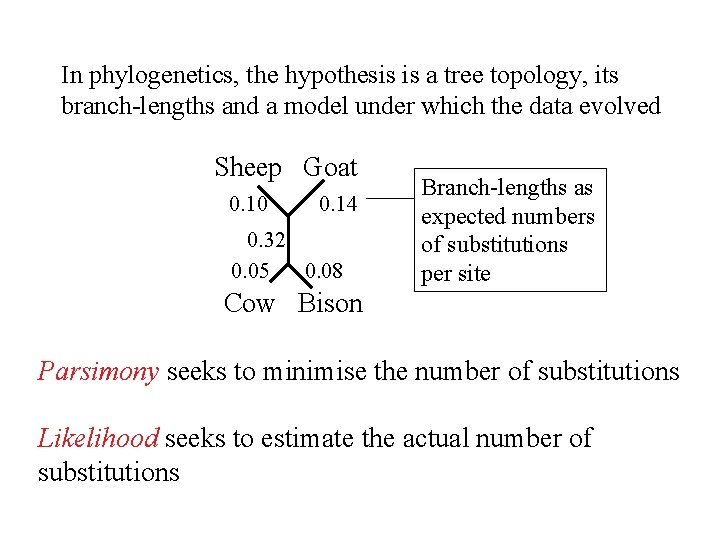
In phylogenetics, the hypothesis is a tree topology, its branch-lengths and a model under which the data evolved Sheep Goat 0. 10 0. 14 0. 32 0. 05 0. 08 Branch-lengths as expected numbers of substitutions per site Cow Bison Parsimony seeks to minimise the number of substitutions Likelihood seeks to estimate the actual number of substitutions
Parsimony assumes that having knowledge about how some sites are evolving tells us nothing about other sites. Likelihood assumes that sites evolve independently, but by common mechanisms Oak Ash Maple ATGACCGCTGCCAG ACGCTCGCCATCAG ATGCTCGCTACCGG Transitions at six sites, only one transversion is observed Hence, an ML model should allow for different transition and transversion substitution rates A Purines G C T Pyrimidines Transitions Transversions
The model is reversible, ie. p(A G) = p(A G), so the root can be placed at any node Pattern probability = p(G G) p(G A) p(A A) A A G Root G Under the simple Jukes-Cantor model, all base frequencies=0. 25, all substitutions equally probable. b is branch-length (subs/site) Pij (i=j) = 0. 25+0. 75 e b Pij (i≠j) = 0. 25 -0. 25 e b b is branch-length (subs/site)
A Pij (i=j) = 0. 25+0. 75 e b A 0. 5 G Pij (i≠j) = 0. 25 -0. 25 e b G 0. 5 b is branch-length (subs/site) G Root Where b=0. 5, Pij (I=j) = 0. 7049, Pij(i≠j) = 0. 0984 Site pattern probability = p(G G) p(G A) p(A A) = 0. 7049 0. 0984 0. 7049 = 0. 0243
A A A G C A A A T A A A A G C C G G G A A A A A C T A G C C C T T T G G G G G A A A T A G T G G G G A A A C T G G G G The site likelihood is the sum of the probabilities for the 16 possible site patterns = 0. 0333 Hence, the site ln. L = 3. 402
Tree 1 Tree 2 The likelihood of a tree is the product of the site likelihoods. Taken as natural logs, the site likelihoods can be summed to give the log likelihood: the tree with the highest likelihood (lowest –ln. L) is the ML tree. Site Tree 2 is the ML tree by 8. 801 –ln. L units 1 2. . 1206 –ln. L(1) 2. 457 1. 568. . 2. 541 2052. 456 –ln. L(2) 2. 891 1. 943. . 1. 943 2043. 655
Long-branch attraction Simulation tree 1 Parsimony reconstruction 2 1 4 3 2 4 3 Sequence at root: AGACTGATCGATTAG Sequence ATACGGACAGAACGGTTAAG AGACTGATCGATTAG AGAATGATCGATTAG CGAATGATCGAATGGACTTG at at 1: 2: 3: 4: True synapomorphy Parallel change Back mutation
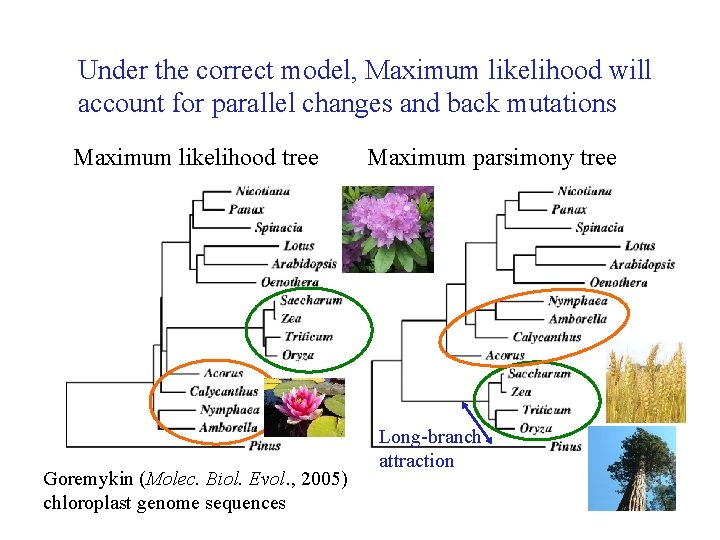
Under the correct model, Maximum likelihood will account for parallel changes and back mutations Maximum likelihood tree Goremykin (Molec. Biol. Evol. , 2005) chloroplast genome sequences Maximum parsimony tree Long-branch attraction
Major programs supporting maximum likelihood analysis • PHYLIP (http: //evolution. gs. washington. edu/phylip/software. html) • PAUP* (http: //paup. csit. fsu. edu) • PHYML (http: //atgc. lirmm. fr/phyml/) • PAML (http: //abacus. gene. ucl. ac. uk/software/paml. html) • TREE-PUZZLE (http: //www. tree-puzzle. de) • DAMBE (http: //aix 1. uottawa. ca/~xxia/software. htm)
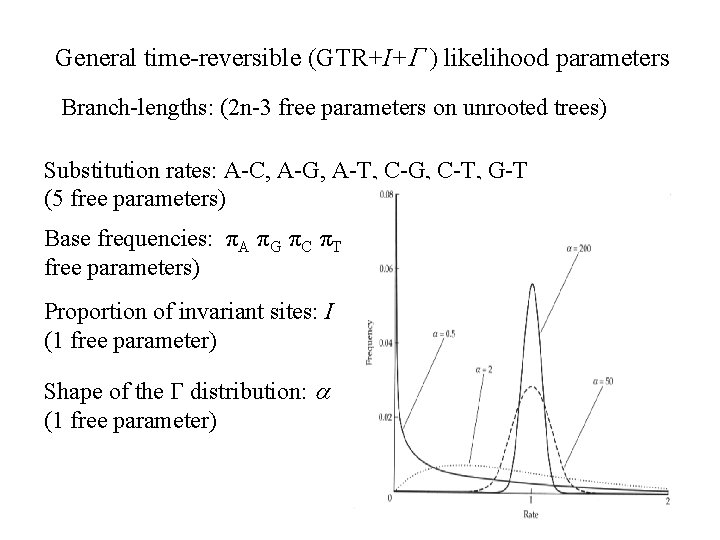
General time-reversible (GTR+I+ ) likelihood parameters Branch-lengths: (2 n-3 free parameters on unrooted trees) Substitution rates: A-C, A-G, A-T, C-G, C-T, G-T (5 free parameters) Base frequencies: πA πG πC πT free parameters) Proportion of invariant sites: I (1 free parameter) Shape of the distribution: (1 free parameter) (3
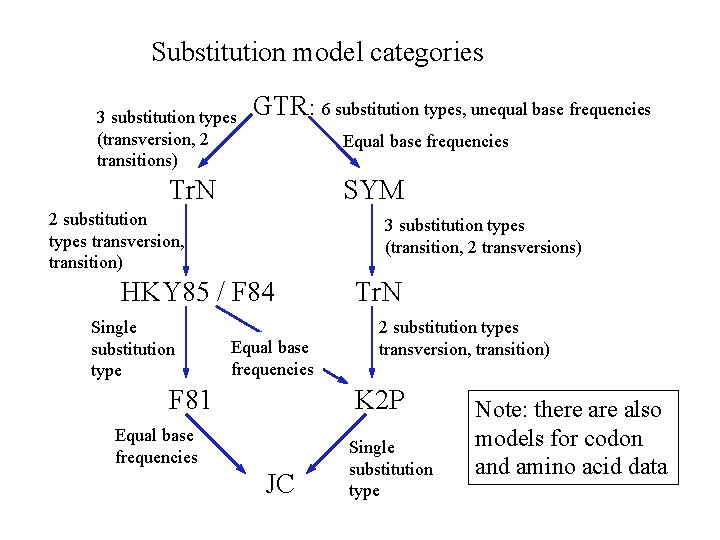
Substitution model categories 3 substitution types (transversion, 2 transitions) GTR: 6 substitution types, unequal base frequencies Equal base frequencies Tr. N SYM 2 substitution types transversion, transition) 3 substitution types (transition, 2 transversions) HKY 85 / F 84 Single substitution type Equal base frequencies F 81 Tr. N 2 substitution types transversion, transition) K 2 P Equal base frequencies JC Single substitution type Note: there also models for codon and amino acid data
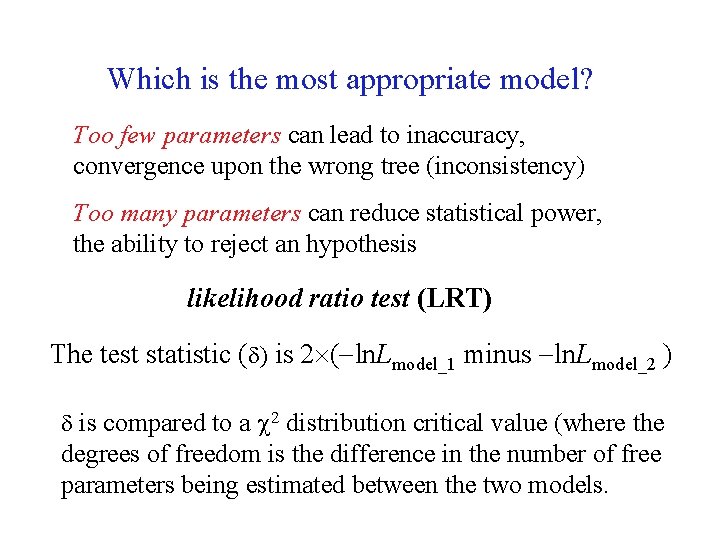
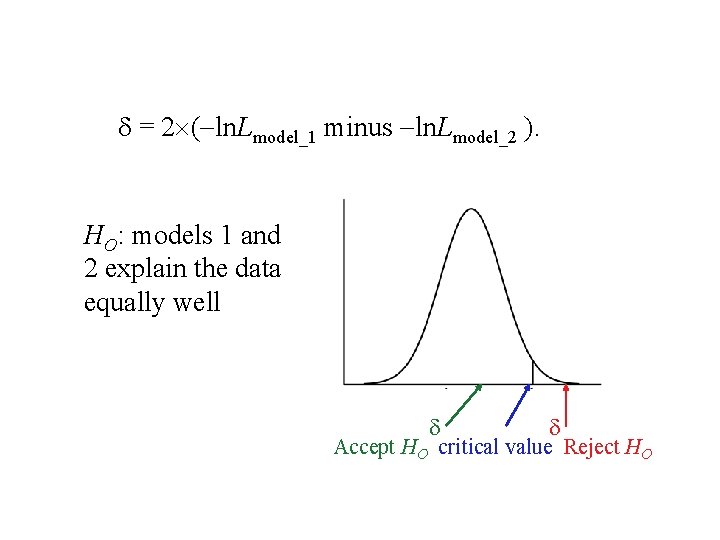
Which is the most appropriate model? Too few parameters can lead to inaccuracy, convergence upon the wrong tree (inconsistency) Too many parameters can reduce statistical power, the ability to reject an hypothesis likelihood ratio test (LRT) The test statistic ( ) is 2 ( ln. Lmodel_1 minus ln. Lmodel_2 ) is compared to a 2 distribution critical value (where the degrees of freedom is the difference in the number of free parameters being estimated between the two models.
= 2 ( ln. Lmodel_1 minus ln. Lmodel_2 ). HO: models 1 and 2 explain the data equally well Accept HO critical value Reject HO
The Akaike Information Criterion (AIC) AIC for each model = 2 ln. L + (2 the number of free parameters) Choose the model with the lower AIC • Can be compared between non-nested models • Does not assume a 2 distribution • May tend to over-parameterization more than LRT
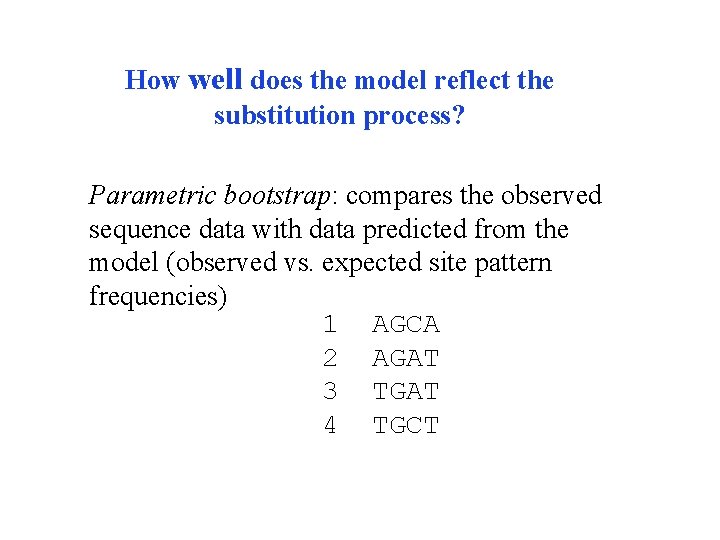
How well does the model reflect the substitution process? Parametric bootstrap: compares the observed sequence data with data predicted from the model (observed vs. expected site pattern frequencies) 1 AGCA 2 AGAT 3 TGAT 4 TGCT
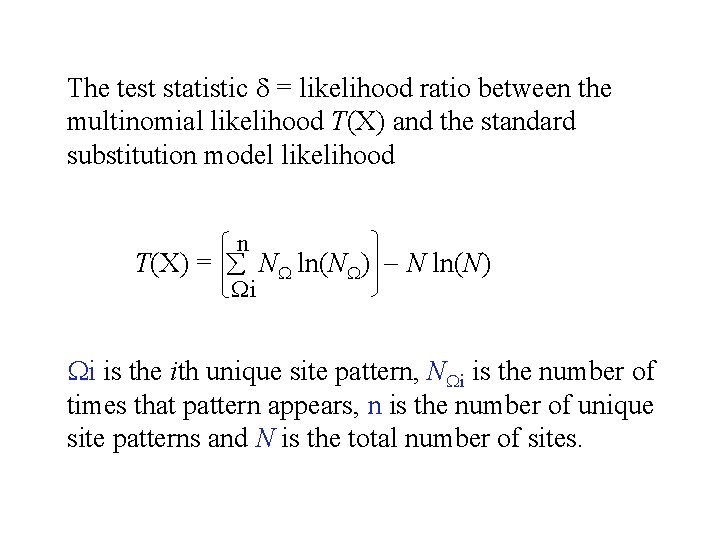
The test statistic = likelihood ratio between the multinomial likelihood T(X) and the standard substitution model likelihood n T(X) = N ln(N ) N ln(N) i i is the ith unique site pattern, N i is the number of times that pattern appears, n is the number of unique site patterns and N is the total number of sites.
1. Calculate the test statistic O for the observed data 2. Simulate many pesudoreplicate datasets using the ML topology, branch lengths and model parameters 3. Calculate the test statistic i for each of the pseudoreplicates 4. If O is greater than (e. g. ) 95% of the ranked values of i then the null hypothesis is rejected 145 140 135 125 130 120 115 105 110 frequency O = 126. 7 p = 0. 317
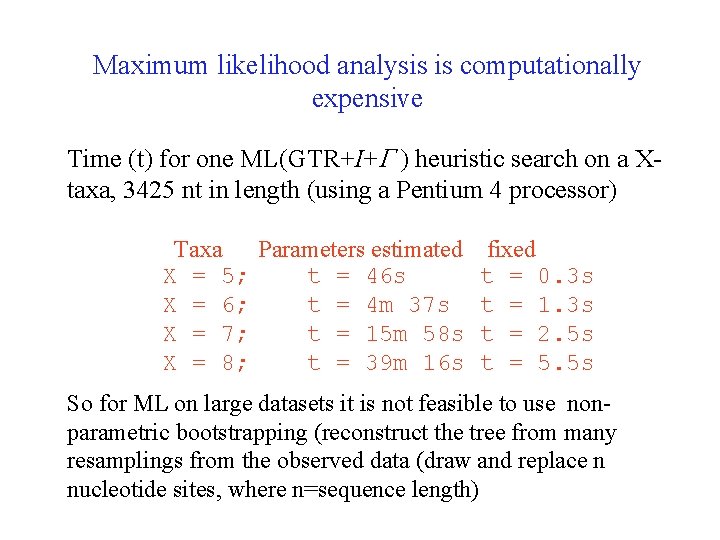
Maximum likelihood analysis is computationally expensive Time (t) for one ML(GTR+I+ ) heuristic search on a Xtaxa, 3425 nt in length (using a Pentium 4 processor) Taxa Parameters estimated X = 5; t = 46 s X = 6; t = 4 m 37 s X = 7; t = 15 m 58 s X = 8; t = 39 m 16 s fixed t = 0. 3 s t = 1. 3 s t = 2. 5 s t = 5. 5 s So for ML on large datasets it is not feasible to use nonparametric bootstrapping (reconstruct the tree from many resamplings from the observed data (draw and replace n nucleotide sites, where n=sequence length)
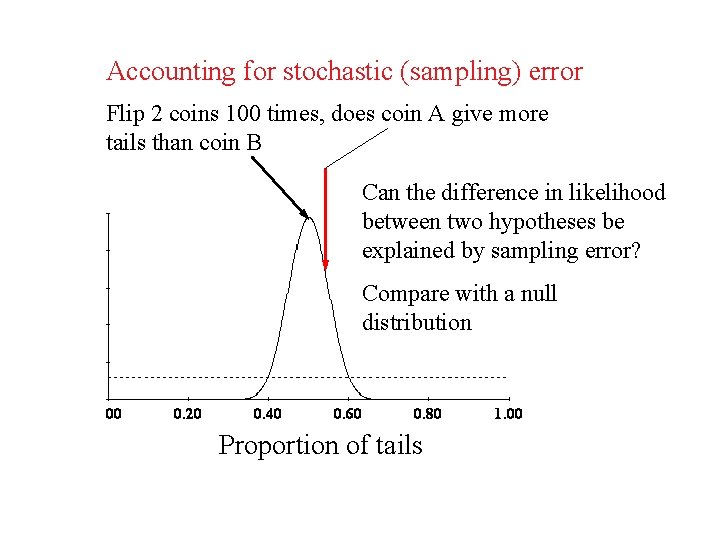
Accounting for stochastic (sampling) error Flip 2 coins 100 times, does coin A give more tails than coin B Can the difference in likelihood between two hypotheses be explained by sampling error? Compare with a null distribution Proportion of tails
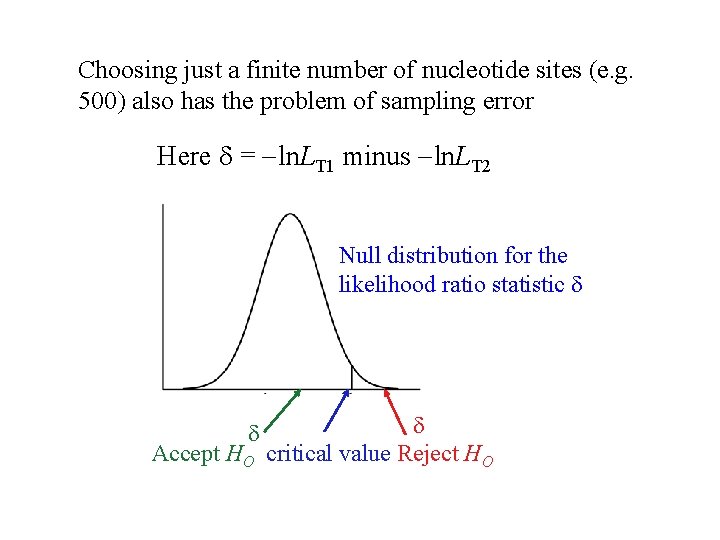
Choosing just a finite number of nucleotide sites (e. g. 500) also has the problem of sampling error Here = ln. LT 1 minus ln. LT 2 Null distribution for the likelihood ratio statistic Accept HO critical value Reject HO
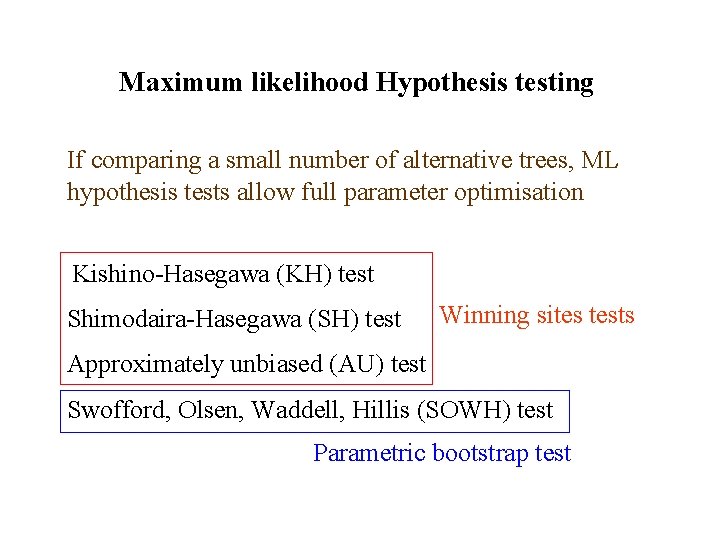
Maximum likelihood Hypothesis testing If comparing a small number of alternative trees, ML hypothesis tests allow full parameter optimisation Kishino-Hasegawa (KH) test Shimodaira-Hasegawa (SH) test Winning sites tests Approximately unbiased (AU) test Swofford, Olsen, Waddell, Hillis (SOWH) test Parametric bootstrap test
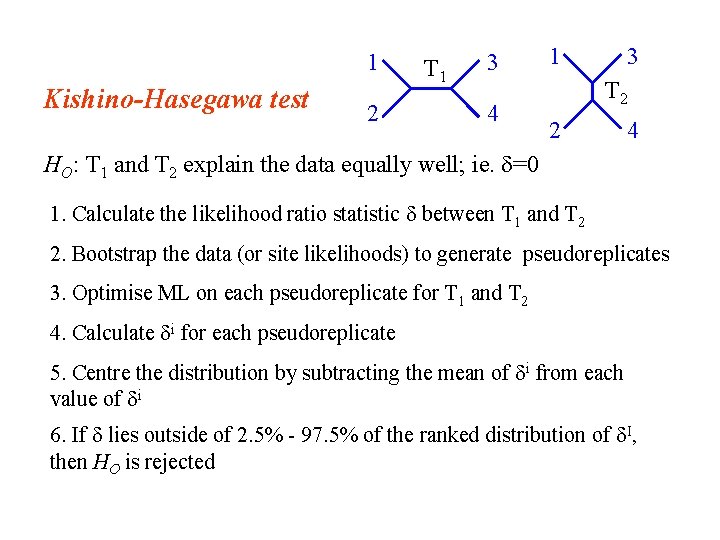
1 Kishino-Hasegawa test 2 T 1 3 4 1 3 T 2 2 4 HO: T 1 and T 2 explain the data equally well; ie. =0 1. Calculate the likelihood ratio statistic between T 1 and T 2 2. Bootstrap the data (or site likelihoods) to generate pseudoreplicates 3. Optimise ML on each pseudoreplicate for T 1 and T 2 4. Calculate i for each pseudoreplicate 5. Centre the distribution by subtracting the mean of i from each value of i 6. If lies outside of 2. 5% - 97. 5% of the ranked distribution of I, then HO is rejected
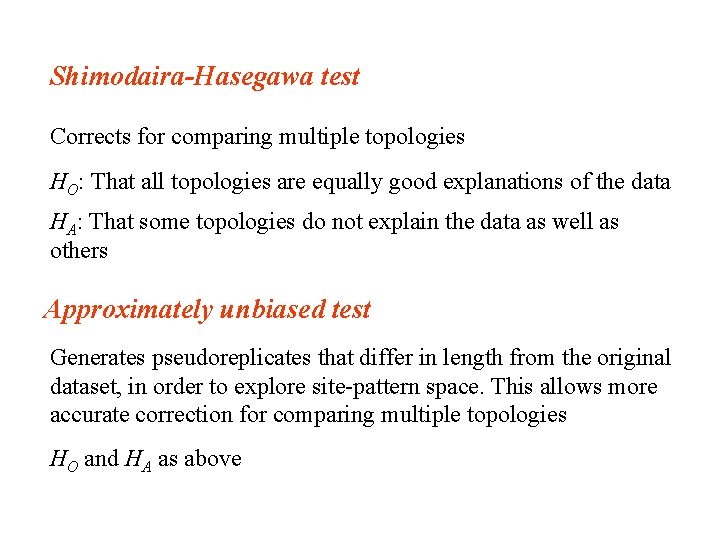
Shimodaira-Hasegawa test Corrects for comparing multiple topologies HO: That all topologies are equally good explanations of the data HA: That some topologies do not explain the data as well as others Approximately unbiased test Generates pseudoreplicates that differ in length from the original dataset, in order to explore site-pattern space. This allows more accurate correction for comparing multiple topologies HO and HA as above
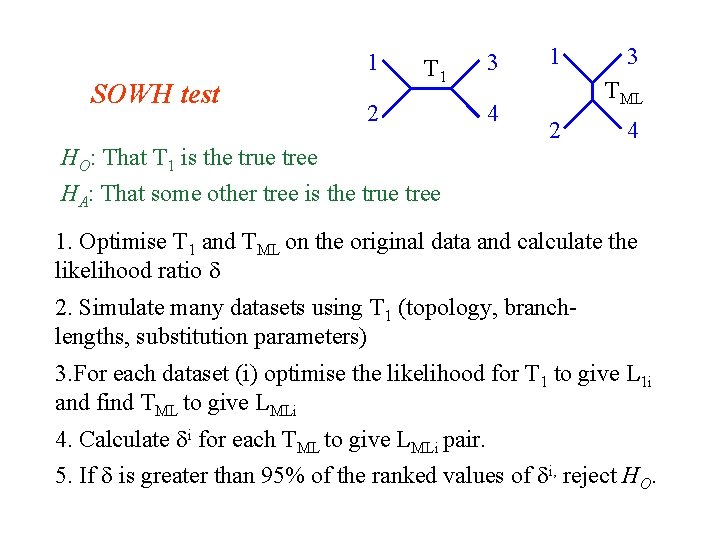
1 SOWH test T 1 2 3 4 1 3 TML 2 4 HO: That T 1 is the true tree HA: That some other tree is the true tree 1. Optimise T 1 and TML on the original data and calculate the likelihood ratio 2. Simulate many datasets using T 1 (topology, branchlengths, substitution parameters) 3. For each dataset (i) optimise the likelihood for T 1 to give L 1 i and find TML to give LMLi 4. Calculate i for each TML to give LMLi pair. 5. If is greater than 95% of the ranked values of i, reject HO.
Which hypothesis test to use? If just pairwise hypothesis testing and neither is a priori known to be the ML tree, then the KH test If comparing many topologies simultaneously and the curvature of site-pattern space can be defined, then AU test, otherwise, SH test, which is very conservative and the power to reject HO is dependent on the number of topologies tested) SOWH tests the full phylogenetic model (topology, branchlengths, substitution parameters), so can be difficult to interpret when the object is specifically to compare topologies. If the model is misspecified it will not be conservative enough.
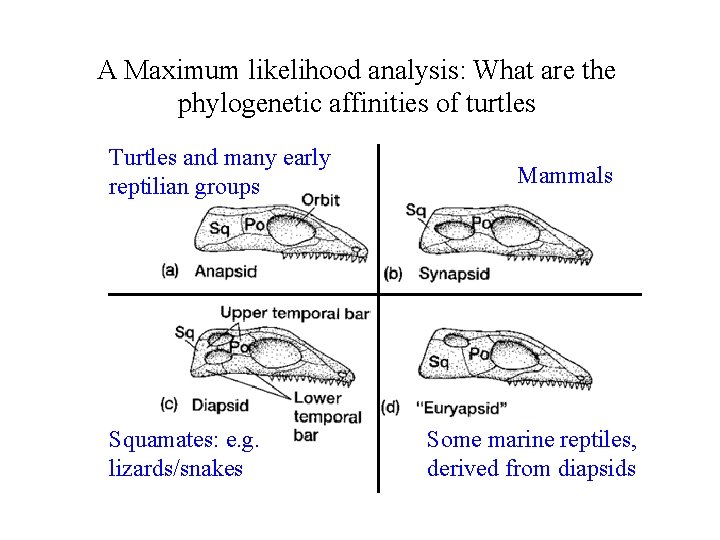
A Maximum likelihood analysis: What are the phylogenetic affinities of turtles Turtles and many early reptilian groups Squamates: e. g. lizards/snakes Mammals Some marine reptiles, derived from diapsids
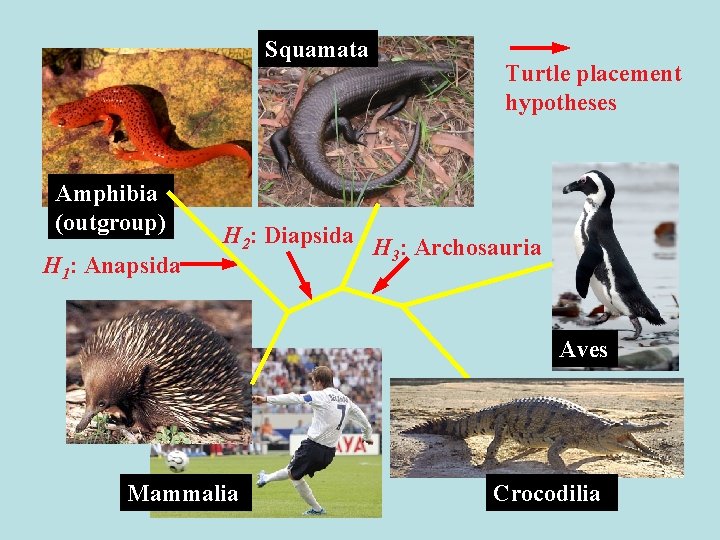
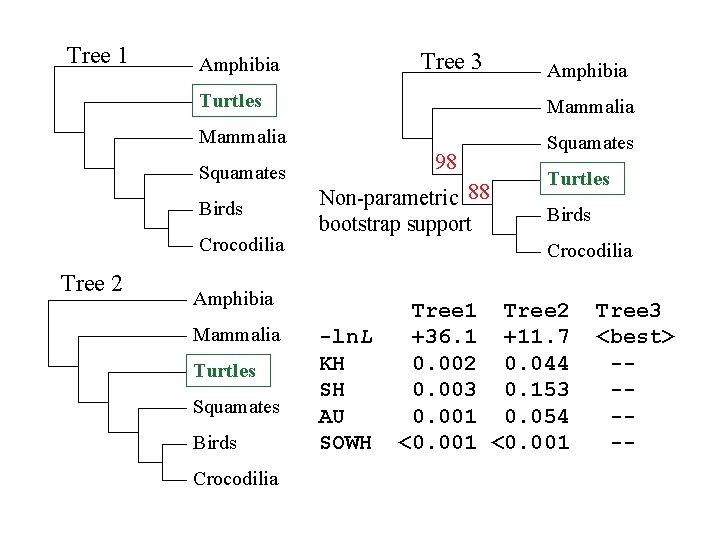
Squamata Amphibia (outgroup) H 1: Anapsida Turtle placement hypotheses H 2: Diapsida H : Archosauria 3 Aves Mammalia Crocodilia
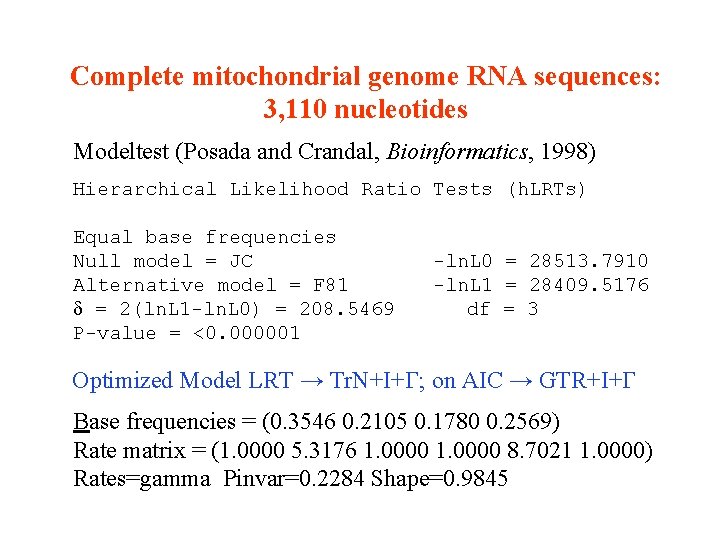
Complete mitochondrial genome RNA sequences: 3, 110 nucleotides Modeltest (Posada and Crandal, Bioinformatics, 1998) Hierarchical Likelihood Ratio Tests (h. LRTs) Equal base frequencies Null model = JC Alternative model = F 81 = 2(ln. L 1 -ln. L 0) = 208. 5469 P-value = <0. 000001 -ln. L 0 = 28513. 7910 -ln. L 1 = 28409. 5176 df = 3 Optimized Model LRT → Tr. N+I+ ; on AIC → GTR+I+ Base frequencies = (0. 3546 0. 2105 0. 1780 0. 2569) Rate matrix = (1. 0000 5. 3176 1. 0000 8. 7021 1. 0000) Rates=gamma Pinvar=0. 2284 Shape=0. 9845
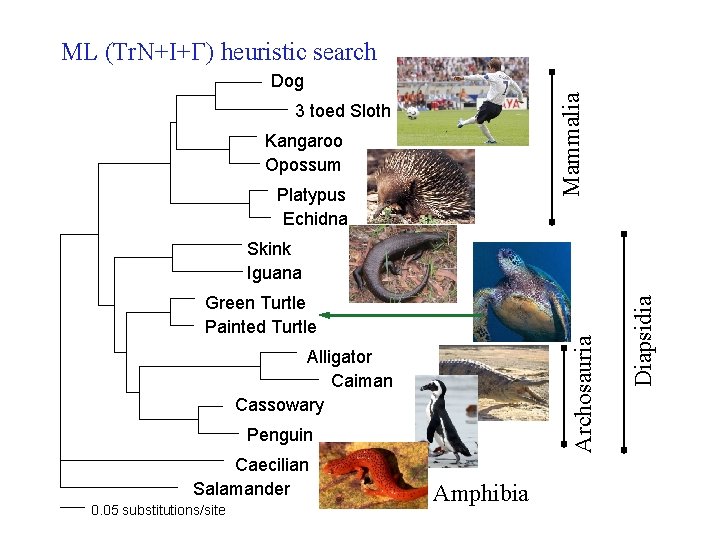
ML (Tr. N+I+ ) heuristic search Mammalia Dog 3 toed Sloth Kangaroo Opossum Platypus Echidna Archosauria Green Turtle Painted Turtle Alligator Caiman Cassowary Penguin Caecilian Salamander 0. 05 substitutions/site Amphibia Diapsidia Skink Iguana
Tree 1 Amphibia Turtles Mammalia Squamates Birds Crocodilia Tree 2 Tree 3 Amphibia 98 Non-parametric 88 bootstrap support Turtles Squamates Birds Crocodilia Amphibia Mammalia Turtles -ln. L KH SH AU SOWH Tree 1 Tree 2 +36. 1 +11. 7 0. 002 0. 044 0. 003 0. 153 0. 001 0. 054 <0. 001 Tree 3 <best> -----
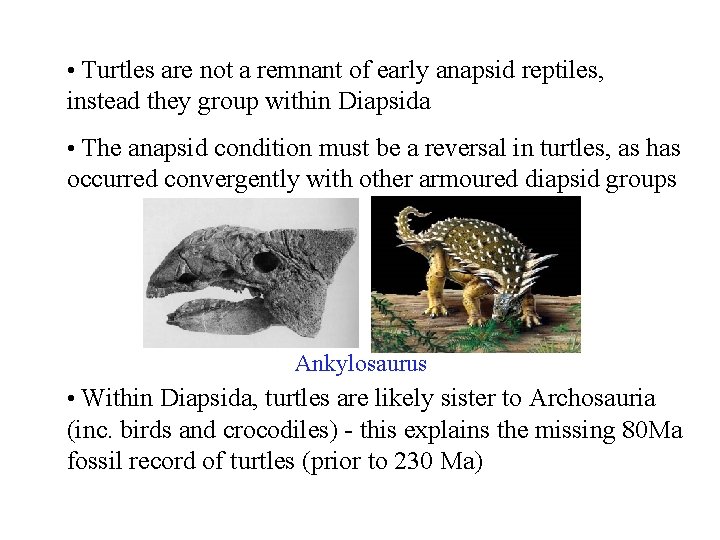
• Turtles are not a remnant of early anapsid reptiles, instead they group within Diapsida • The anapsid condition must be a reversal in turtles, as has occurred convergently with other armoured diapsid groups Ankylosaurus • Within Diapsida, turtles are likely sister to Archosauria (inc. birds and crocodiles) - this explains the missing 80 Ma fossil record of turtles (prior to 230 Ma)