
Lecture 5 6 Decision Analysis Decision Trees Chapter


- Slides: 50
Lecture 5 & 6 Decision Analysis Decision Trees Chapter 3 To accompany Quantitative Analysis for Management, Eleventh Edition, by Render, Stair, and Hanna
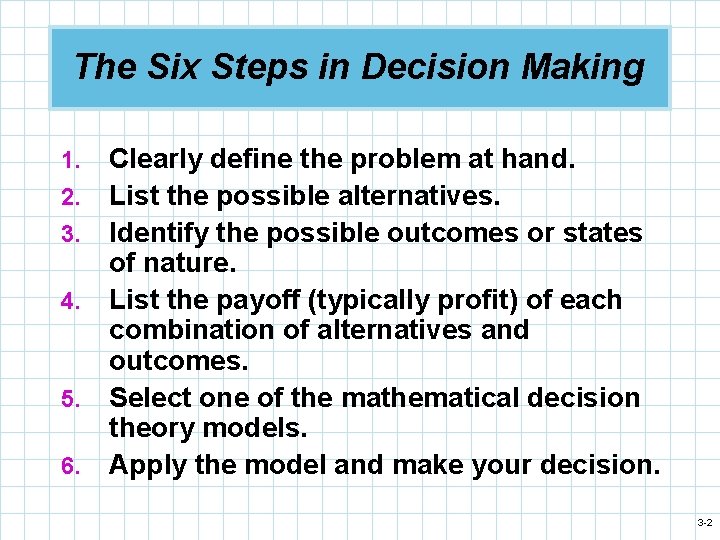
The Six Steps in Decision Making 1. 2. 3. 4. 5. 6. Clearly define the problem at hand. List the possible alternatives. Identify the possible outcomes or states of nature. List the payoff (typically profit) of each combination of alternatives and outcomes. Select one of the mathematical decision theory models. Apply the model and make your decision. 3 -2
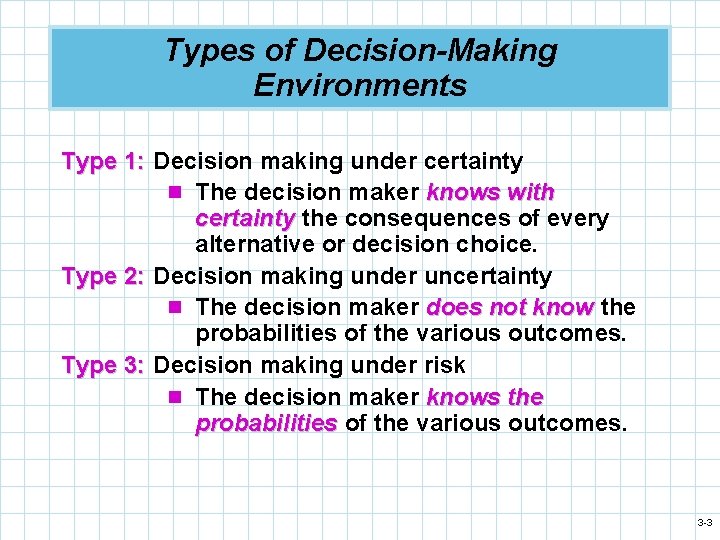
Types of Decision-Making Environments Type 1: Decision making under certainty n The decision maker knows with certainty the consequences of every alternative or decision choice. Type 2: Decision making under uncertainty n The decision maker does not know the probabilities of the various outcomes. Type 3: Decision making under risk n The decision maker knows the probabilities of the various outcomes. 3 -3
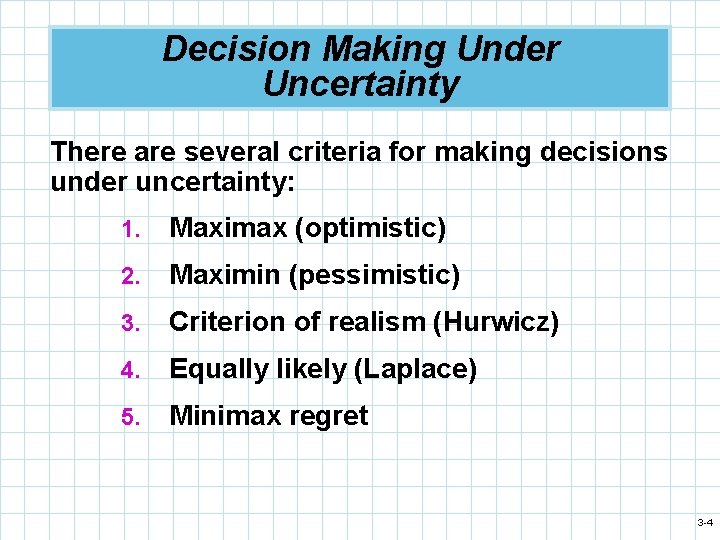
Decision Making Under Uncertainty There are several criteria for making decisions under uncertainty: 1. Maximax (optimistic) 2. Maximin (pessimistic) 3. Criterion of realism (Hurwicz) 4. Equally likely (Laplace) 5. Minimax regret 3 -4
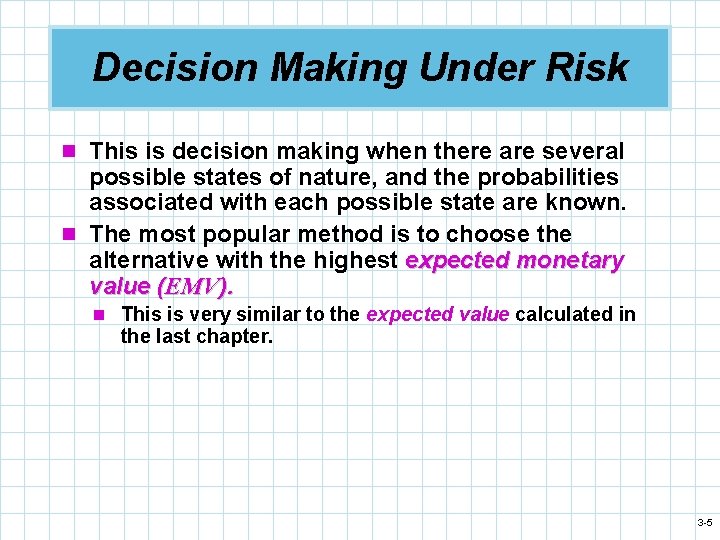
Decision Making Under Risk n This is decision making when there are several possible states of nature, and the probabilities associated with each possible state are known. n The most popular method is to choose the alternative with the highest expected monetary value (EMV). n This is very similar to the expected value calculated in the last chapter. 3 -5
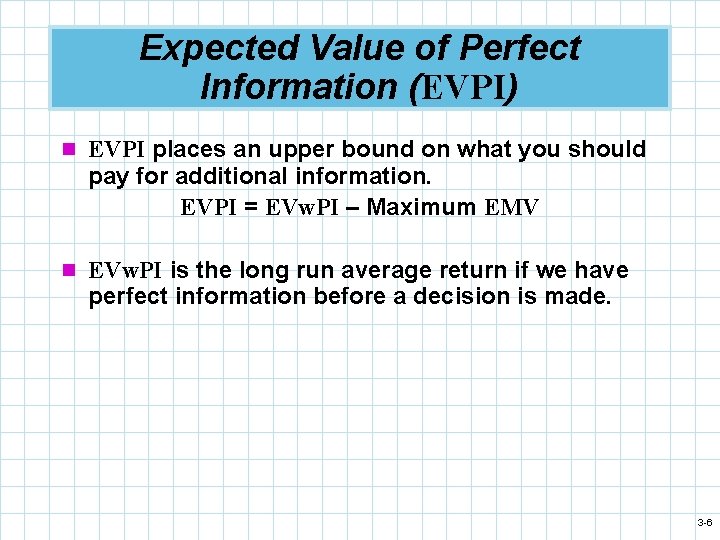
Expected Value of Perfect Information (EVPI) n EVPI places an upper bound on what you should pay for additional information. EVPI = EVw. PI – Maximum EMV n EVw. PI is the long run average return if we have perfect information before a decision is made. 3 -6
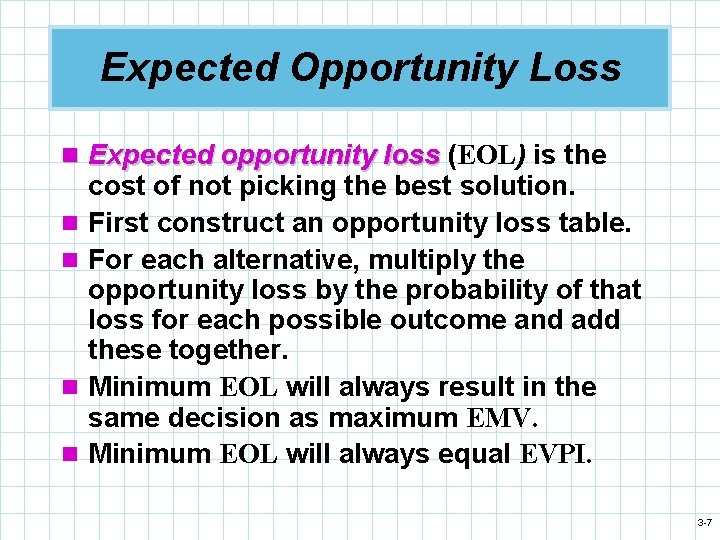
Expected Opportunity Loss n Expected opportunity loss (EOL) is the n n cost of not picking the best solution. First construct an opportunity loss table. For each alternative, multiply the opportunity loss by the probability of that loss for each possible outcome and add these together. Minimum EOL will always result in the same decision as maximum EMV. Minimum EOL will always equal EVPI. 3 -7
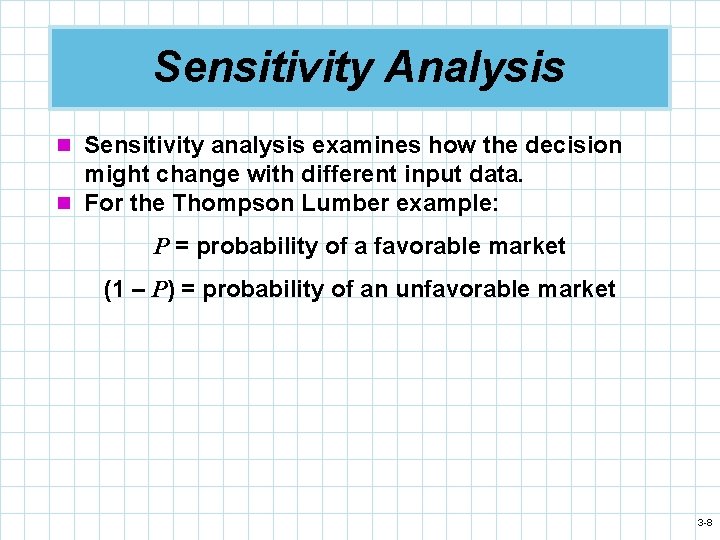
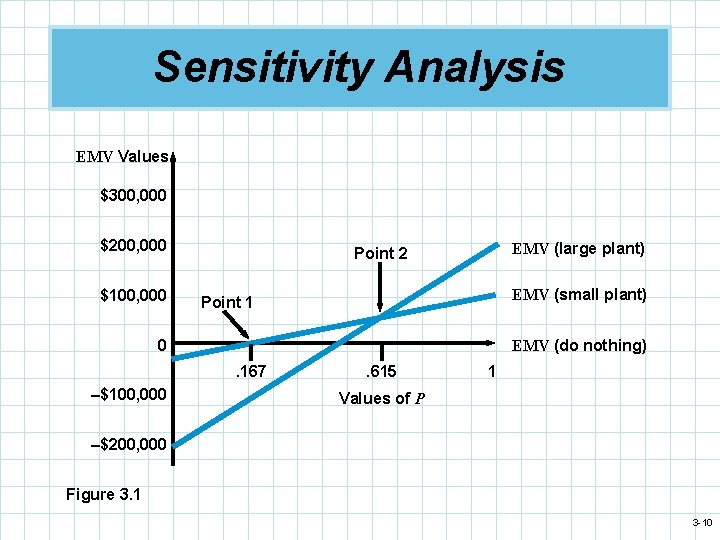
Sensitivity Analysis n Sensitivity analysis examines how the decision might change with different input data. n For the Thompson Lumber example: P = probability of a favorable market (1 – P) = probability of an unfavorable market 3 -8
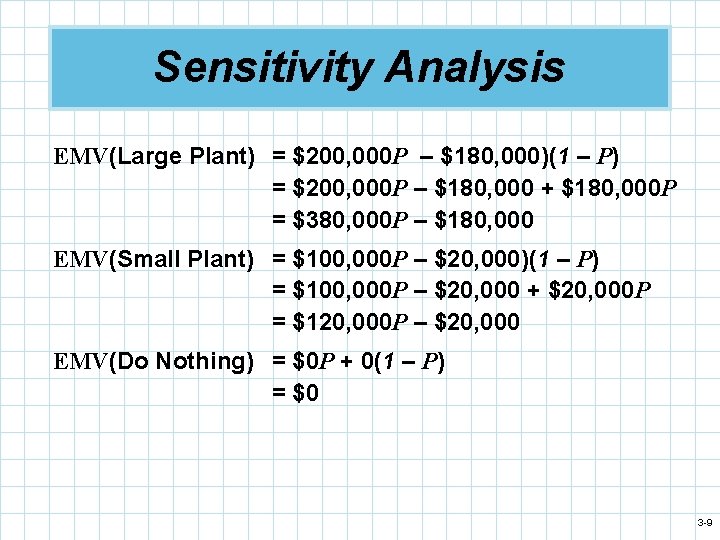
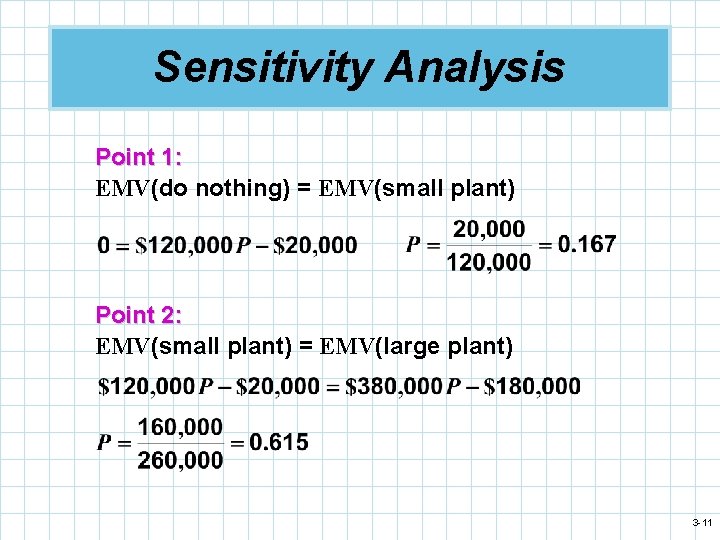
Sensitivity Analysis EMV(Large Plant) = $200, 000 P – $180, 000)(1 – P) = $200, 000 P – $180, 000 + $180, 000 P = $380, 000 P – $180, 000 EMV(Small Plant) = $100, 000 P – $20, 000)(1 – P) = $100, 000 P – $20, 000 + $20, 000 P = $120, 000 P – $20, 000 EMV(Do Nothing) = $0 P + 0(1 – P) = $0 3 -9
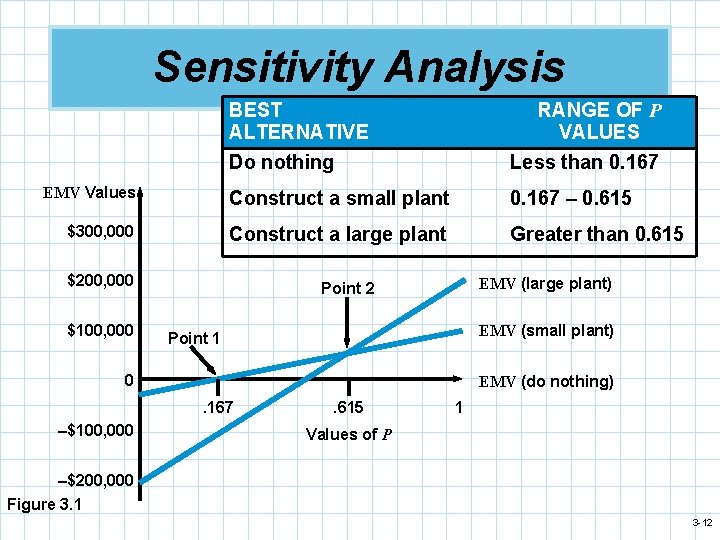
Sensitivity Analysis EMV Values $300, 000 $200, 000 $100, 000 EMV (large plant) Point 2 EMV (small plant) Point 1 0 EMV (do nothing). 167 –$100, 000 . 615 1 Values of P –$200, 000 Figure 3. 1 3 -10
Sensitivity Analysis Point 1: EMV(do nothing) = EMV(small plant) Point 2: EMV(small plant) = EMV(large plant) 3 -11
Sensitivity Analysis RANGE OF P VALUES BEST ALTERNATIVE Do nothing Less than 0. 167 EMV Values Construct a small plant 0. 167 – 0. 615 $300, 000 Construct a large plant Greater than 0. 615 $200, 000 $100, 000 EMV (large plant) Point 2 EMV (small plant) Point 1 0 EMV (do nothing). 167 –$100, 000 . 615 1 Values of P –$200, 000 Figure 3. 1 3 -12
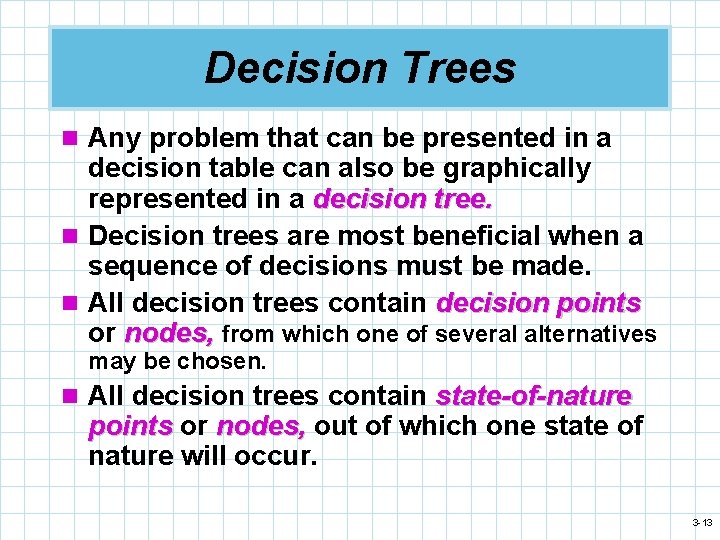
Decision Trees n Any problem that can be presented in a decision table can also be graphically represented in a decision tree. n Decision trees are most beneficial when a sequence of decisions must be made. n All decision trees contain decision points or nodes, from which one of several alternatives may be chosen. n All decision trees contain state-of-nature points or nodes, out of which one state of nature will occur. 3 -13
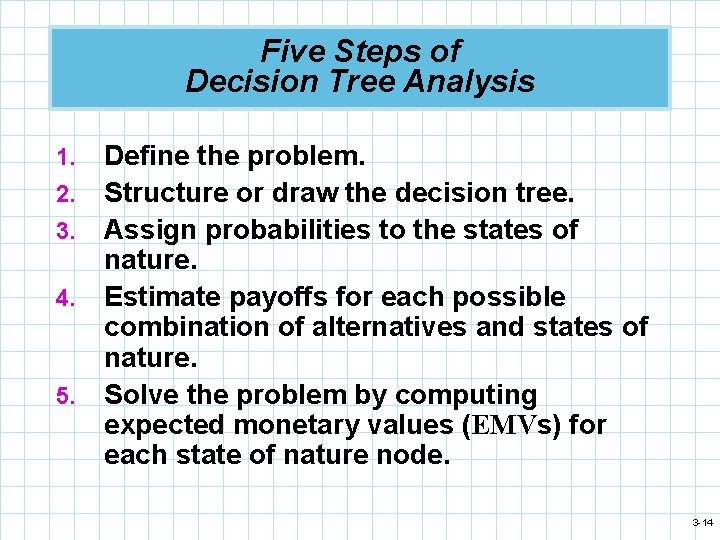
Five Steps of Decision Tree Analysis 1. 2. 3. 4. 5. Define the problem. Structure or draw the decision tree. Assign probabilities to the states of nature. Estimate payoffs for each possible combination of alternatives and states of nature. Solve the problem by computing expected monetary values (EMVs) for each state of nature node. 3 -14
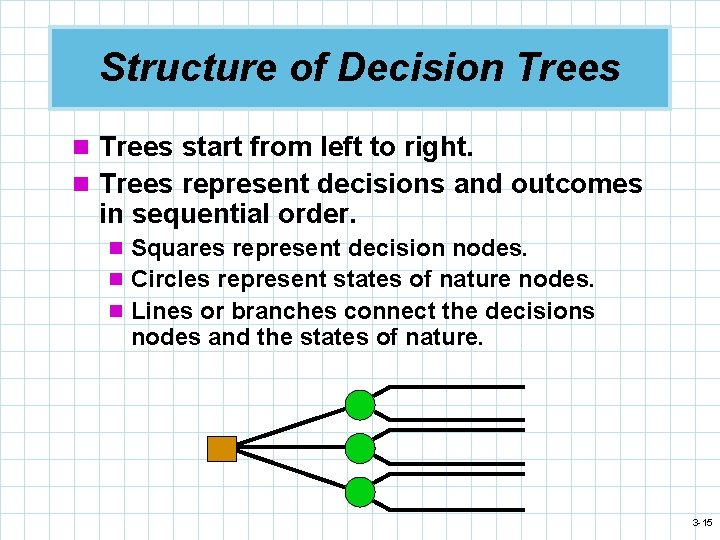
Structure of Decision Trees start from left to right. n Trees represent decisions and outcomes in sequential order. n Squares represent decision nodes. n Circles represent states of nature nodes. n Lines or branches connect the decisions nodes and the states of nature. 3 -15
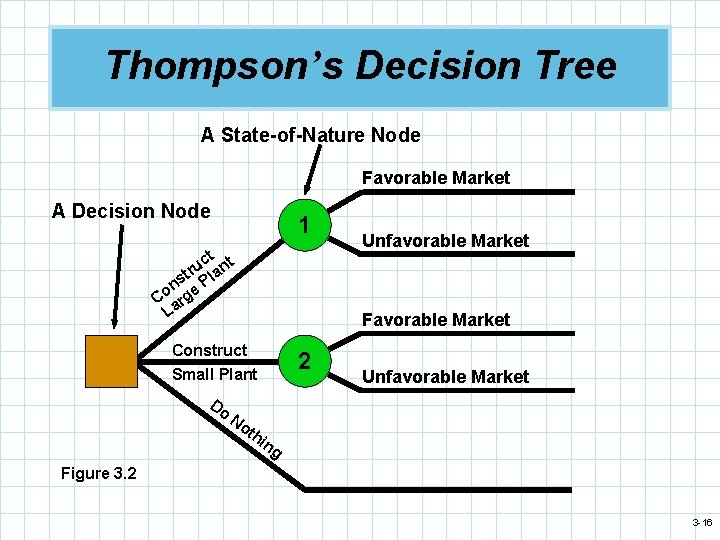
Thompson’s Decision Tree A State-of-Nature Node Favorable Market A Decision Node 1 ct nt u r st Pla n e Co arg L Favorable Market Construct Small Plant Do Unfavorable Market No th 2 Unfavorable Market in g Figure 3. 2 3 -16
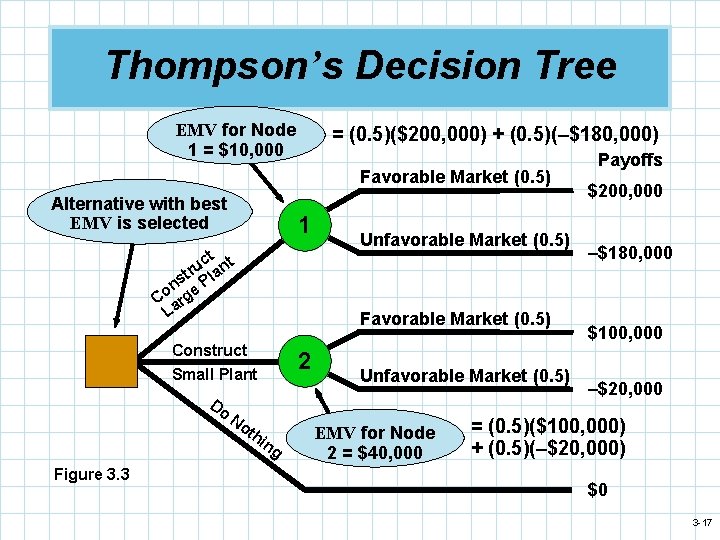
Thompson’s Decision Tree EMV for Node 1 = $10, 000 = (0. 5)($200, 000) + (0. 5)(–$180, 000) Favorable Market (0. 5) Alternative with best EMV is selected 1 ct nt u r st Pla n e Co arg L Favorable Market (0. 5) Construct Small Plant Do No 2 th Figure 3. 3 Unfavorable Market (0. 5) in g Unfavorable Market (0. 5) EMV for Node 2 = $40, 000 Payoffs $200, 000 –$180, 000 $100, 000 –$20, 000 = (0. 5)($100, 000) + (0. 5)(–$20, 000) $0 3 -17
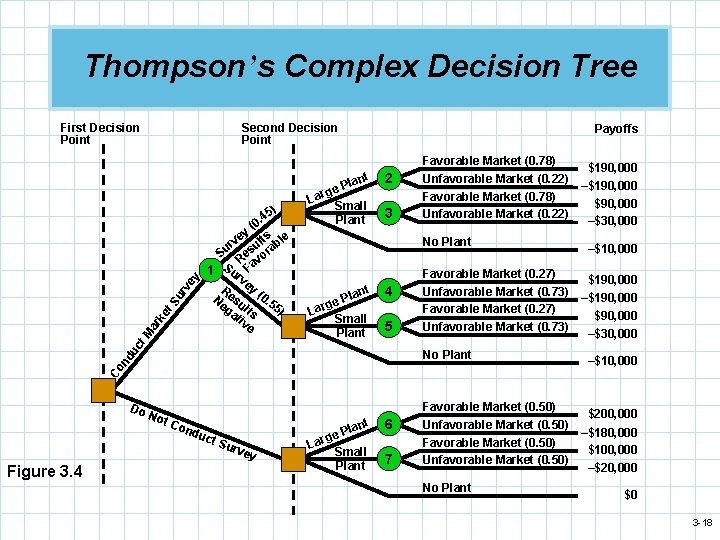
Thompson’s Complex Decision Tree First Decision Point Second Decision Point Payoffs 5). 4 0 ( y ts e e rv sul abl u S Re or v 1 Sur Fa ve Re y ( Ne su 0. 5 5) ga lts tiv e nt Pla ge Small Plant Lar 2 3 Unfavorable Market (0. 22) Favorable Market (0. 78) Unfavorable Market (0. 22) No Plant Favorable Market (0. 27) nt Pla ge Lar Small Plant 4 5 ct M ar k et S ur ve y Favorable Market (0. 78) Unfavorable Market (0. 73) Favorable Market (0. 27) Unfavorable Market (0. 73) Co nd u No Plant Do Not Favorable Market (0. 50) Con duc t. S urv Figure 3. 4 ey nt Pla ge Small Plant Lar 6 7 Unfavorable Market (0. 50) Favorable Market (0. 50) Unfavorable Market (0. 50) No Plant $190, 000 –$190, 000 $90, 000 –$30, 000 –$10, 000 $200, 000 –$180, 000 $100, 000 –$20, 000 $0 3 -18
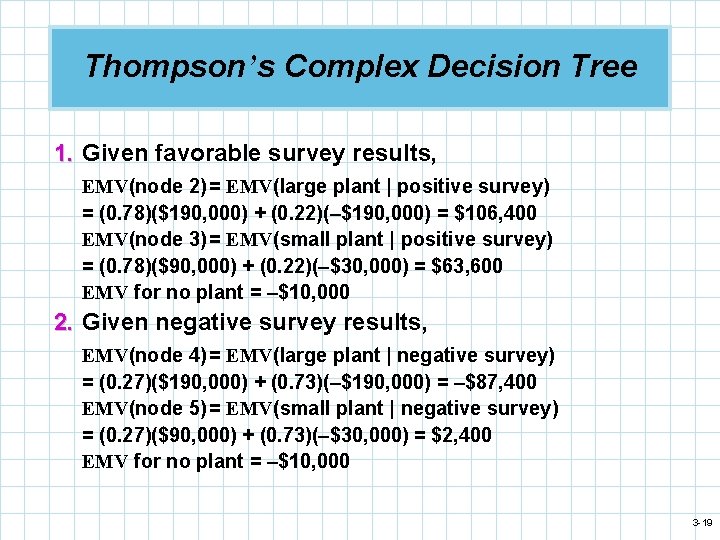
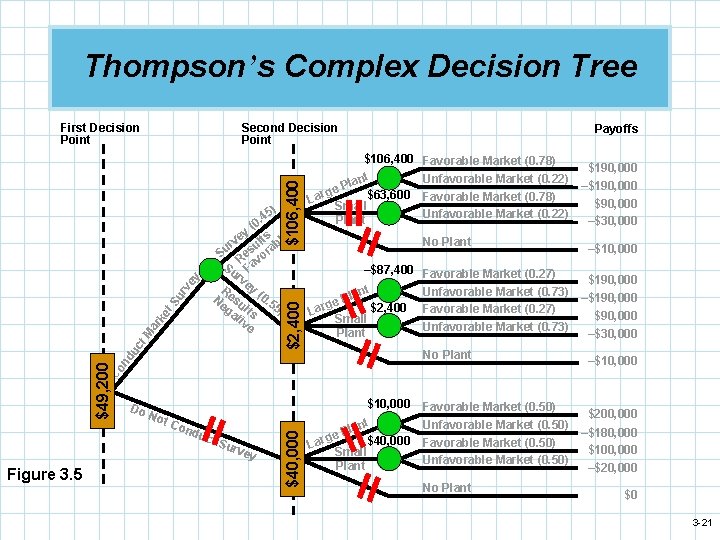
Thompson’s Complex Decision Tree 1. Given favorable survey results, EMV(node 2) = EMV(large plant | positive survey) = (0. 78)($190, 000) + (0. 22)(–$190, 000) = $106, 400 EMV(node 3) = EMV(small plant | positive survey) = (0. 78)($90, 000) + (0. 22)(–$30, 000) = $63, 600 EMV for no plant = –$10, 000 2. Given negative survey results, EMV(node 4) = EMV(large plant | negative survey) = (0. 27)($190, 000) + (0. 73)(–$190, 000) = –$87, 400 EMV(node 5) = EMV(small plant | negative survey) = (0. 27)($90, 000) + (0. 73)(–$30, 000) = $2, 400 EMV for no plant = –$10, 000 3 -19
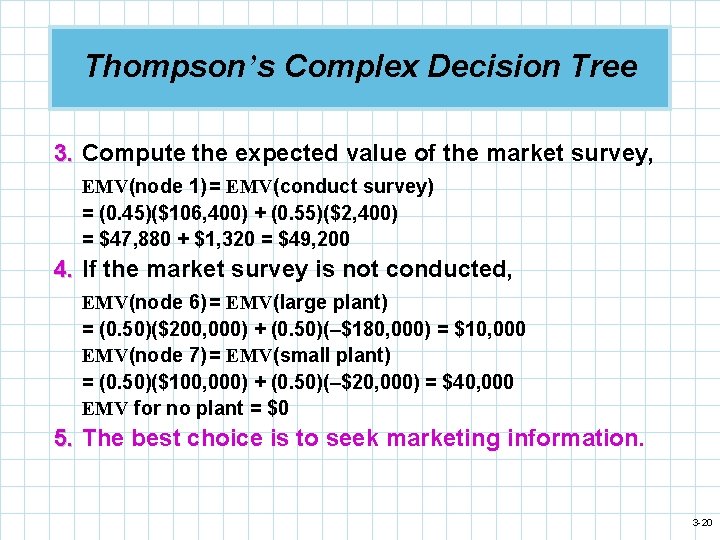
Thompson’s Complex Decision Tree 3. Compute the expected value of the market survey, EMV(node 1) = EMV(conduct survey) = (0. 45)($106, 400) + (0. 55)($2, 400) = $47, 880 + $1, 320 = $49, 200 4. If the market survey is not conducted, EMV(node 6) = EMV(large plant) = (0. 50)($200, 000) + (0. 50)(–$180, 000) = $10, 000 EMV(node 7) = EMV(small plant) = (0. 50)($100, 000) + (0. 50)(–$20, 000) = $40, 000 EMV for no plant = $0 5. The best choice is to seek marketing information. 3 -20
Thompson’s Complex Decision Tree First Decision Point $2, 400 5). 4 0 ( y ts e e rv sul abl u S Re or Su Fav rv e Re y ( Ne su 0. 5 5) ga lts tiv e Do Not Con duc t. S urv Figure 3. 5 Payoffs $106, 400 Favorable Market (0. 78) Unfavorable Market (0. 22) nt Pla e g $63, 600 Favorable Market (0. 78) Lar Small Unfavorable Market (0. 22) Plant No Plant –$87, 400 Favorable Market (0. 27) Unfavorable Market (0. 73) nt Pla e g $2, 400 Favorable Market (0. 27) Lar Small Unfavorable Market (0. 73) Plant No Plant $10, 000 ey $40, 000 $49, 200 C on du ct M ar ke t. S ur ve y $106, 400 Second Decision Point nt Pla e g $40, 000 Lar Small Plant Favorable Market (0. 50) Unfavorable Market (0. 50) No Plant $190, 000 –$190, 000 $90, 000 –$30, 000 –$10, 000 $200, 000 –$180, 000 $100, 000 –$20, 000 $0 3 -21
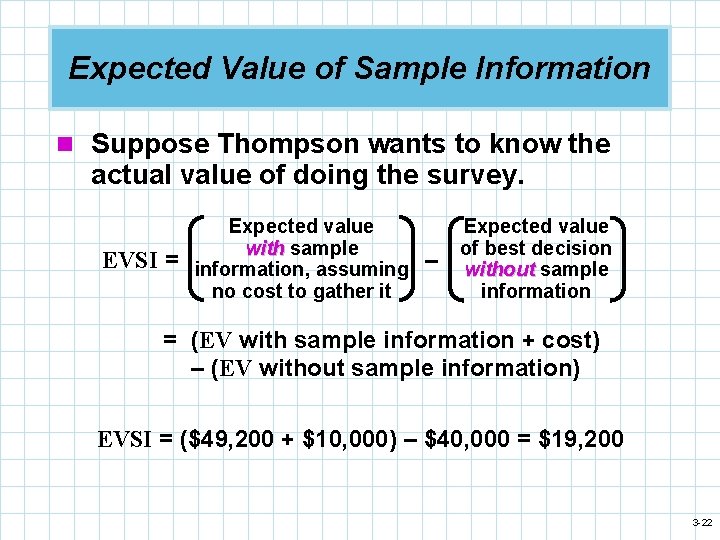
Expected Value of Sample Information n Suppose Thompson wants to know the actual value of doing the survey. EVSI = Expected value with sample information, assuming no cost to gather it – Expected value of best decision without sample information = (EV with sample information + cost) – (EV without sample information) EVSI = ($49, 200 + $10, 000) – $40, 000 = $19, 200 3 -22
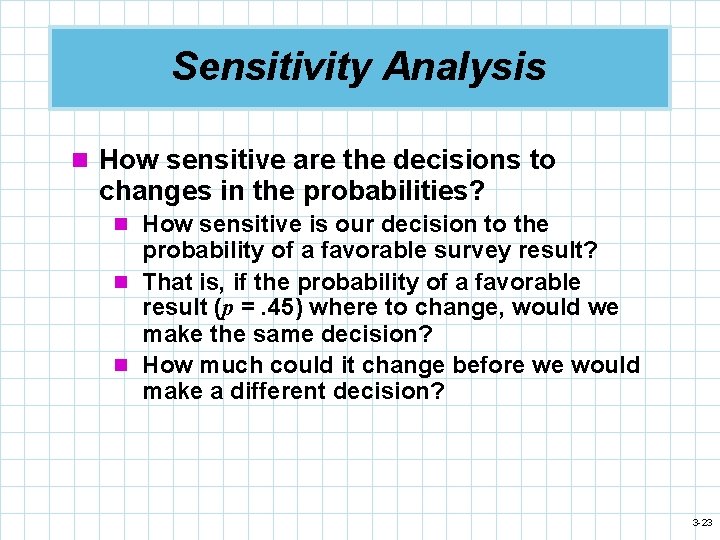
Sensitivity Analysis n How sensitive are the decisions to changes in the probabilities? n How sensitive is our decision to the probability of a favorable survey result? n That is, if the probability of a favorable result (p =. 45) where to change, would we make the same decision? n How much could it change before we would make a different decision? 3 -23
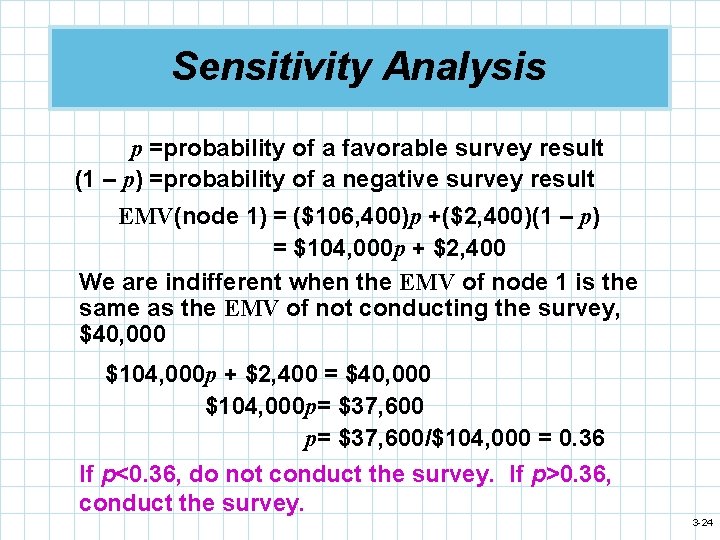
Sensitivity Analysis p =probability of a favorable survey result (1 – p) =probability of a negative survey result EMV(node 1) = ($106, 400)p +($2, 400)(1 – p) = $104, 000 p + $2, 400 We are indifferent when the EMV of node 1 is the same as the EMV of not conducting the survey, $40, 000 $104, 000 p + $2, 400 = $40, 000 $104, 000 p= $37, 600/$104, 000 = 0. 36 If p<0. 36, do not conduct the survey. If p>0. 36, conduct the survey. 3 -24
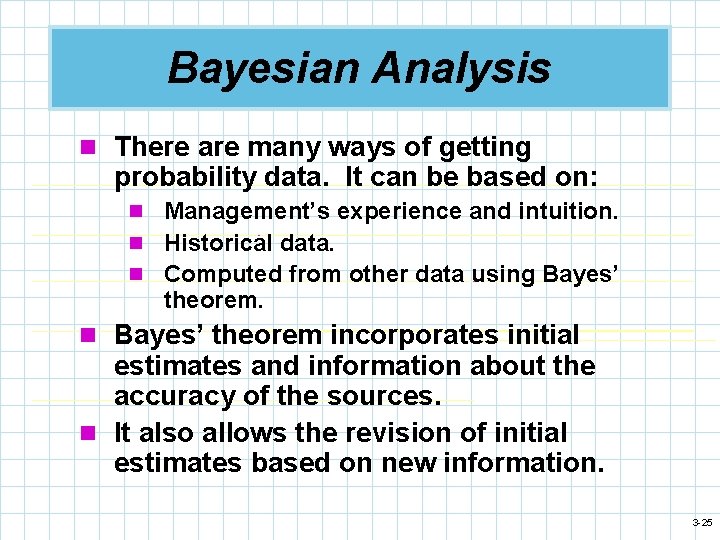
Bayesian Analysis n There are many ways of getting probability data. It can be based on: n Management’s experience and intuition. n Historical data. n Computed from other data using Bayes’ theorem. n Bayes’ theorem incorporates initial estimates and information about the accuracy of the sources. n It also allows the revision of initial estimates based on new information. 3 -25
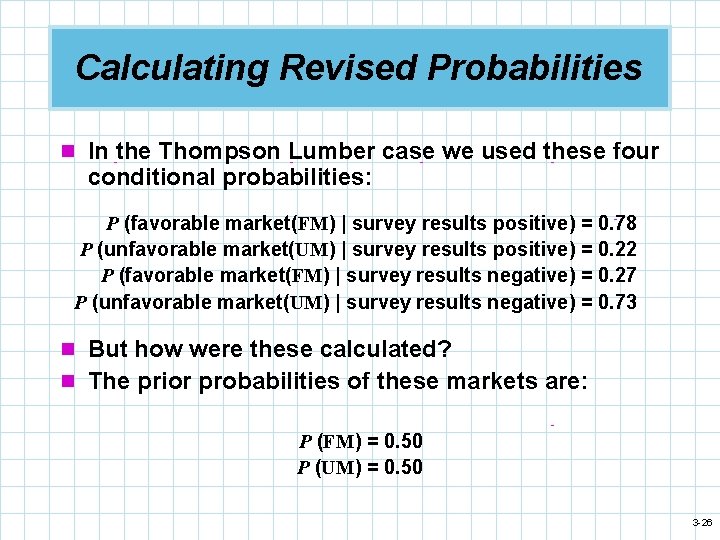
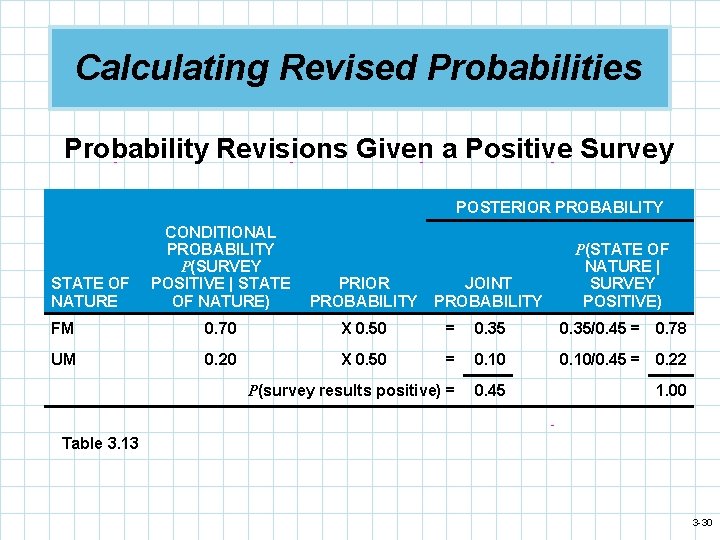
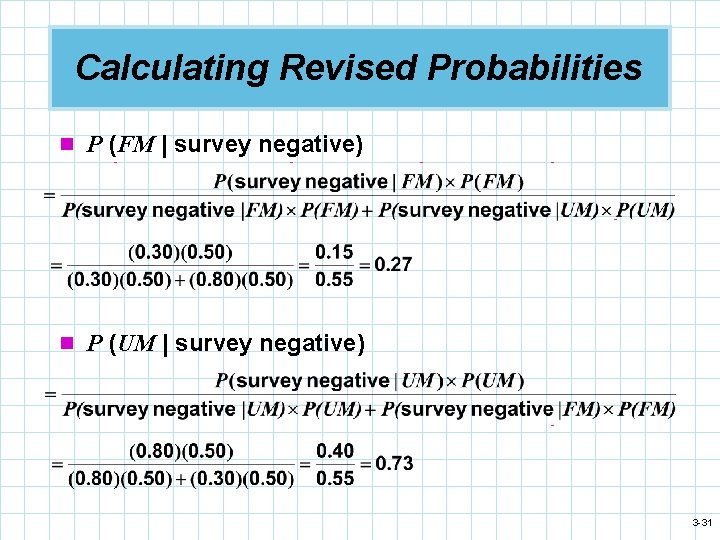
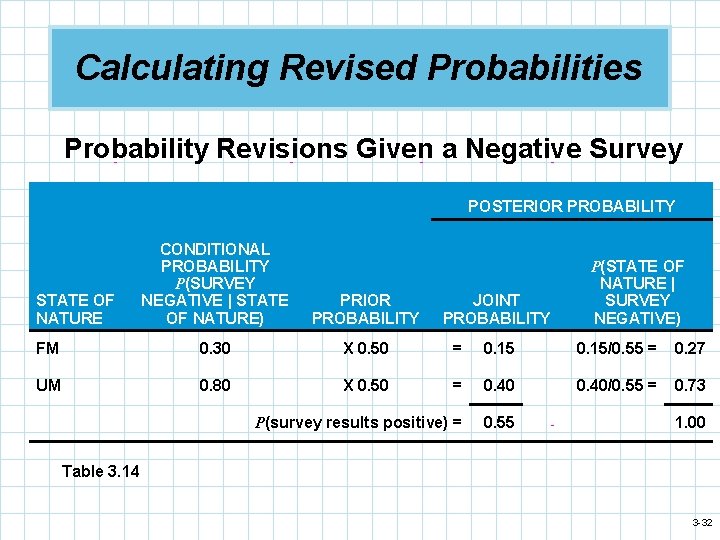
Calculating Revised Probabilities n In the Thompson Lumber case we used these four conditional probabilities: P (favorable market(FM) | survey results positive) = 0. 78 P (unfavorable market(UM) | survey results positive) = 0. 22 P (favorable market(FM) | survey results negative) = 0. 27 P (unfavorable market(UM) | survey results negative) = 0. 73 n But how were these calculated? n The prior probabilities of these markets are: P (FM) = 0. 50 P (UM) = 0. 50 3 -26
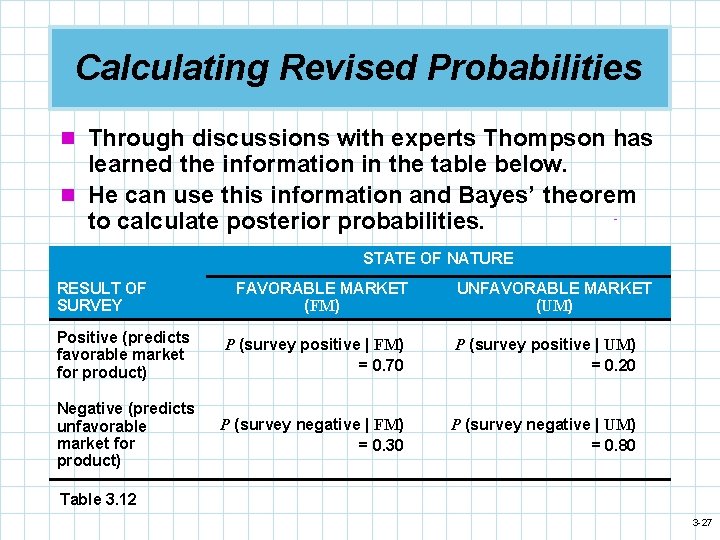
Calculating Revised Probabilities n Through discussions with experts Thompson has learned the information in the table below. n He can use this information and Bayes’ theorem to calculate posterior probabilities. STATE OF NATURE RESULT OF SURVEY FAVORABLE MARKET (FM) UNFAVORABLE MARKET (UM) Positive (predicts favorable market for product) P (survey positive | FM) = 0. 70 P (survey positive | UM) = 0. 20 Negative (predicts unfavorable market for product) P (survey negative | FM) = 0. 30 P (survey negative | UM) = 0. 80 Table 3. 12 3 -27
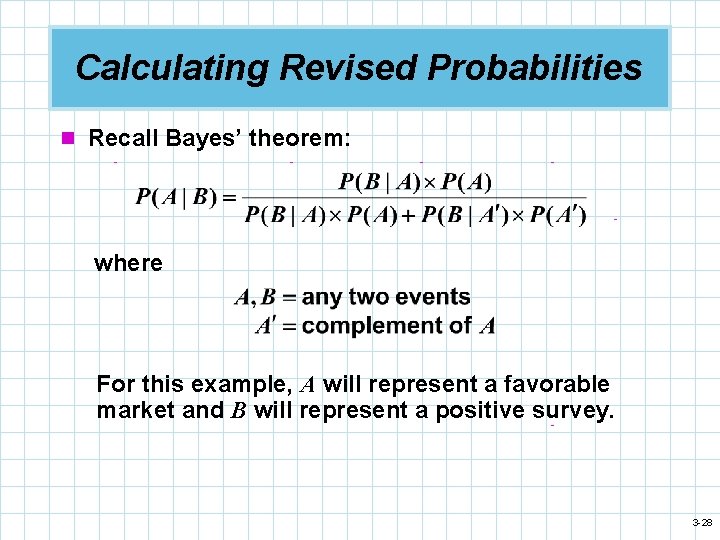
Calculating Revised Probabilities n Recall Bayes’ theorem: where For this example, A will represent a favorable market and B will represent a positive survey. 3 -28
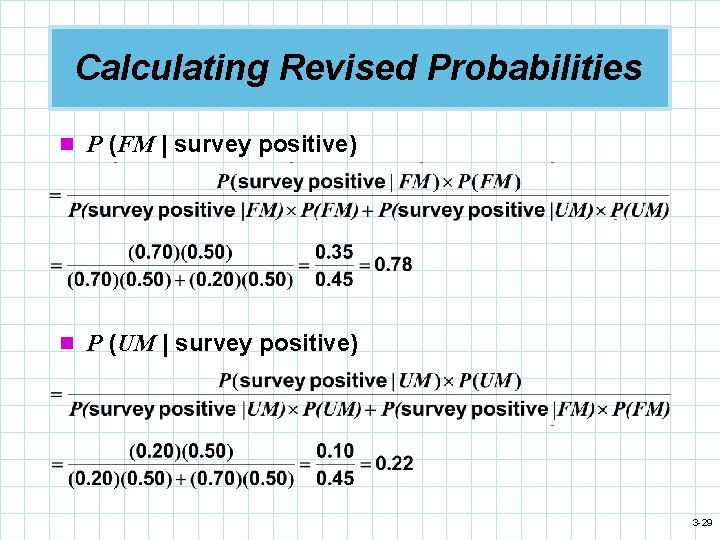
Calculating Revised Probabilities n P (FM | survey positive) n P (UM | survey positive) 3 -29
Calculating Revised Probabilities Probability Revisions Given a Positive Survey POSTERIOR PROBABILITY CONDITIONAL PROBABILITY P(SURVEY POSITIVE | STATE OF NATURE) PRIOR PROBABILITY FM 0. 70 X 0. 50 = 0. 35/0. 45 = 0. 78 UM 0. 20 X 0. 50 = 0. 10/0. 45 = 0. 22 P(survey results positive) = 0. 45 1. 00 STATE OF NATURE JOINT PROBABILITY P(STATE OF NATURE | SURVEY POSITIVE) Table 3. 13 3 -30
Calculating Revised Probabilities n P (FM | survey negative) n P (UM | survey negative) 3 -31
Calculating Revised Probabilities Probability Revisions Given a Negative Survey POSTERIOR PROBABILITY CONDITIONAL PROBABILITY P(SURVEY NEGATIVE | STATE OF NATURE) PRIOR PROBABILITY FM 0. 30 X 0. 50 = 0. 15/0. 55 = 0. 27 UM 0. 80 X 0. 50 = 0. 40/0. 55 = 0. 73 P(survey results positive) = 0. 55 STATE OF NATURE JOINT PROBABILITY P(STATE OF NATURE | SURVEY NEGATIVE) 1. 00 Table 3. 14 3 -32
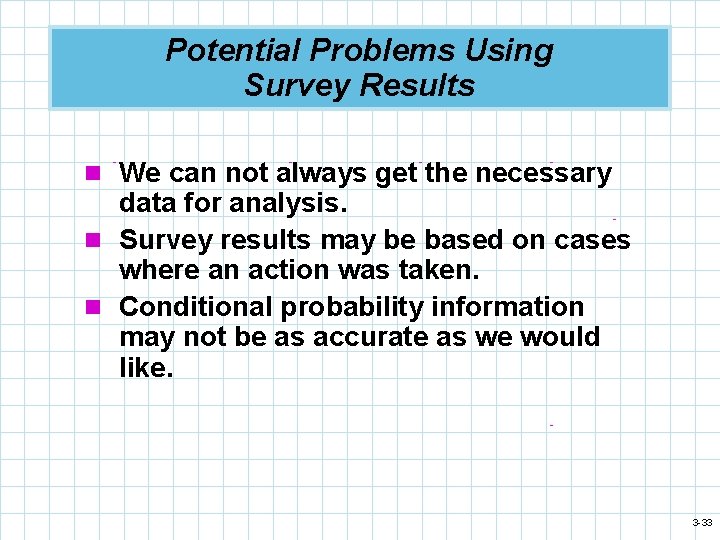
Potential Problems Using Survey Results n We can not always get the necessary data for analysis. n Survey results may be based on cases where an action was taken. n Conditional probability information may not be as accurate as we would like. 3 -33
Utility Theory n Monetary value is not always a true indicator of the overall value of the result of a decision. n The overall value of a decision is called utility. n Economists assume that rational people make decisions to maximize their utility. 3 -34
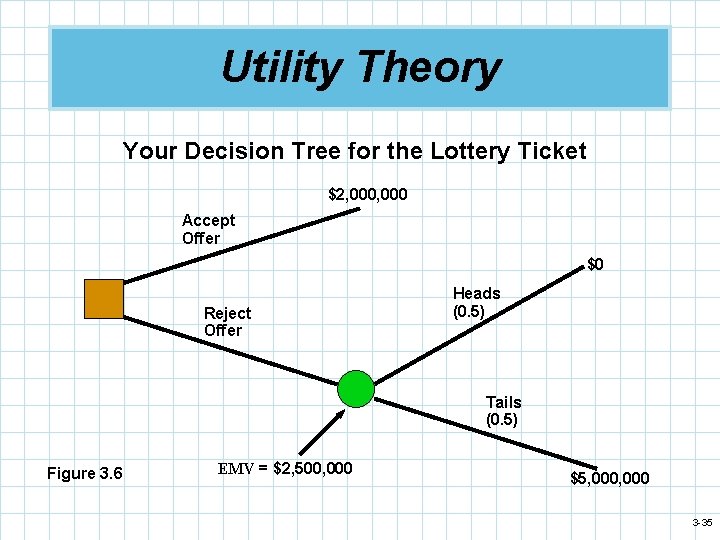
Utility Theory Your Decision Tree for the Lottery Ticket $2, 000 Accept Offer $0 Reject Offer Heads (0. 5) Tails (0. 5) Figure 3. 6 EMV = $2, 500, 000 $5, 000 3 -35
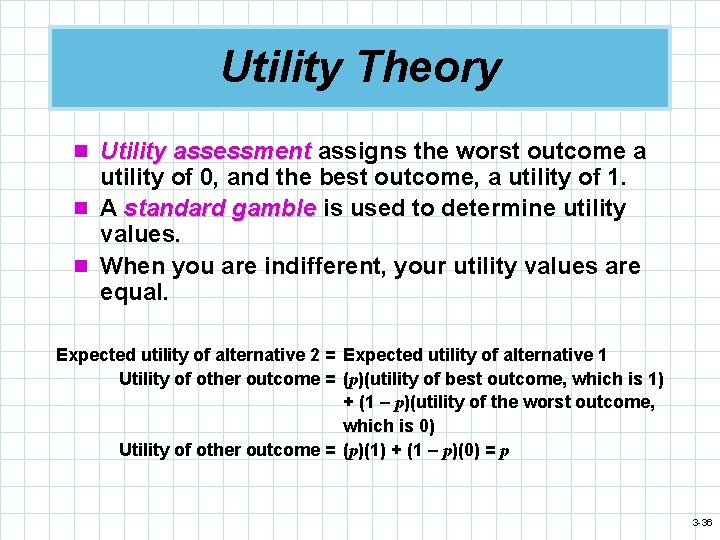
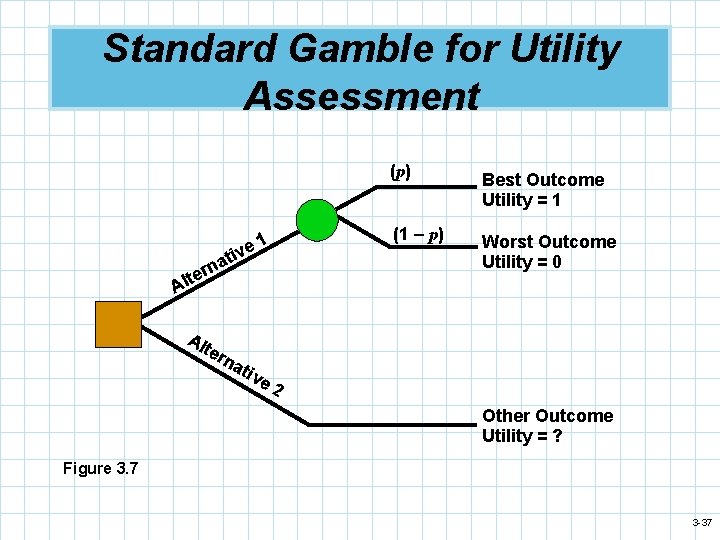
Utility Theory n Utility assessment assigns the worst outcome a utility of 0, and the best outcome, a utility of 1. n A standard gamble is used to determine utility values. n When you are indifferent, your utility values are equal. Expected utility of alternative 2 = Expected utility of alternative 1 Utility of other outcome = (p)(utility of best outcome, which is 1) + (1 – p)(utility of the worst outcome, which is 0) Utility of other outcome = (p)(1) + (1 – p)(0) = p 3 -36
Standard Gamble for Utility Assessment (p) 1 e v i at rn e Alt Al ter na (1 – p) Best Outcome Utility = 1 Worst Outcome Utility = 0 tiv e 2 Other Outcome Utility = ? Figure 3. 7 3 -37
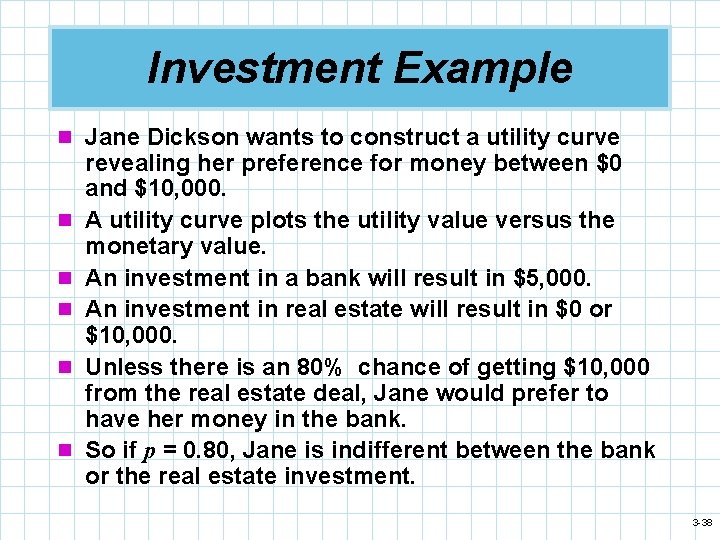
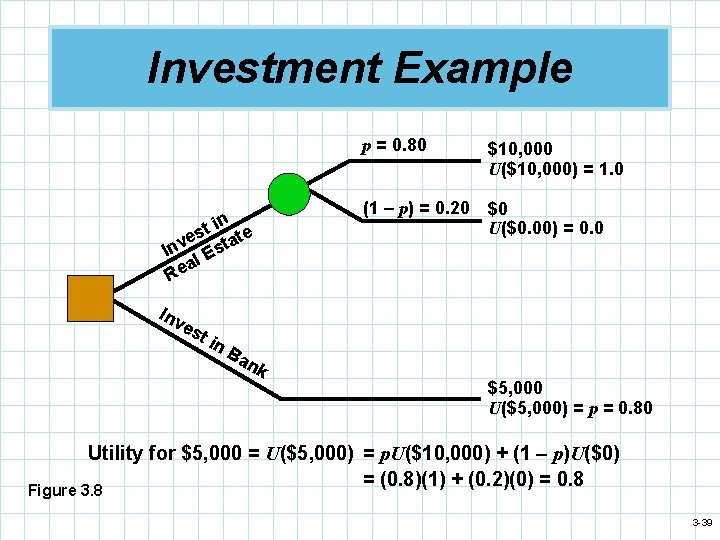
Investment Example n Jane Dickson wants to construct a utility curve n n n revealing her preference for money between $0 and $10, 000. A utility curve plots the utility value versus the monetary value. An investment in a bank will result in $5, 000. An investment in real estate will result in $0 or $10, 000. Unless there is an 80% chance of getting $10, 000 from the real estate deal, Jane would prefer to have her money in the bank. So if p = 0. 80, Jane is indifferent between the bank or the real estate investment. 3 -38
Investment Example t in te s e a Inv l Est a Re Inv es t in Ba nk p = 0. 80 $10, 000 U($10, 000) = 1. 0 (1 – p) = 0. 20 $0 U($0. 00) = 0. 0 $5, 000 U($5, 000) = p = 0. 80 Utility for $5, 000 = U($5, 000) = p. U($10, 000) + (1 – p)U($0) = (0. 8)(1) + (0. 2)(0) = 0. 8 Figure 3. 8 3 -39
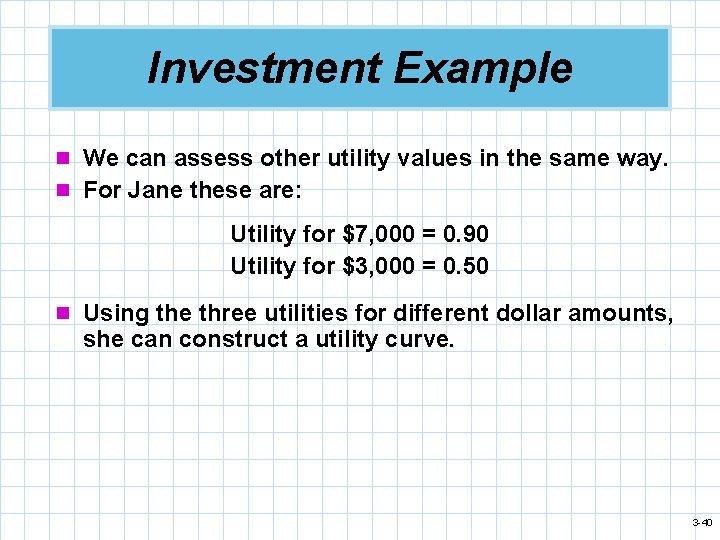
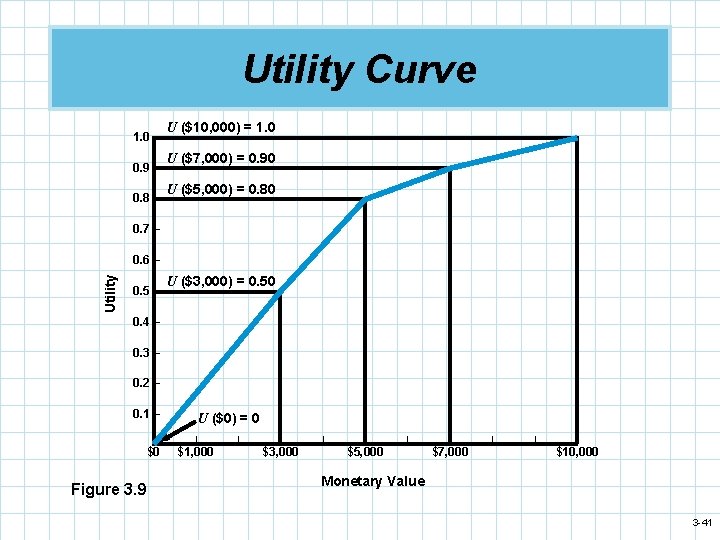
Investment Example n We can assess other utility values in the same way. n For Jane these are: Utility for $7, 000 = 0. 90 Utility for $3, 000 = 0. 50 n Using the three utilities for different dollar amounts, she can construct a utility curve. 3 -40
Utility Curve 1. 0 – 0. 9 – 0. 8 – U ($10, 000) = 1. 0 U ($7, 000) = 0. 90 U ($5, 000) = 0. 80 0. 7 – Utility 0. 6 – 0. 5 – U ($3, 000) = 0. 50 0. 4 – 0. 3 – 0. 2 – 0. 1 – Figure 3. 9 U ($0) = 0 | | $0 $1, 000 | | $3, 000 | | | $5, 000 | $7, 000 | | | $10, 000 Monetary Value 3 -41
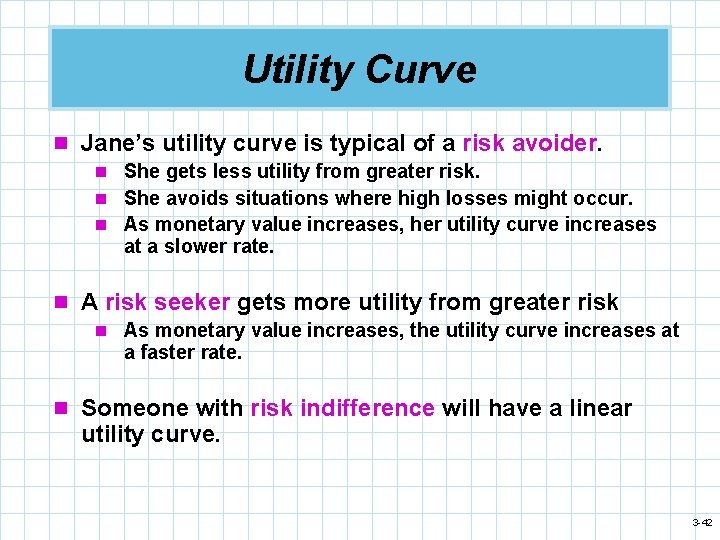
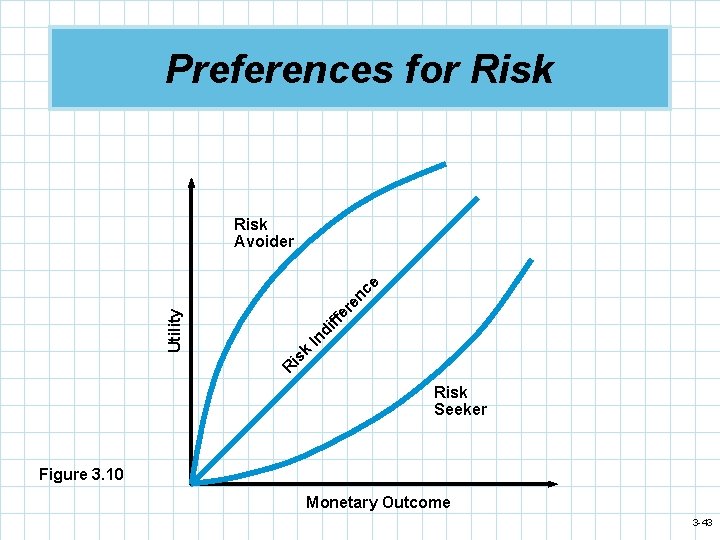
Utility Curve n Jane’s utility curve is typical of a risk avoider. n She gets less utility from greater risk. n She avoids situations where high losses might occur. n As monetary value increases, her utility curve increases at a slower rate. n A risk seeker gets more utility from greater risk n As monetary value increases, the utility curve increases at a faster rate. n Someone with risk indifference will have a linear utility curve. 3 -42
Preferences for Risk ffe re nc e di In k R is Utility Risk Avoider Risk Seeker Figure 3. 10 Monetary Outcome 3 -43
Utility as a Decision-Making Criteria n Once a utility curve has been developed it can be used in making decisions. n This replaces monetary outcomes with utility values. n The expected utility is computed instead of the EMV. 3 -44
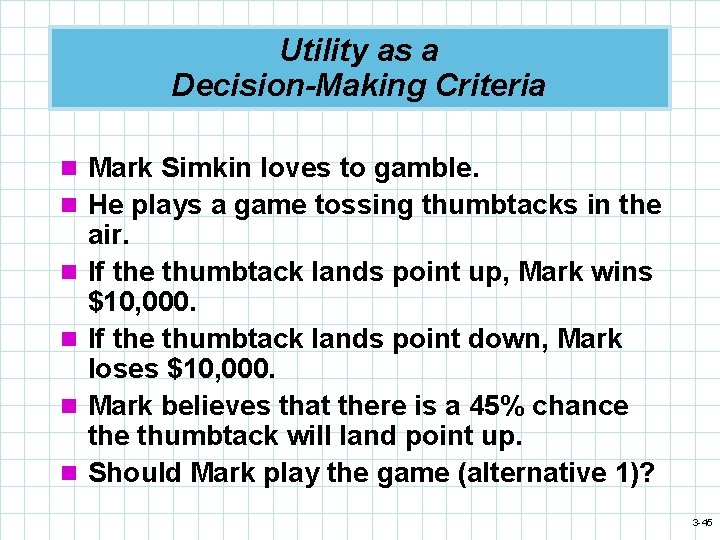
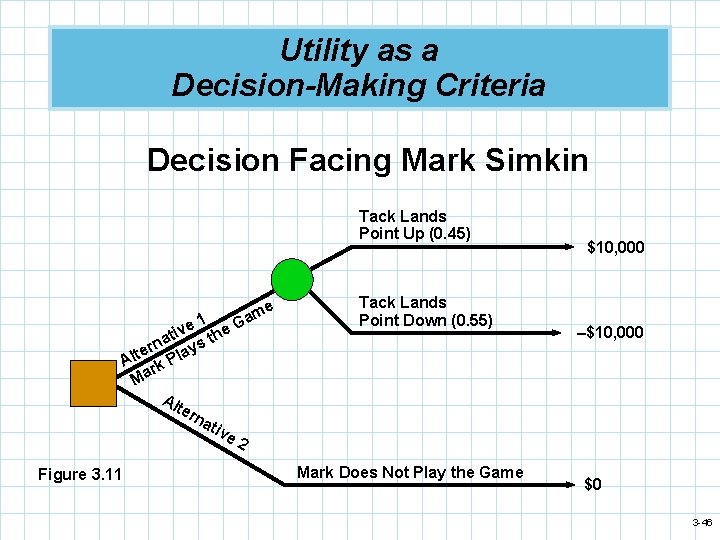
Utility as a Decision-Making Criteria n Mark Simkin loves to gamble. n He plays a game tossing thumbtacks in the n n air. If the thumbtack lands point up, Mark wins $10, 000. If the thumbtack lands point down, Mark loses $10, 000. Mark believes that there is a 45% chance thumbtack will land point up. Should Mark play the game (alternative 1)? 3 -45
Utility as a Decision-Making Criteria Decision Facing Mark Simkin Tack Lands Point Up (0. 45) e 1 e v i at s th n r e ay Alt rk Pl Ma Al Figure 3. 11 ter na tiv me a G Tack Lands Point Down (0. 55) $10, 000 –$10, 000 e 2 Mark Does Not Play the Game $0 3 -46
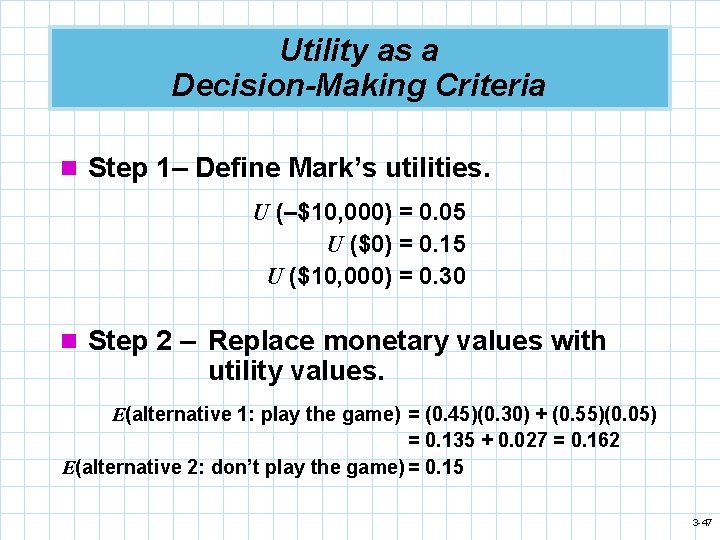
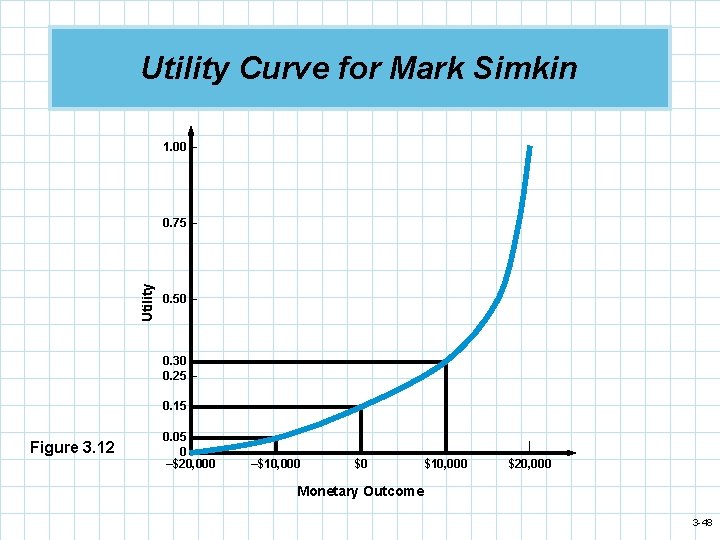
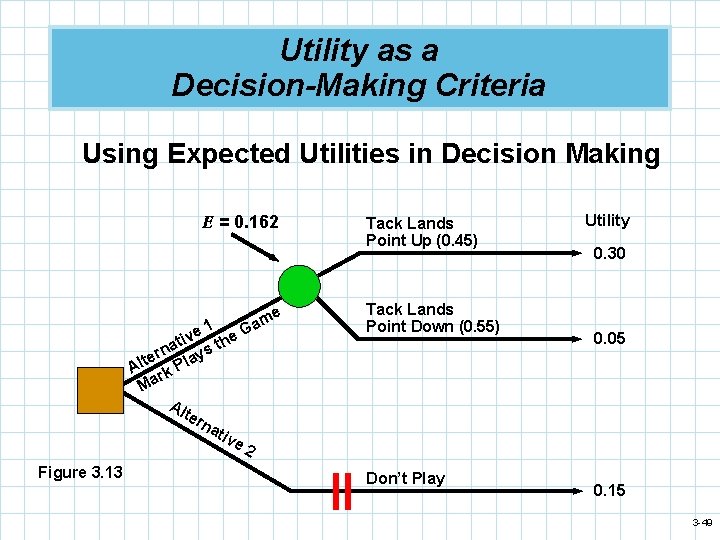
Utility as a Decision-Making Criteria n Step 1– Define Mark’s utilities. U (–$10, 000) = 0. 05 U ($0) = 0. 15 U ($10, 000) = 0. 30 n Step 2 – Replace monetary values with utility values. E(alternative 1: play the game) = (0. 45)(0. 30) + (0. 55)(0. 05) = 0. 135 + 0. 027 = 0. 162 E(alternative 2: don’t play the game) = 0. 15 3 -47
Utility Curve for Mark Simkin 1. 00 – Utility 0. 75 – 0. 50 – 0. 30 – 0. 25 – 0. 15 – Figure 3. 12 0. 05 – 0 |– –$20, 000 | –$10, 000 | $20, 000 Monetary Outcome 3 -48
Utility as a Decision-Making Criteria Using Expected Utilities in Decision Making E = 0. 162 e am 1 G e v ti he t a ern lays t l A rk P Ma Al Figure 3. 13 ter na tiv Tack Lands Point Up (0. 45) Tack Lands Point Down (0. 55) Utility 0. 30 0. 05 e 2 Don’t Play 0. 15 3 -49
Copyright All rights reserved. No part of this publication may be reproduced, stored in a retrieval system, or transmitted, in any form or by any means, electronic, mechanical, photocopying, recording, or otherwise, without the prior written permission of the publisher. Printed in the United States of America. 3 -50