Lecture 4 Fossil Fuels Ch 2 Dr Harris
 Dr. Harris Phys 105 2/6/13")


 Use Gases C 1 -C")


 of")
 Russia 1680 Iran 940 Saudi")


 % of World Total Years")
")
- Slides: 24
Lecture 4: Fossil Fuels (Ch 2) Dr. Harris Phys 105 2/6/13
Intro • We will further explore the fossil fuels • History of use and resource development – Advancements • Future Projections and U. S. Resources
Petroleum • Included in the definition of petroleum are gasoline, kerosene, heating oil, diesel, and liquid natural gas (i. e. propane and butane) • During photosynthesis, plants convert CO 2 from the air into carbohydrates – Carbohydrate: Cn(H 2 O)n • ex. glucose C 6 H 12 O 6 --> C 6(H 2 O)6 • As previously discussed, when prehistoric plants died and became buried, the conditions were anaerobic. – This condition, in conjunction with high temperatures, pressures and bacterial processes caused the displacement of oxygen from the plant sugars, leaving only hydrocarbons • Hydrocarbons: Cn. H 2 n+2 – ex. Propane C 3 H 8, Butane (C 4 H 10), Octane (C 8 H 18)
Exploration of Petroleum • Underground, oil and natural gas are found dispersed throughout porous formations. • These wells are found by monitoring shock waves from explosions or vibrating devices sent down into the Earth. When the sound waves strike an interface, they bounce back and are read by a geophone. • From this data, geologists can determine the likelihood of oil, but the only real proof is to drill. Only 1 in 9 exploratory drilling results in oil discovery.
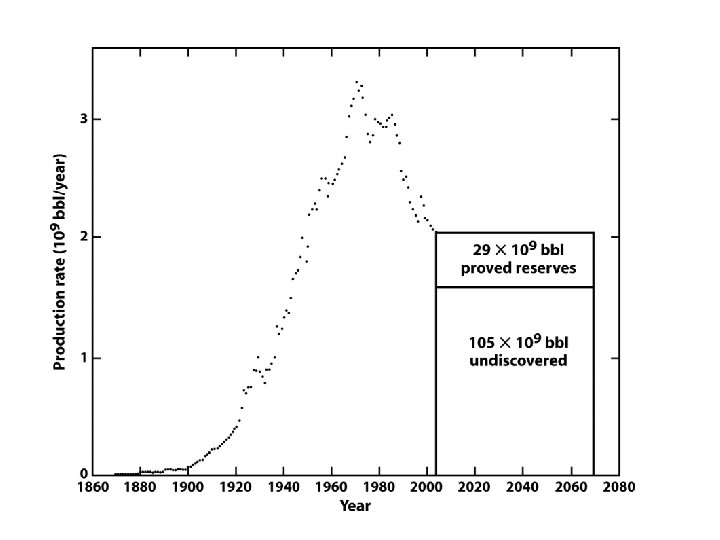
History of Petroleum Production • The first US oil wells were found in Pennsylvania in 1859. • The main problem was finding containers to house the oil, as the containers were more valuable than the oil itself • Refining of this “rock oil” produced kerosine. • By 1909, wells opened in Ohio, Indiana, California and Texas. The US was producing 500, 000 barrels a day (more than the rest of the world combined). • With the advent of electric lighting, a decline in the oil business was projected – However, automobiles were becoming more and more accessible, replacing horses. Demand for petroleum skyrocketed.
Decline in Production • The US now imports well over 50% of the oil it consumes • Drilling has drastically reduced because most of the “worthwhile” wells have been found – ex. In 2004, the US drilled 6600 wells. In 1981, there were 44, 000 – There will always be some oil left underground, but some of it is simply too costly to extract • In addition, the cost to explore and develop wells as also shot up drastically – ex. In 1999, $5 per barrel were spent on development and exploration. In 2004, it was $11/bbl.
Primary, Secondary and Tertiary Recovery • There is some optimism with regard to oil reserves. Geologists believe that after a well stops producing oil, as much as 70% of the well’s actual content is left behind in the ground – In the primary recovery, oil comes to the surface naturally, or via pumping – In secondary recovery, water is pumped into the well to force more oil upward • Tertiary (more commonly known as “enhanced”) recovery techniques are now being tested to extract this hypothetical 70% – Based on overcoming two effects: surface tension and viscosity
Enhanced Recovery: Overcoming Surface Tension • Surface tension describes the tendency of a surface of a liquid to resist force. This is caused by attractive forces between the molecules of a liquid. • ex. Water beads. • This can cause oil to become locked within the pores of rocks. • Surfactants can be injected into the rocks and the rock can be flooded with a viscous water solution
Enhanced Recovery: Overcoming Viscosity • If trapped oil is too viscous, this will also prevent flow • The viscosity of oil can be lowered by saturating it with CO 2 • Steam can also be injected into the well, which heats the oil and thereby reduces its viscosity
Economic and Environmental Consequences of Enhanced Recovery • Enhanced recovery can cost oil companies as much as $20 per barrel of oil recovered • Additionally, the process can produce large volumes of toxic, highly salty, and sometimes radioactive water. – This can be especially harmful to drinking water – Enhance recovery is well regulated by the EPA under the Safe Drinking Water Act
Gas Costs In the U. S. • Despite our massive use, gasoline is cheaper in the U. S. than in any other industrialized nation. Why? • Competition in the marketplace – There is still tremendous production in the OPEC countries as well as Russia – Because so many countries rely on oil exports, competition has kept prices low – Even when OPEC tries to limit production to drive prices, it has always failed • Taxes – Tax on gasoline in the U. S. is as much as 6. 5 times lower than other countries • Average gas tax in U. S. is $0. 488/gal • In the U. K, gas tax is $3. 43/gallon
Refining • Crude petroleum taken directly from the ground is a mixture of hundreds of hydrocarbons and impurities like sulfur • Raw crude is not usable • Crude petroleum needs to be treated. The first step is a process called fractional distillation. • All of the crude is boiled. Smaller molecules boil first. As the different hydrocarbon vapors condense, they are collected at various points along the tower. • Simple hydrocarbons like methane and ethane do not condense
Petroleum Products Fraction Molecular size Boiling Point (o. C) Use Gases C 1 -C 4 -164 to 30 Fuels Gasoline C 5 -C 12 30 -200 Motor Fuel Kerosine C 12 -C 16 175 -275 Diesel and jet fuel Greases C 16 -C 20 Solid Lubricants Paraffin C 20 and up 52 -57 Candles Tar Very high No boil Roofing, paving
Natural Gas • Natural gas has become a favorite fossil fuel in recent years. Many are optimistic that it can fulfill our energy needs • Natural gas is mostly methane (CH 4) with some ethane (C 2 H 6) • Our natural gas use will likely increases because: – The technology for exploration and production has improved – Fossil fuels release less CO 2 into the atmosphere than coal or oil – Research has shown promise in using natural gas as motor fuel – Natural gas is cheaper than oil and coal-powered electric • Unlike electricity which is measured in k. Wh, natural gas use is measured by volume, typically per 1000 ft 3
Comparing to Electric • The average cost of natural gas in the US is $10 per 1000 ft 3 – The amount of heat energy in 1000 ft 3 of natural gas is 1. 035 x 106 BTU – The heat energy per k. Wh of electricity is 3413 BTU and the average price in SC is $0. 09 per k. Wh • Relative costs per 106 BTU: – Natural gas: $9. 66 – Electricity: $ 26. 37 • So, for home heating, ovens, dryers, and other warming devices natural gas is a better choice.
Expanded Use • The U. S. uses about 23 trillion ft 3 (tcf) of natural gas per year • Newer plants are using natural gas in the boilers rather than coal – Newer turbines are also being developed that have 45% efficiency (35% for coal power) – NG plants cost half as much as coal plants – No sulfur contamination – Our natural gas production is almost entirely domestic • The major hindrance of natural gas use is the lack of pipeline systems to bring fuel to the consumers. In many countries, the pipelines are not economically feasible and may never be built.
Major Natural Gas Proved Reserves Country Proved Reserves (tcf) Russia 1680 Iran 940 Saudi Arabia 231 U. S. 189 Nigeria 159 Venezuela 148 Iraq 110
New Developments • There have been some very encouraging developments in the search for natural gas – Coalbed Methane • Coal and methane were formed at the same time. Because coal is so porous, it absorbed a lot of methane. As much as 800 ft 3 of methane can be stored per ton of coal – It is estimated that 700 tcf of natural gas exist in the U. S as coalbed methane – Clathrate Hydrates • Ice-like structures in which organic gases (ex. methane) are trapped in the center. These exist in enormous quantity at the bottom of the ocean – As much as 113000 tcf of methane may exist on the ocean floor
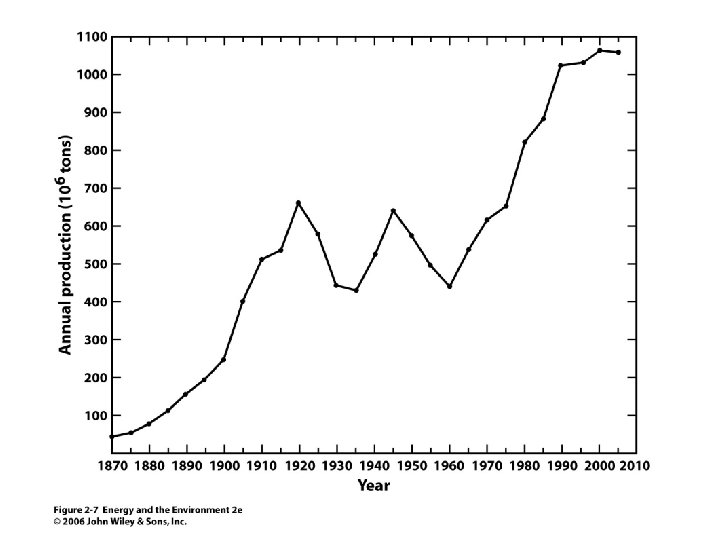
Coal • Following prehistoric plant death, the first stage of coal formation produces peat (decayed plant matter) • Heat and compression of peat yields different forms of coal, each one distinguished by age and carbon content. Peat Increasing pressure and time Peat Lignite Sub-bituminous Bituminous Anthracite
Coal Rank Source %Carbon %Sulfur BTU/lb Anthracite Pennsylvania 88 0. 9 13, 300 Bituminous Michigan 50 1. 2 11, 780 Subbituminous Wyoming 46 0. 6 10, 750 North Dakota 27 0. 6 6, 750 Lignite • Minable coal in the US is 71% bituminous and subbituminous. 28% is lignite, and 1% antracite • The older the coal, the greater the carbon content. Greater carbon content = higher thermal energy output • 90% of all coal used in the US was consumed by electric utilities
Proved Reserves Location Amount of proved reserve (109 tons) % of World Total Years remaining for proved reserve for domestic use US 250 29 260 Russia 230 17 >500 Europe 138 16 300 China 115 13 70 Australia 82 8. 3 240 Africa 55 5. 6 230 • The actual coal resource of the US is approximately six times the proved reserves, but it must be found.
Energy Distribution in Qbtu (1014 BTU)