Lecture 30 Stochastic Oscillator Stochastic Oscillator Developed by

Lecture 30 Stochastic Oscillator

Stochastic Oscillator • Developed by George C. Lane in the late 1950 s, the Stochastic Oscillator is a momentum indicator • It shows the location of the current close relative to the high/low range over a set number of periods • The idea behind this indicator is that prices tend to close near their past highs in bull market, and near their lows in bear markets. • This is why investor should stop buying when prices reach their previous high or stop selling when prices drop to their previous lows

• The Stochastic Oscillator is displayed as two lines. The main line is called %K. The second line, called %D, is a Moving Average of %K. The %K line is usually displayed as a solid line and the %D line is usually displayed as a dotted line.

Calculation
 was in the 57")
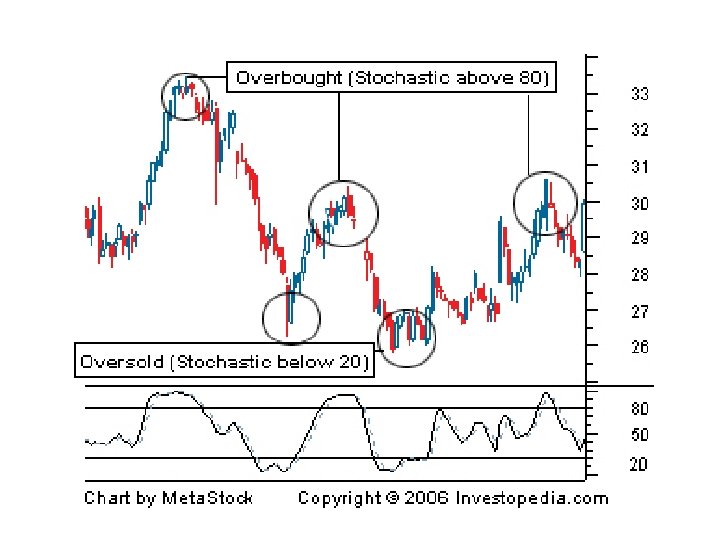
• %K tells us that the close (115. 38) was in the 57 th percentile of the high/low range, or just above the mid-point. • Because %K is a percentage or ratio, it will fluctuate between 0 and 100 • Readings below 20 are considered oversold and readings above 80 are considered overbought

3 points average A shop records it’s sales figures for the first 6 months of the year: • January = £ 936 • February = £ 939 • March = £ 903 • April = £ 870 • May = £ 882 • June = £ 810 • Calculate all of the 3 point moving averages and describe the trend: • 1 st 3 point moving average: • (936 + 939 + 903) ÷ 3 = £ 926 • The 2 nd 3 point moving average is: • (939 + 903 + 870) ÷ 3 = £ 904 • The 3 rd 3 point moving average is: • (903 + 870 + 882) ÷ 3 = £ 885 • The 4 th 3 point moving average is: • (870 + 882 + 810) ÷ 3 = £ 854

• So the 3 point moving averages are £ 926, £ 904, £ 885 and £ 854. Since the moving averages are decreasing then the sales figures are going down as the months go by.


- Slides: 14