
Lecture 3 Efficiency selectivity and resolution AM 0925




- Slides: 61
Lecture 3 Efficiency, selectivity and resolution AM 0925 - Quality parameters and optimization in chromatography
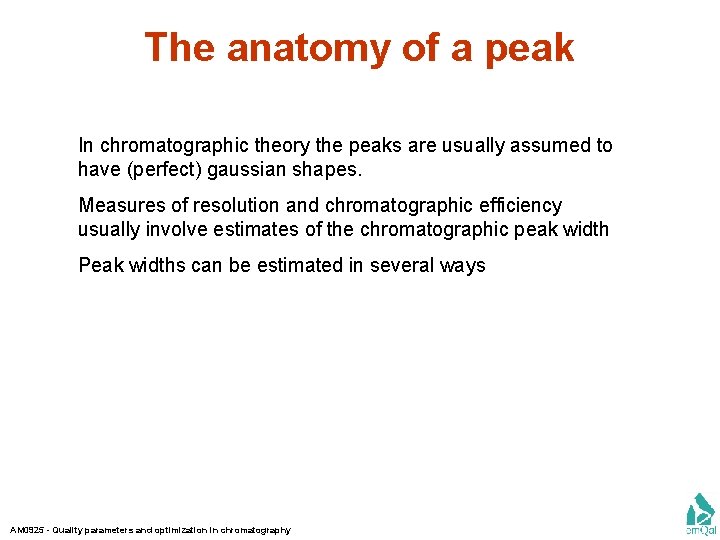
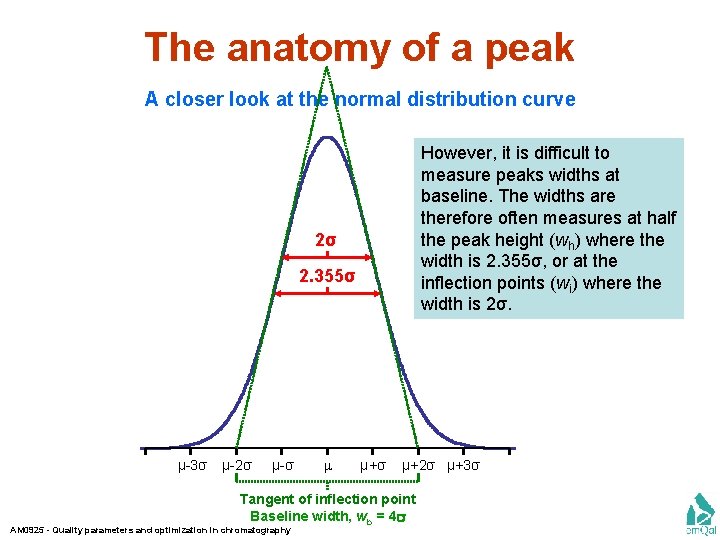
The anatomy of a peak In chromatographic theory the peaks are usually assumed to have (perfect) gaussian shapes. Measures of resolution and chromatographic efficiency usually involve estimates of the chromatographic peak width Peak widths can be estimated in several ways AM 0925 - Quality parameters and optimization in chromatography
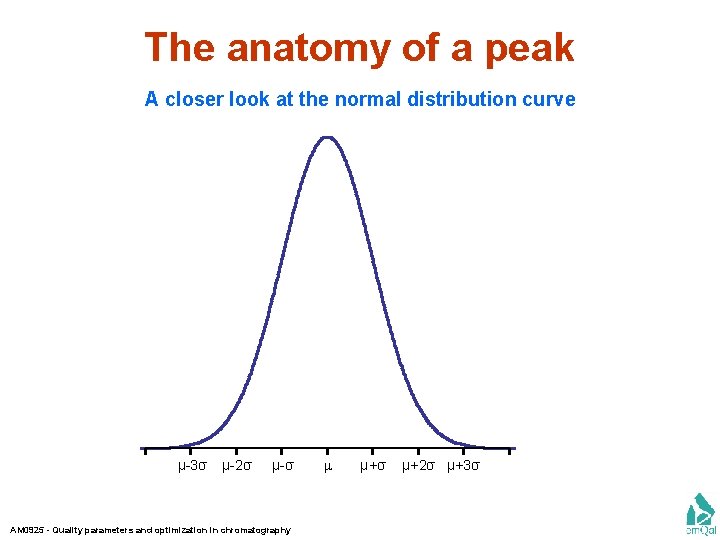
The anatomy of a peak A closer look at the normal distribution curve μ-3σ μ-2σ μ-σ AM 0925 - Quality parameters and optimization in chromatography μ μ+σ μ+2σ μ+3σ
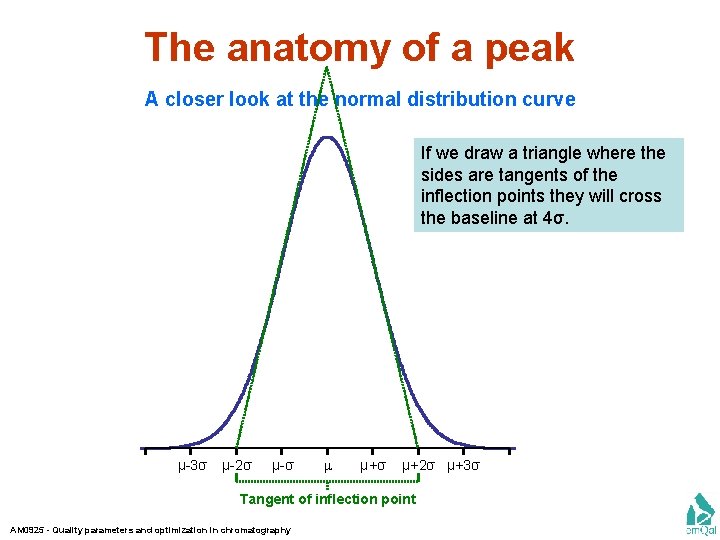
The anatomy of a peak A closer look at the normal distribution curve If we draw a triangle where the sides are tangents of the inflection points they will cross the baseline at 4σ. μ-3σ μ-2σ μ-σ μ μ+σ μ+2σ μ+3σ Tangent of inflection point AM 0925 - Quality parameters and optimization in chromatography
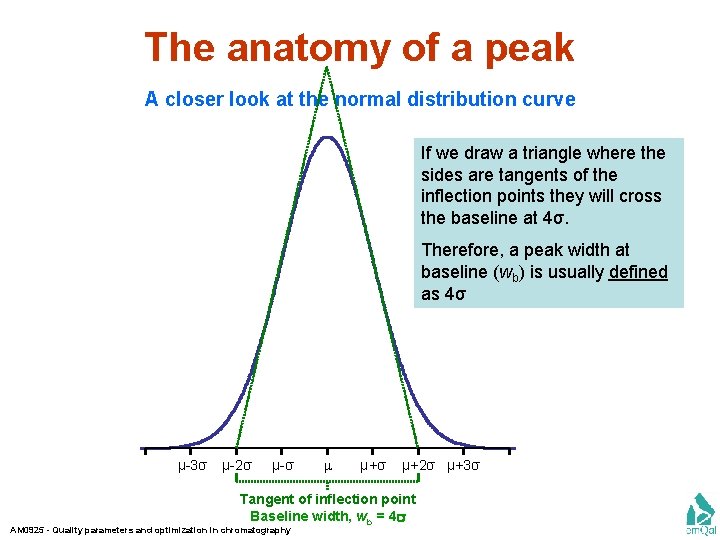
The anatomy of a peak A closer look at the normal distribution curve If we draw a triangle where the sides are tangents of the inflection points they will cross the baseline at 4σ. Therefore, a peak width at baseline (wb) is usually defined as 4σ μ-3σ μ-2σ μ-σ μ μ+σ μ+2σ μ+3σ Tangent of inflection point Baseline width, wb = 4 AM 0925 - Quality parameters and optimization in chromatography
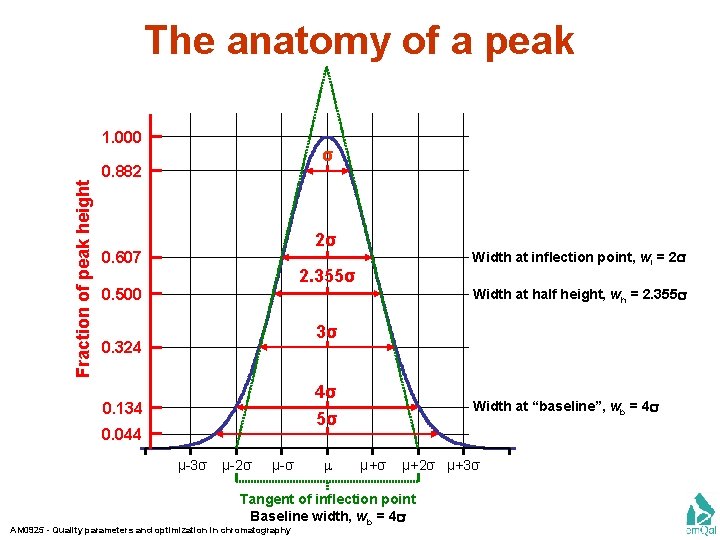
The anatomy of a peak A closer look at the normal distribution curve However, it is difficult to measure peaks widths at baseline. The widths are therefore often measures at half the peak height (wh) where the width is 2. 355σ, or at the inflection points (wi) where the width is 2σ. 2σ 2. 355σ μ-3σ μ-2σ μ-σ μ μ+σ μ+2σ μ+3σ Tangent of inflection point Baseline width, wb = 4 AM 0925 - Quality parameters and optimization in chromatography
The anatomy of a peak Fraction of peak height 1. 000 σ 0. 882 2σ 0. 607 Width at inflection point, wi = 2 2. 355σ 0. 500 Width at half height, wh = 2. 355 3σ 0. 324 4σ 5σ 0. 134 0. 044 μ-3σ μ-2σ μ-σ μ Width at “baseline”, wb = 4 μ+σ μ+2σ μ+3σ Tangent of inflection point Baseline width, wb = 4 AM 0925 - Quality parameters and optimization in chromatography
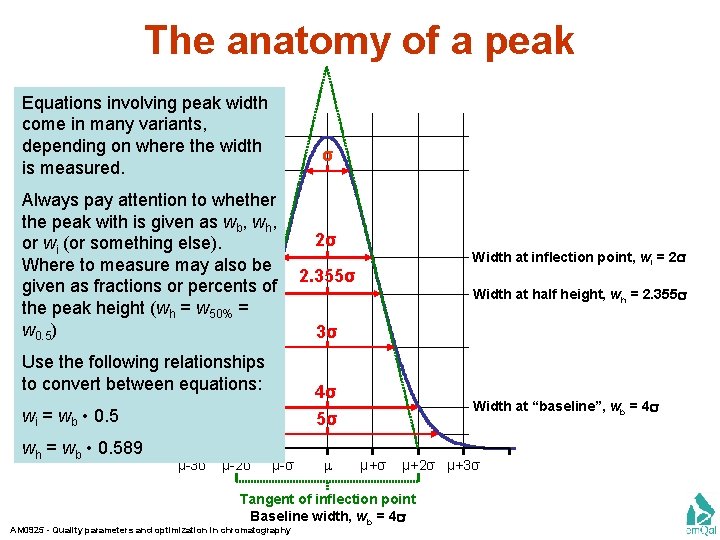
The anatomy of a peak Fraction of peak height Equations involving peak width come in many variants, depending 1. 000 on where the width is measured. 0. 882 σ Always pay attention to whether the peak with is given as wb, wh, or wi (or something else). 0. 607 Where to measure may also be given as fractions or percents of 0. 500 the peak height (wh = w 50% = w 0. 5) 0. 324 Use the following relationships to convert between equations: 0. 044 μ-3σ μ-2σ Width at inflection point, wi = 2 2. 355σ Width at half height, wh = 2. 355 3σ 4σ 5σ 0. 134 wi = wb • 0. 5 wh = wb • 0. 589 2σ μ-σ μ Width at “baseline”, wb = 4 μ+σ μ+2σ μ+3σ Tangent of inflection point Baseline width, wb = 4 AM 0925 - Quality parameters and optimization in chromatography
Chromatographic resolution AM 0925 - Quality parameters and optimization in chromatography
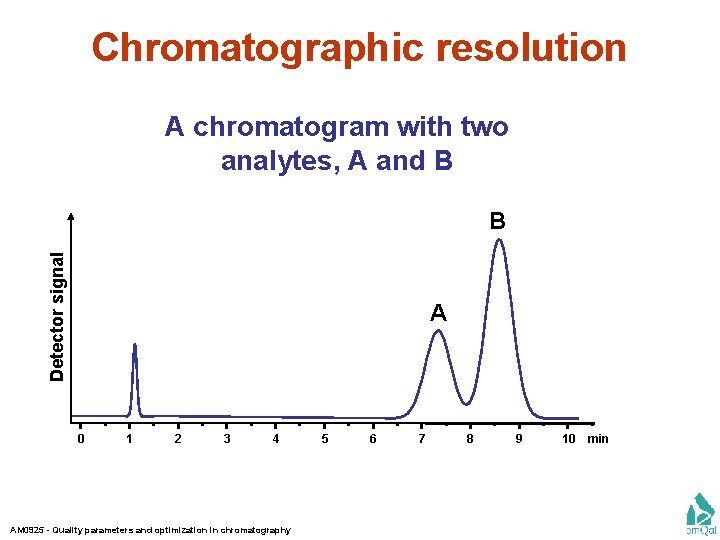
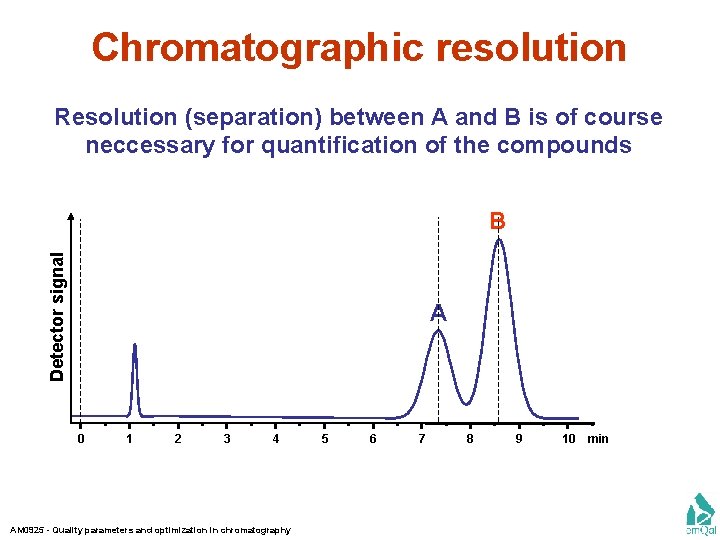
Chromatographic resolution A chromatogram with two analytes, A and B Detector signal B A 0 1 2 3 4 AM 0925 - Quality parameters and optimization in chromatography 5 6 7 8 9 10 min
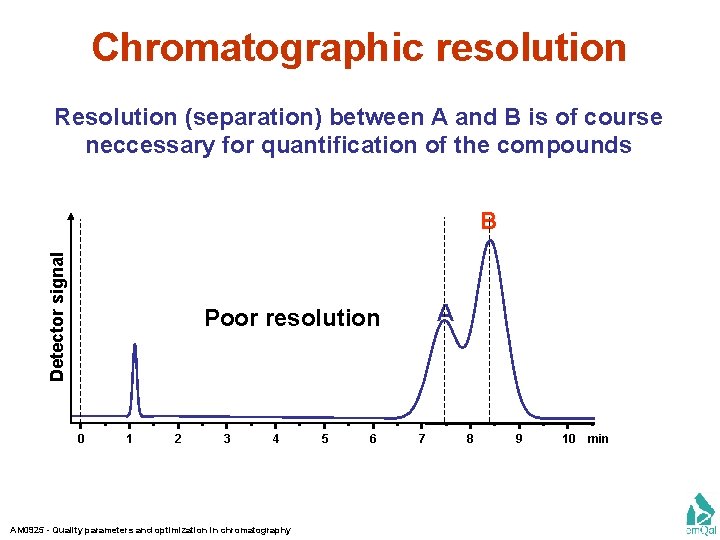
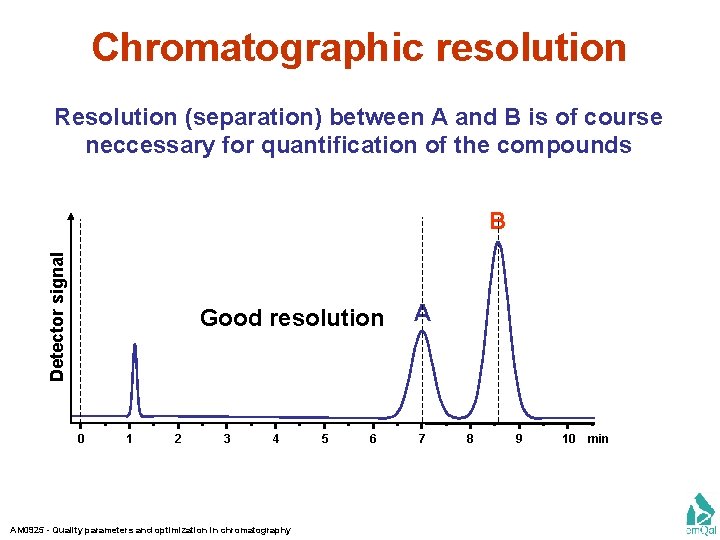
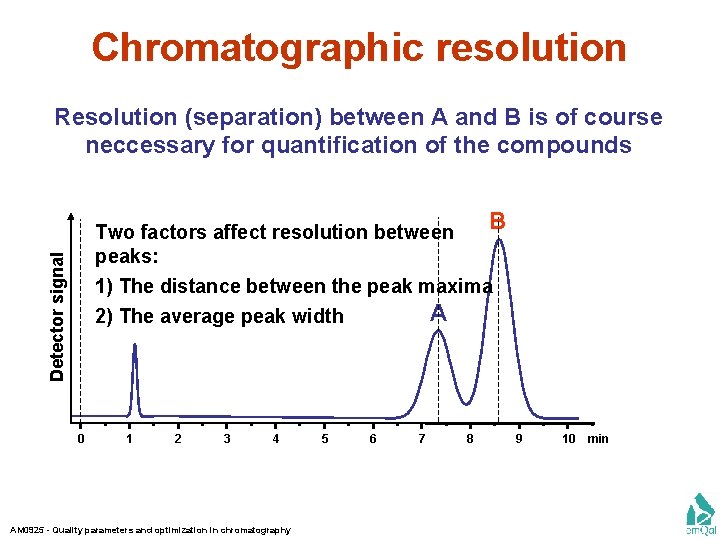
Chromatographic resolution Resolution (separation) between A and B is of course neccessary for quantification of the compounds Detector signal B A 0 1 2 3 4 AM 0925 - Quality parameters and optimization in chromatography 5 6 7 8 9 10 min
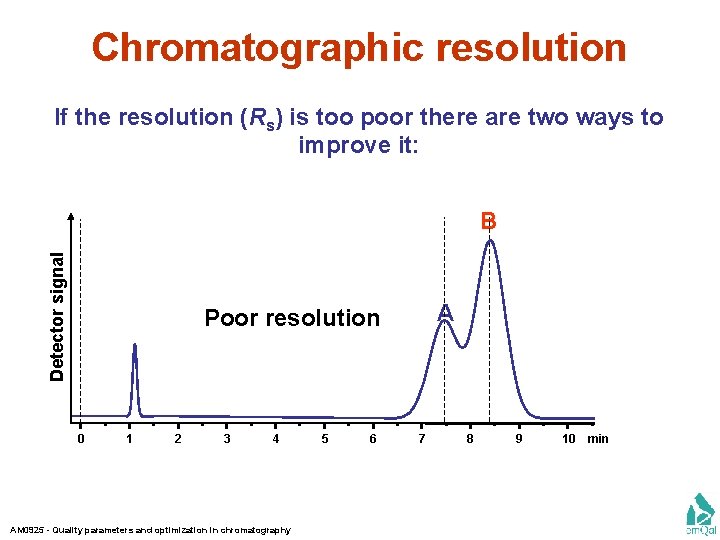
Chromatographic resolution Resolution (separation) between A and B is of course neccessary for quantification of the compounds Detector signal B A Poor resolution 0 1 2 3 4 AM 0925 - Quality parameters and optimization in chromatography 5 6 7 8 9 10 min
Chromatographic resolution Resolution (separation) between A and B is of course neccessary for quantification of the compounds Detector signal B Good resolution 0 1 2 3 4 AM 0925 - Quality parameters and optimization in chromatography 5 6 A 7 8 9 10 min
Chromatographic resolution Resolution (separation) between A and B is of course neccessary for quantification of the compounds B Detector signal Two factors affect resolution between peaks: 1) The distance between the peak maxima A 2) The average peak width 0 1 2 3 4 AM 0925 - Quality parameters and optimization in chromatography 5 6 7 8 9 10 min
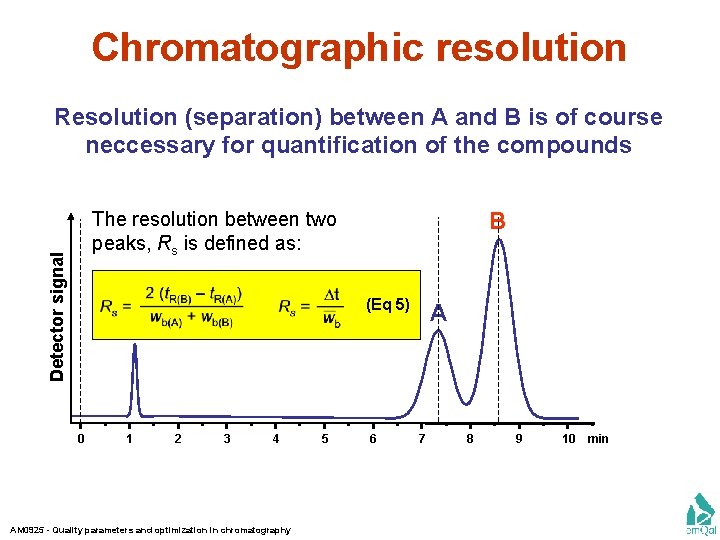
Chromatographic resolution Resolution (separation) between A and B is of course neccessary for quantification of the compounds B Detector signal The resolution between two peaks, Rs is defined as: (Eq 5) 0 1 2 3 4 AM 0925 - Quality parameters and optimization in chromatography 5 6 A 7 8 9 10 min
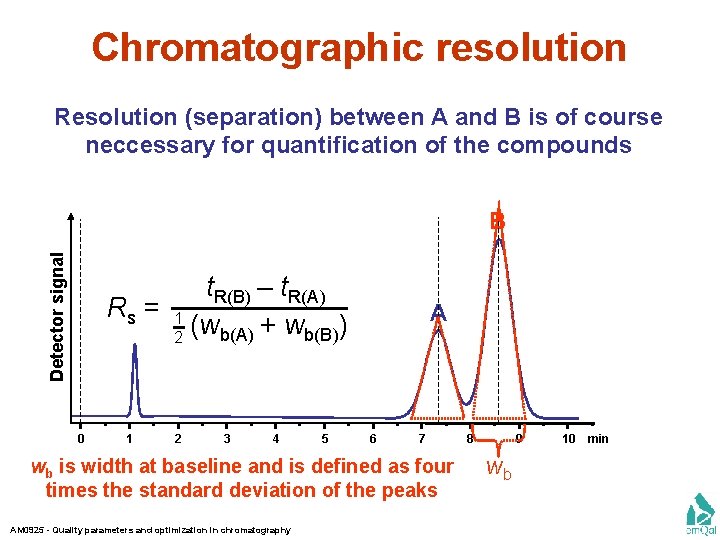
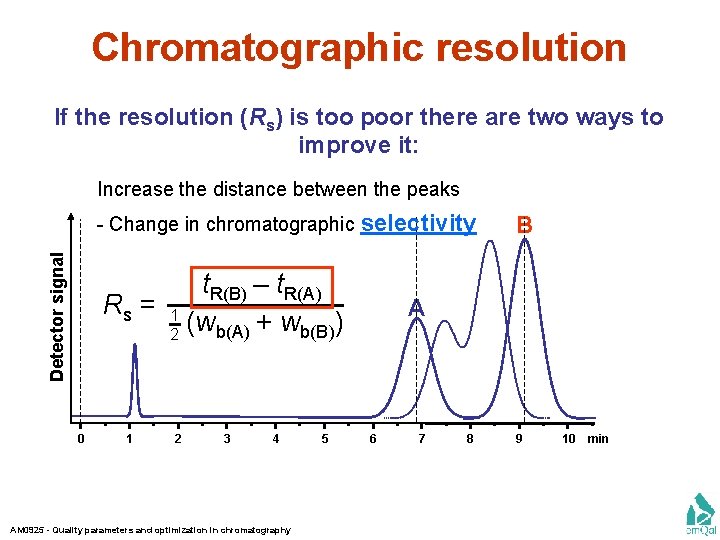
Chromatographic resolution Resolution (separation) between A and B is of course neccessary for quantification of the compounds Detector signal B t. R(B) – t. R(A) Rs = 1 (wb(A) + wb(B)) 2 0 1 2 3 4 5 A 6 7 wb is width at baseline and is defined as four times the standard deviation of the peaks AM 0925 - Quality parameters and optimization in chromatography 8 9 wb 10 min
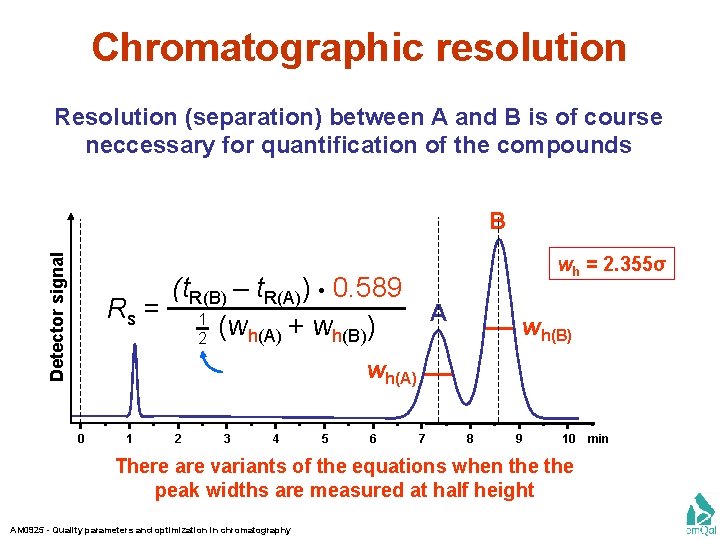
Chromatographic resolution Resolution (separation) between A and B is of course neccessary for quantification of the compounds Detector signal B wh = 2. 355σ (t. R(B) – t. R(A)) • 0. 589 Rs = 1 A (w + w ) h(A) h(B) 2 wh(B) wh(A) 0 1 2 3 4 5 6 7 8 9 10 There are variants of the equations when the peak widths are measured at half height AM 0925 - Quality parameters and optimization in chromatography min
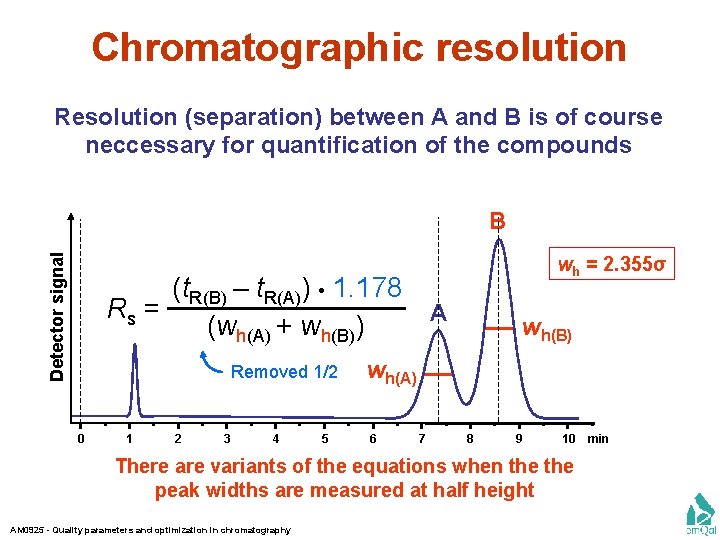
Chromatographic resolution Resolution (separation) between A and B is of course neccessary for quantification of the compounds Detector signal B wh = 2. 355σ (t. R(B) – t. R(A)) • 1. 178 Rs = A (wh(A) + wh(B)) Removed 1/2 0 1 2 3 4 5 wh(B) wh(A) 6 7 8 9 10 There are variants of the equations when the peak widths are measured at half height AM 0925 - Quality parameters and optimization in chromatography min
Chromatographic resolution If the resolution (Rs) is too poor there are two ways to improve it: Detector signal B A Poor resolution 0 1 2 3 4 AM 0925 - Quality parameters and optimization in chromatography 5 6 7 8 9 10 min
Chromatographic resolution If the resolution (Rs) is too poor there are two ways to improve it: Increase the distance between the peaks Detector signal - Change in chromatographic selectivity t. R(B) – t. R(A) Rs = 1 (wb(A) + wb(B)) 2 0 1 2 3 4 AM 0925 - Quality parameters and optimization in chromatography 5 B A 6 7 8 9 10 min
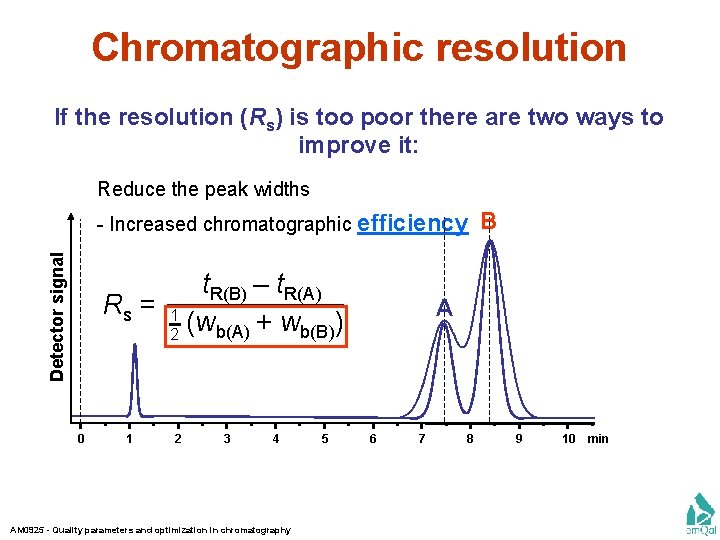
Chromatographic resolution If the resolution (Rs) is too poor there are two ways to improve it: Reduce the peak widths Detector signal - Increased chromatographic efficiency t. R(B) – t. R(A) Rs = 1 (wb(A) + wb(B)) 2 0 1 2 3 4 AM 0925 - Quality parameters and optimization in chromatography 5 B A 6 7 8 9 10 min
Chromatographic selectivity AM 0925 - Quality parameters and optimization in chromatography
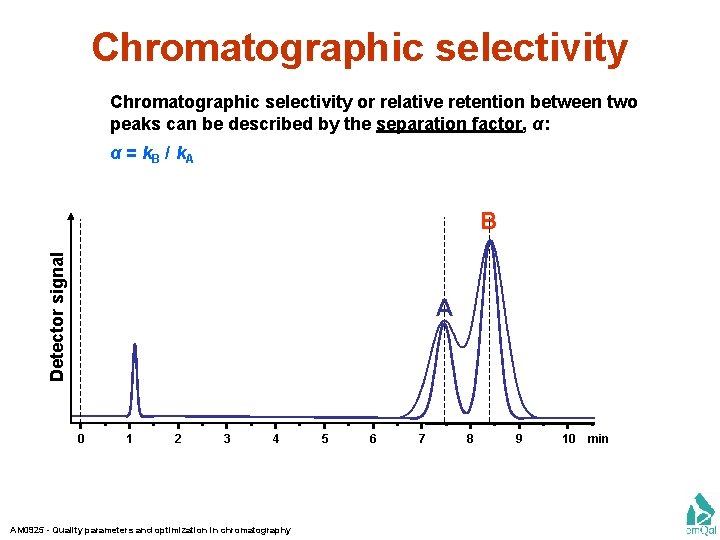
Chromatographic selectivity or relative retention between two peaks can be described by the separation factor, α: α = k. B / k. A Detector signal B A 0 1 2 3 4 AM 0925 - Quality parameters and optimization in chromatography 5 6 7 8 9 10 min
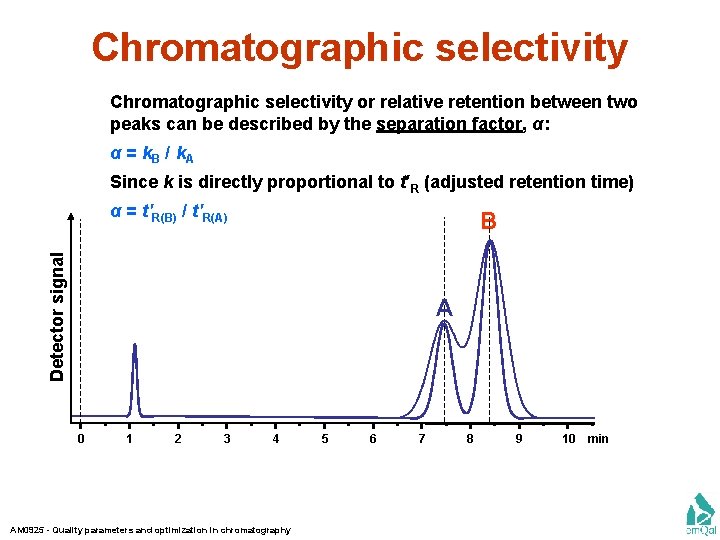
Chromatographic selectivity or relative retention between two peaks can be described by the separation factor, α: α = k. B / k. A Since k is directly proportional to t′R (adjusted retention time) α = t′R(B) / t′R(A) Detector signal B A 0 1 2 3 4 AM 0925 - Quality parameters and optimization in chromatography 5 6 7 8 9 10 min
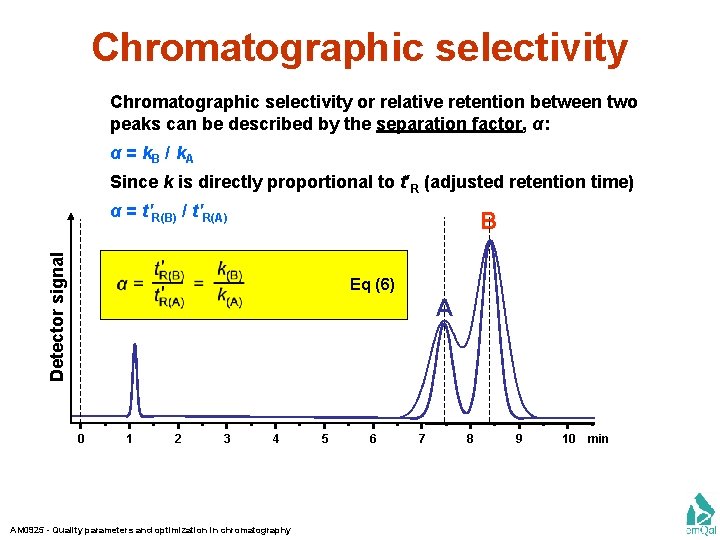
Chromatographic selectivity or relative retention between two peaks can be described by the separation factor, α: α = k. B / k. A Since k is directly proportional to t′R (adjusted retention time) α = t′R(B) / t′R(A) Detector signal B Eq (6) A 0 1 2 3 4 AM 0925 - Quality parameters and optimization in chromatography 5 6 7 8 9 10 min
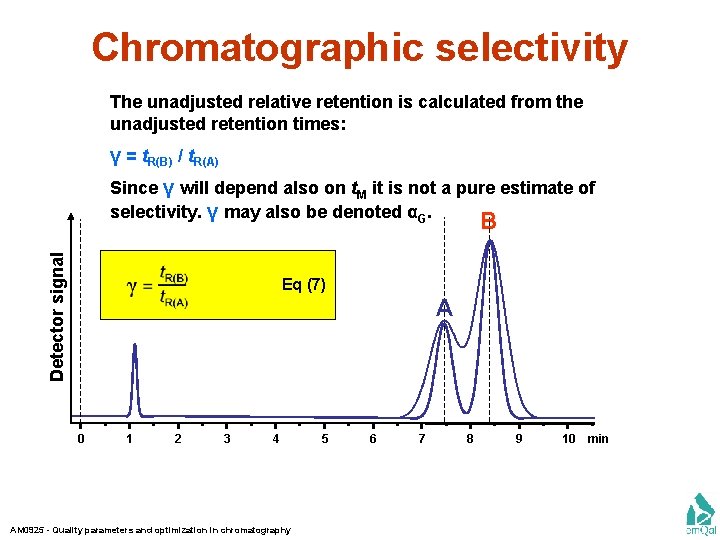
Chromatographic selectivity The unadjusted relative retention is calculated from the unadjusted retention times: γ = t. R(B) / t. R(A) Since γ will depend also on t. M it is not a pure estimate of selectivity. γ may also be denoted αG. Detector signal B Eq (7) A 0 1 2 3 4 AM 0925 - Quality parameters and optimization in chromatography 5 6 7 8 9 10 min
Chromatographic efficiency AM 0925 - Quality parameters and optimization in chromatography
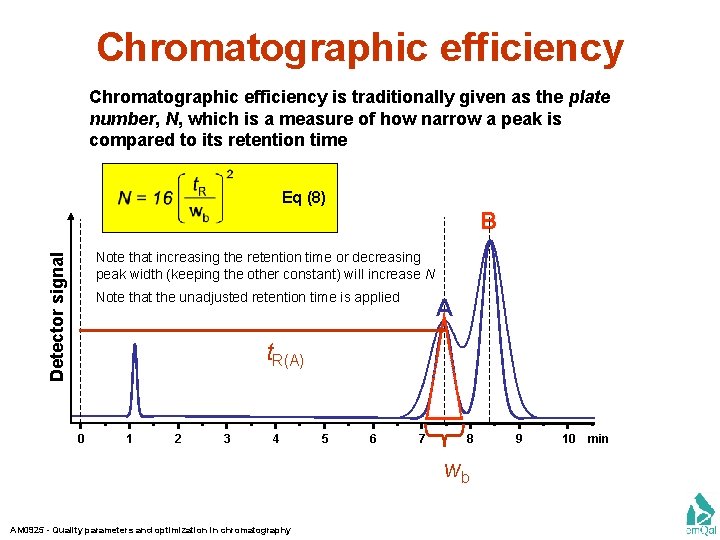
Chromatographic efficiency is traditionally given as the plate number, N, which is a measure of how narrow a peak is compared to its retention time Eq (8) B Detector signal Note that increasing the retention time or decreasing peak width (keeping the other constant) will increase N Note that the unadjusted retention time is applied A t. R(A) 0 1 2 3 4 5 6 7 8 wb AM 0925 - Quality parameters and optimization in chromatography 9 10 min
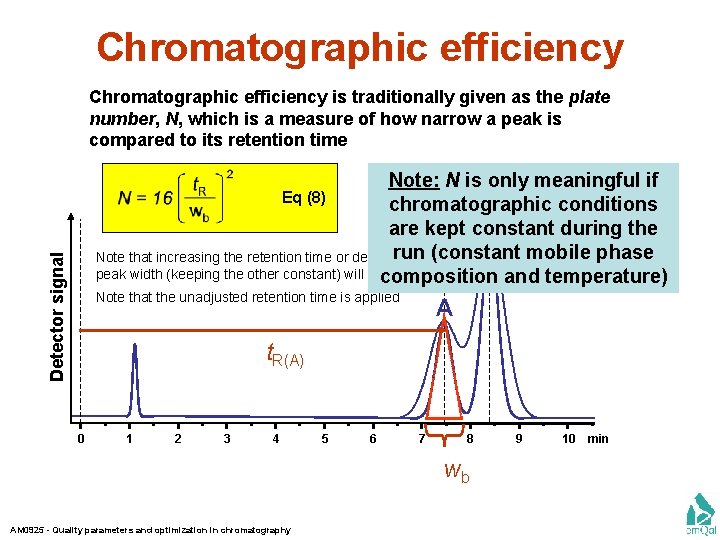
Chromatographic efficiency is traditionally given as the plate number, N, which is a measure of how narrow a peak is compared to its retention time Detector signal Note: N is only meaningful if Eq (8) chromatographic conditions B are kept constant during the run (constant mobile phase Note that increasing the retention time or decreasing peak width (keeping the other constant) will increase N composition and temperature) Note that the unadjusted retention time is applied A t. R(A) 0 1 2 3 4 5 6 7 8 wb AM 0925 - Quality parameters and optimization in chromatography 9 10 min
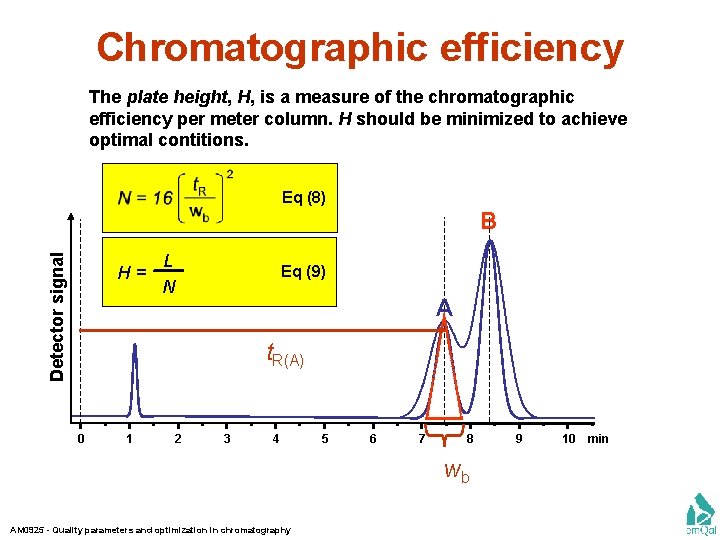
Chromatographic efficiency The plate height, H, is a measure of the chromatographic efficiency per meter column. H should be minimized to achieve optimal contitions. Eq (8) Detector signal B H= L N Eq (9) A t. R(A) 0 1 2 3 4 5 6 7 8 wb AM 0925 - Quality parameters and optimization in chromatography 9 10 min
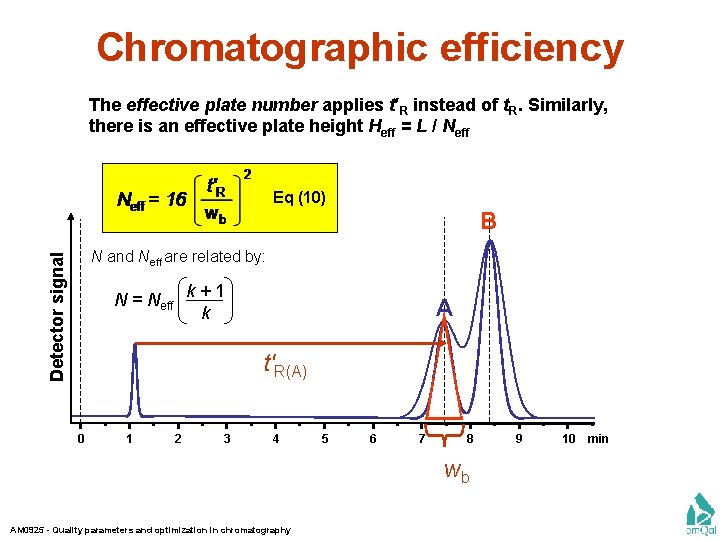
Chromatographic efficiency The effective plate number applies t′R instead of t. R. Similarly, there is an effective plate height Heff = L / Neff Eq (10) B Detector signal N and Neff are related by: N = Neff k + 1 k A t′R(A) 0 1 2 3 4 5 6 7 8 wb AM 0925 - Quality parameters and optimization in chromatography 9 10 min
The Purnell equation AM 0925 - Quality parameters and optimization in chromatography
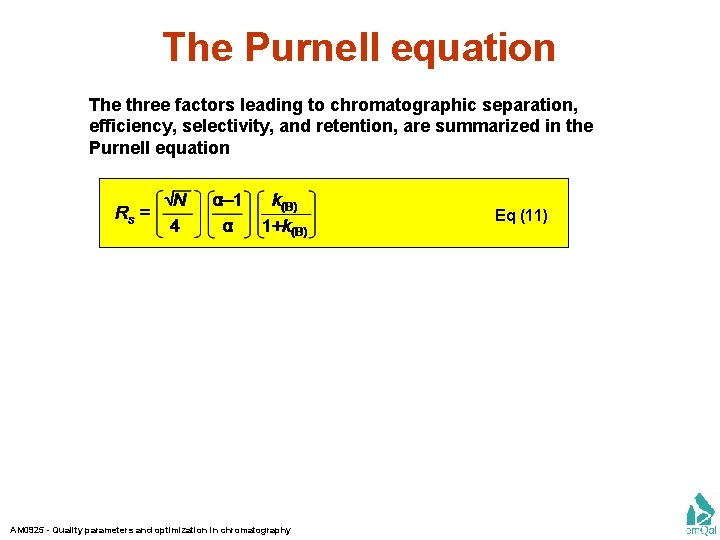
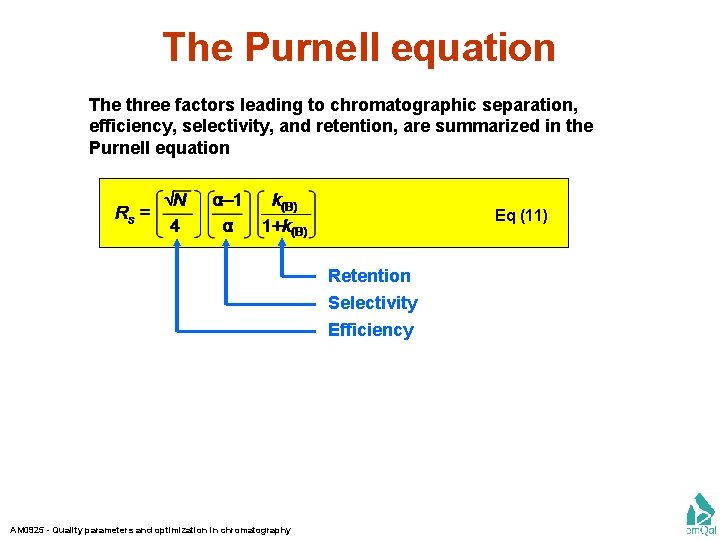
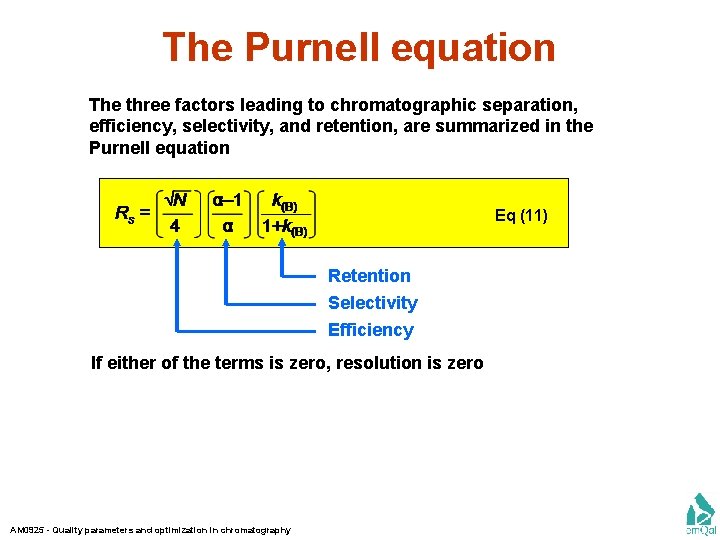
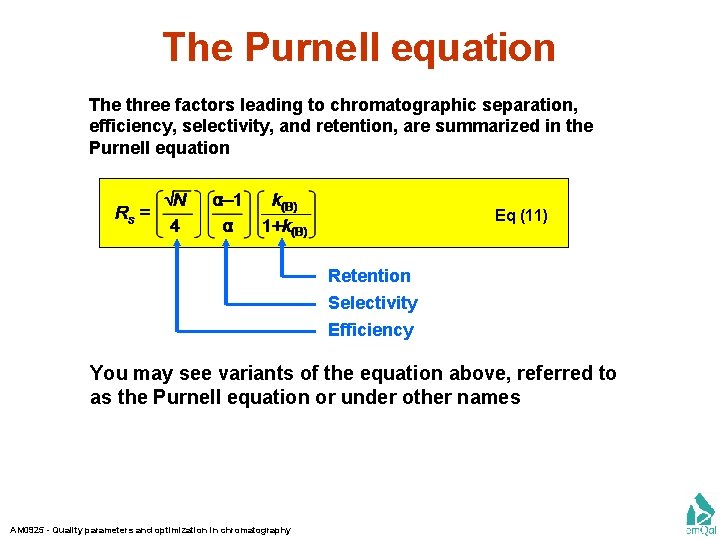
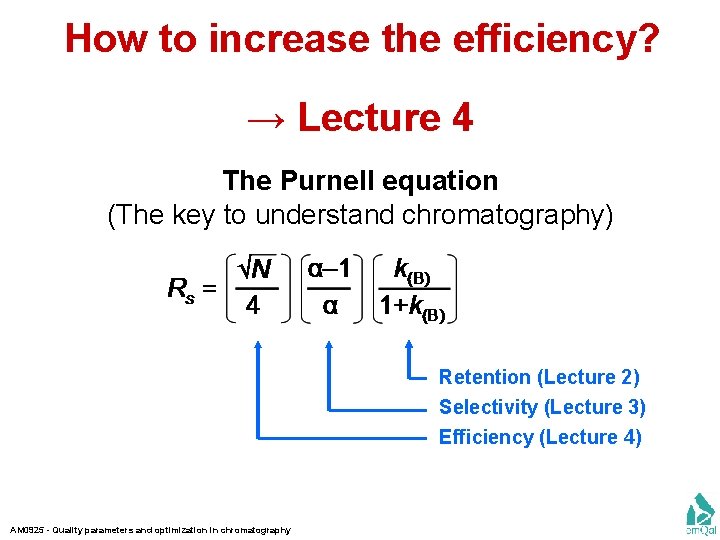
The Purnell equation The three factors leading to chromatographic separation, efficiency, selectivity, and retention, are summarized in the Purnell equation Eq (11) AM 0925 - Quality parameters and optimization in chromatography
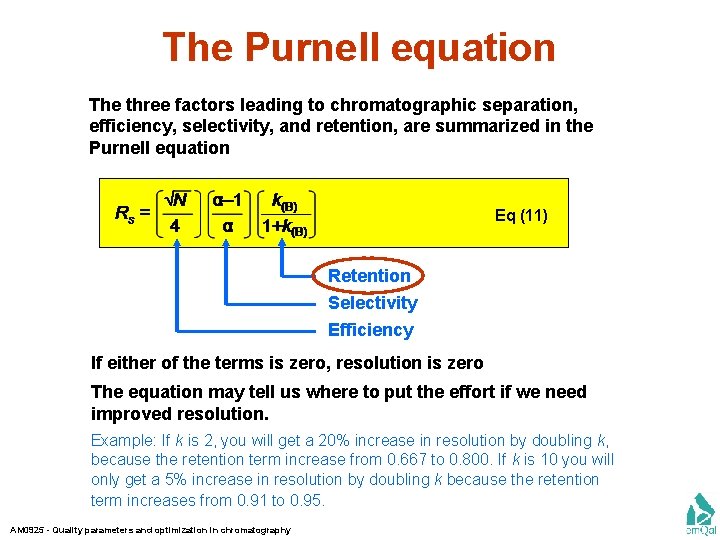
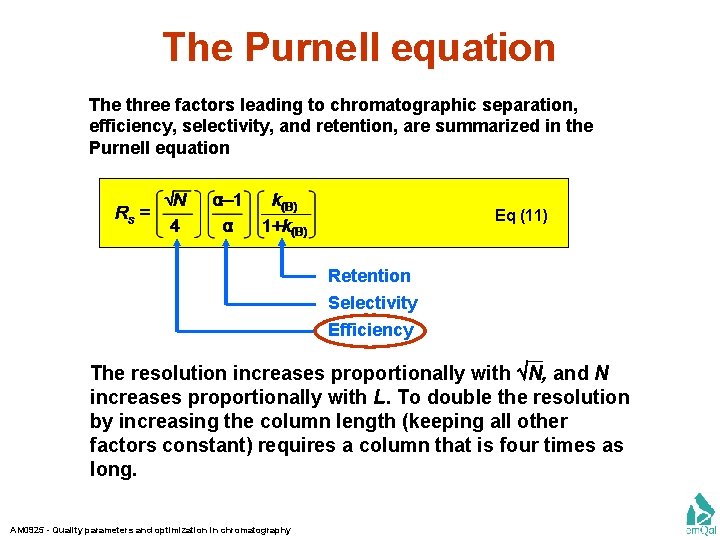
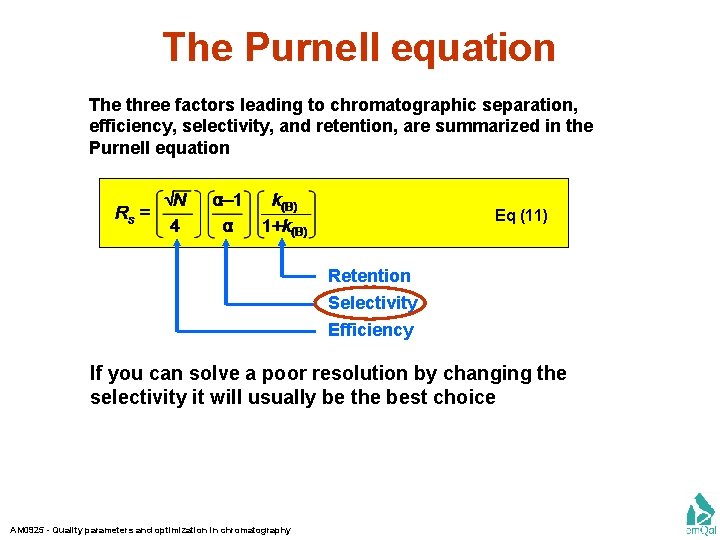
The Purnell equation The three factors leading to chromatographic separation, efficiency, selectivity, and retention, are summarized in the Purnell equation Eq (11) Retention Selectivity Efficiency AM 0925 - Quality parameters and optimization in chromatography
The Purnell equation The three factors leading to chromatographic separation, efficiency, selectivity, and retention, are summarized in the Purnell equation Eq (11) Retention Selectivity Efficiency If either of the terms is zero, resolution is zero AM 0925 - Quality parameters and optimization in chromatography
The Purnell equation The three factors leading to chromatographic separation, efficiency, selectivity, and retention, are summarized in the Purnell equation Eq (11) Retention Selectivity Efficiency If either of the terms is zero, resolution is zero The equation may tell us where to put the effort if we need improved resolution. Example: If k is 2, you will get a 20% increase in resolution by doubling k, because the retention term increase from 0. 667 to 0. 800. If k is 10 you will only get a 5% increase in resolution by doubling k because the retention term increases from 0. 91 to 0. 95. AM 0925 - Quality parameters and optimization in chromatography
The Purnell equation The three factors leading to chromatographic separation, efficiency, selectivity, and retention, are summarized in the Purnell equation Eq (11) Retention Selectivity Efficiency The resolution increases proportionally with N, and N increases proportionally with L. To double the resolution by increasing the column length (keeping all other factors constant) requires a column that is four times as long. AM 0925 - Quality parameters and optimization in chromatography
The Purnell equation The three factors leading to chromatographic separation, efficiency, selectivity, and retention, are summarized in the Purnell equation Eq (11) Retention Selectivity Efficiency If you can solve a poor resolution by changing the selectivity it will usually be the best choice AM 0925 - Quality parameters and optimization in chromatography
The Purnell equation The three factors leading to chromatographic separation, efficiency, selectivity, and retention, are summarized in the Purnell equation Eq (11) Retention Selectivity Efficiency You may see variants of the equation above, referred to as the Purnell equation or under other names AM 0925 - Quality parameters and optimization in chromatography
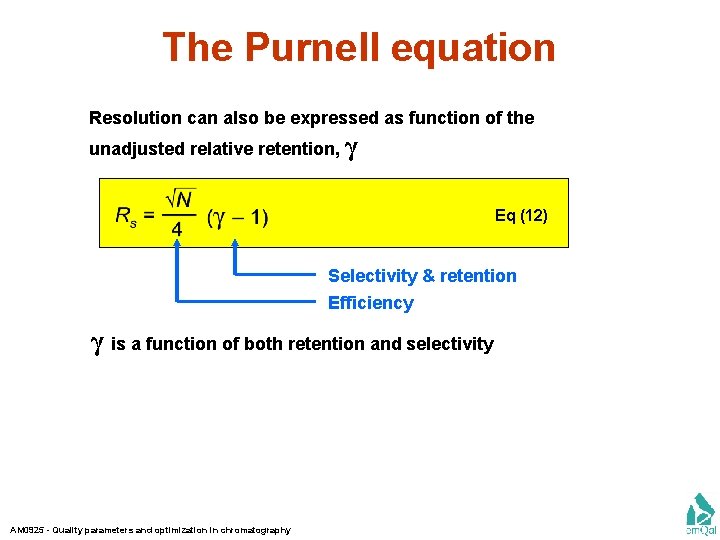
The Purnell equation Resolution can also be expressed as function of the unadjusted relative retention, γ Eq (12) Selectivity & retention Efficiency γ is a function of both retention and selectivity AM 0925 - Quality parameters and optimization in chromatography
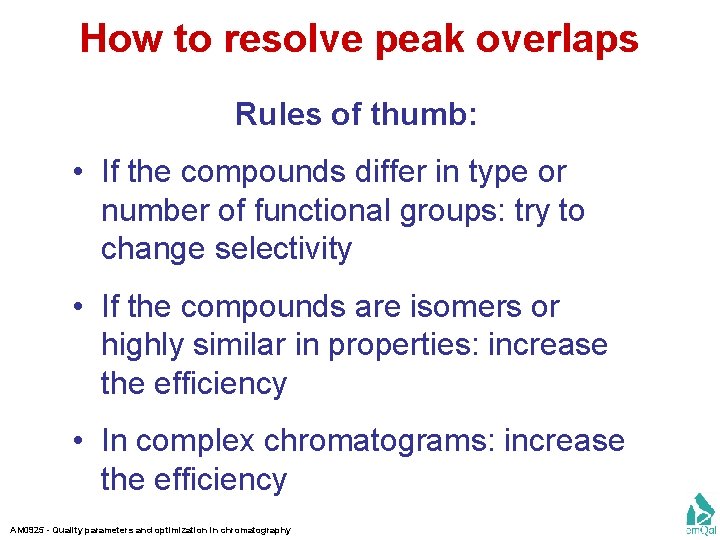
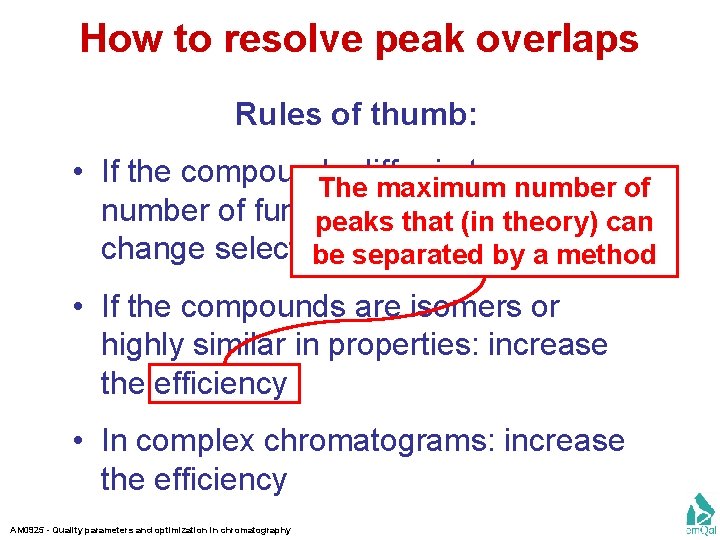
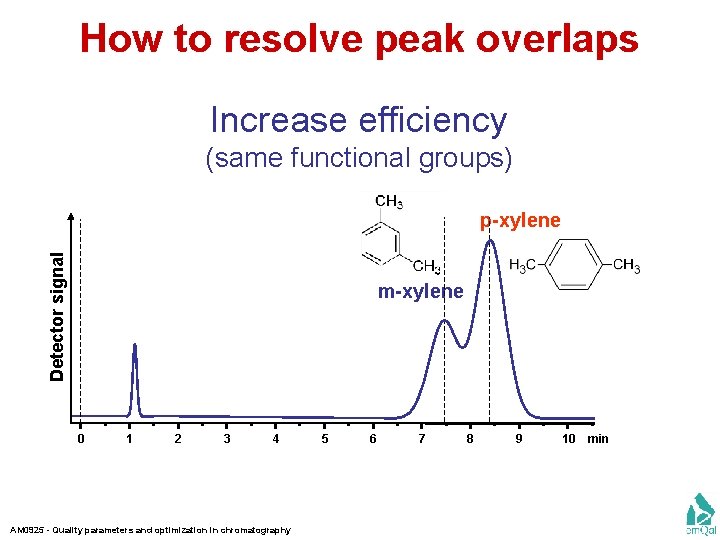
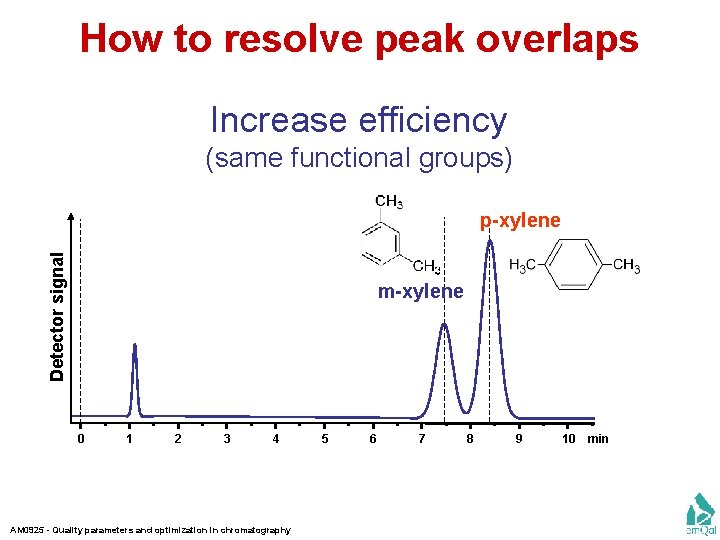
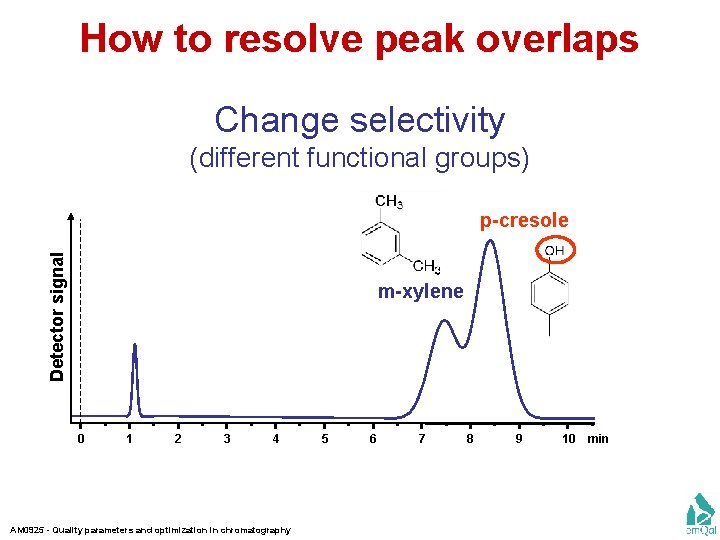
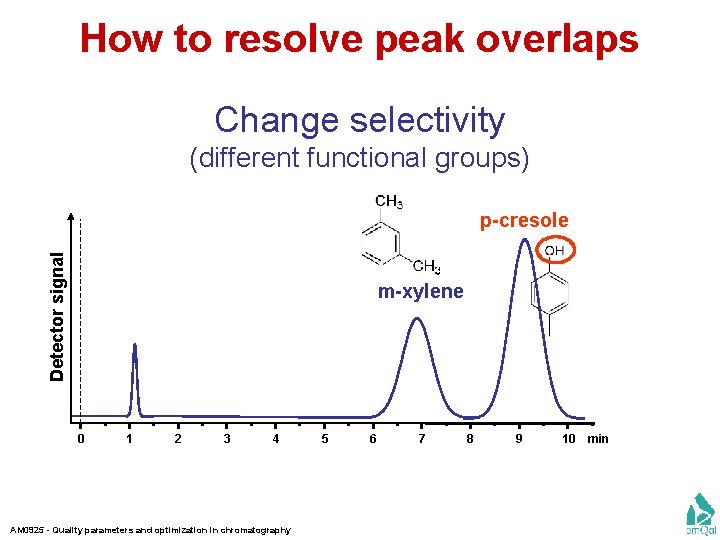
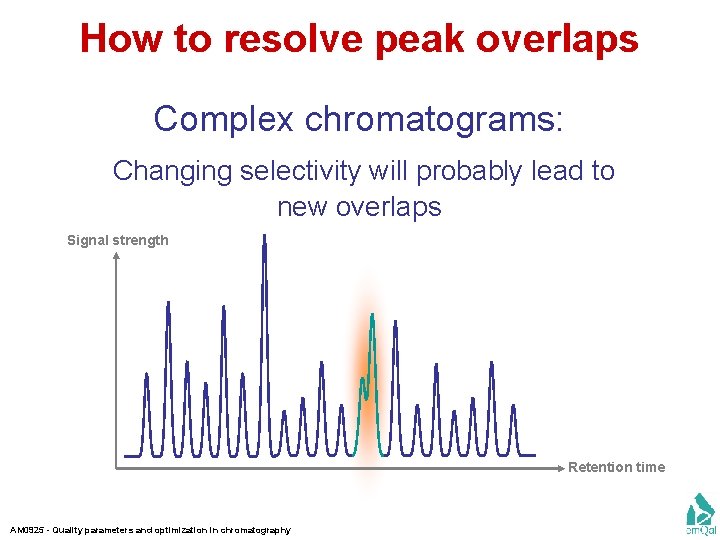
How to resolve peak overlaps Rules of thumb: • If the compounds differ in type or number of functional groups: try to change selectivity • If the compounds are isomers or highly similar in properties: increase the efficiency • In complex chromatograms: increase the efficiency AM 0925 - Quality parameters and optimization in chromatography
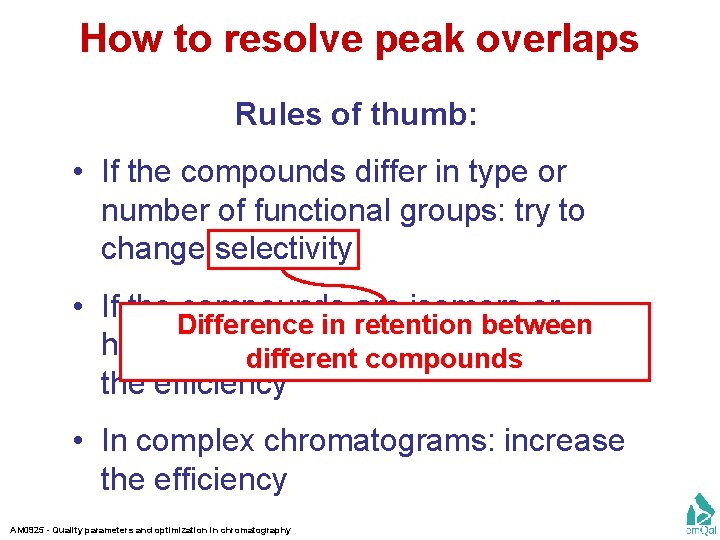
How to resolve peak overlaps Rules of thumb: • If the compounds differ in type or number of functional groups: try to change selectivity • If the compounds are isomers or Difference in retention between highly similar in properties: increase different compounds the efficiency • In complex chromatograms: increase the efficiency AM 0925 - Quality parameters and optimization in chromatography
How to resolve peak overlaps Rules of thumb: • If the compounds differ in type or The maximum number of functional try to can peaks groups: that (in theory) change selectivity be separated by a method • If the compounds are isomers or highly similar in properties: increase the efficiency • In complex chromatograms: increase the efficiency AM 0925 - Quality parameters and optimization in chromatography
How to resolve peak overlaps Increase efficiency (same functional groups) Detector signal p-xylene m-xylene 0 1 2 3 4 AM 0925 - Quality parameters and optimization in chromatography 5 6 7 8 9 10 min
How to resolve peak overlaps Increase efficiency (same functional groups) Detector signal p-xylene m-xylene 0 1 2 3 4 AM 0925 - Quality parameters and optimization in chromatography 5 6 7 8 9 10 min
How to resolve peak overlaps Change selectivity (different functional groups) Detector signal p-cresole m-xylene 0 1 2 3 4 AM 0925 - Quality parameters and optimization in chromatography 5 6 7 8 9 10 min
How to resolve peak overlaps Change selectivity (different functional groups) Detector signal p-cresole m-xylene 0 1 2 3 4 AM 0925 - Quality parameters and optimization in chromatography 5 6 7 8 9 10 min
How to resolve peak overlaps Complex chromatograms: Changing selectivity will probably lead to new overlaps Signal strength Retention time AM 0925 - Quality parameters and optimization in chromatography
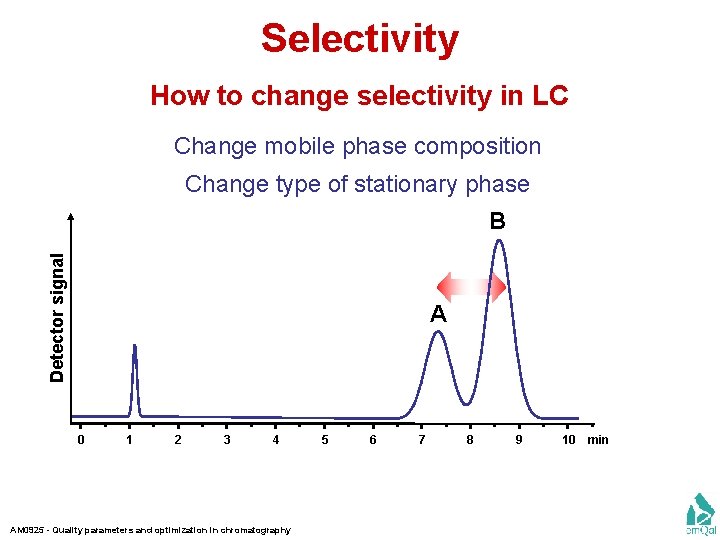
Selectivity How to change selectivity in LC Change mobile phase composition Change type of stationary phase Detector signal B A 0 1 2 3 4 AM 0925 - Quality parameters and optimization in chromatography 5 6 7 8 9 10 min
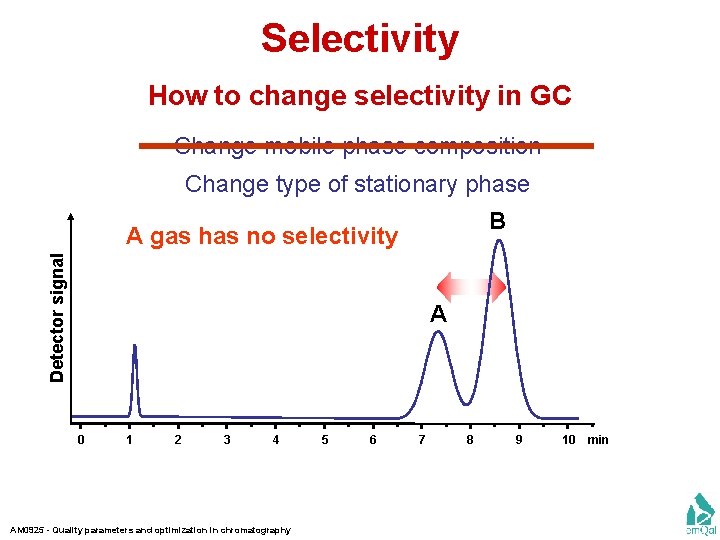
Selectivity How to change selectivity in GC Change mobile phase composition Change type of stationary phase B Detector signal A gas has no selectivity A 0 1 2 3 4 AM 0925 - Quality parameters and optimization in chromatography 5 6 7 8 9 10 min
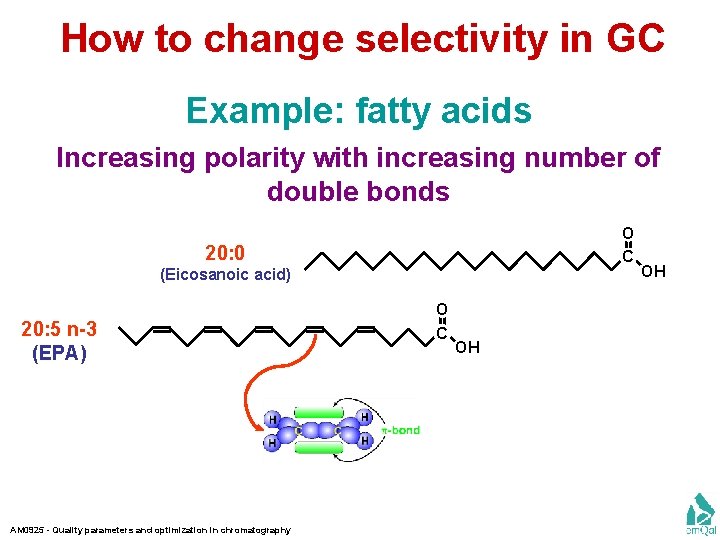
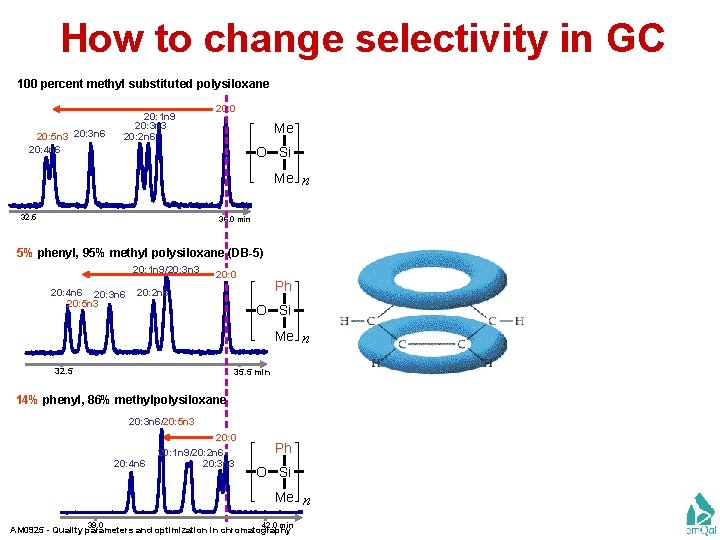
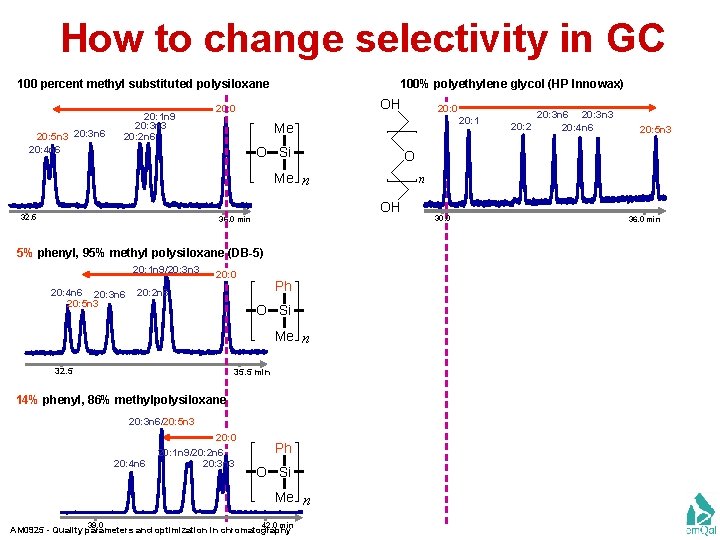
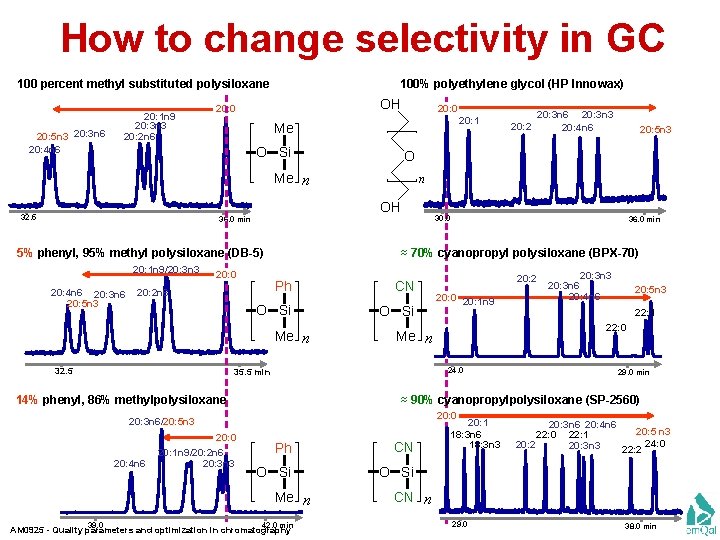
How to change selectivity in GC Example: fatty acids Increasing polarity with increasing number of double bonds O C 20: 0 (Eicosanoic acid) 20: 5 n-3 (EPA) AM 0925 - Quality parameters and optimization in chromatography O C OH OH
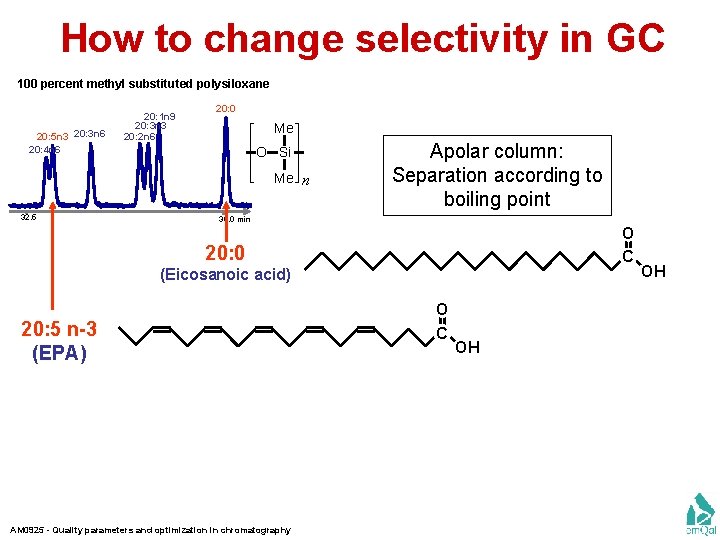
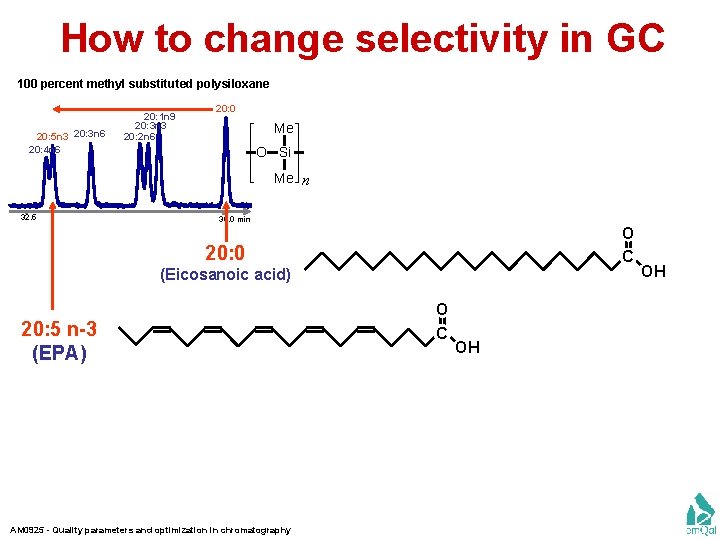
How to change selectivity in GC 100 percent methyl substituted polysiloxane 20: 5 n 3 20: 3 n 6 20: 4 n 6 20: 1 n 9 20: 3 n 3 20: 2 n 6 20: 0 Me O Si Me n 32. 5 Apolar column: Separation according to boiling point 36. 0 min O C 20: 0 (Eicosanoic acid) 20: 5 n-3 (EPA) AM 0925 - Quality parameters and optimization in chromatography O C OH OH
How to change selectivity in GC 100 percent methyl substituted polysiloxane 20: 5 n 3 20: 3 n 6 20: 4 n 6 20: 1 n 9 20: 3 n 3 20: 2 n 6 20: 0 Me O Si Me n 32. 5 36. 0 min O C 20: 0 (Eicosanoic acid) 20: 5 n-3 (EPA) AM 0925 - Quality parameters and optimization in chromatography O C OH OH
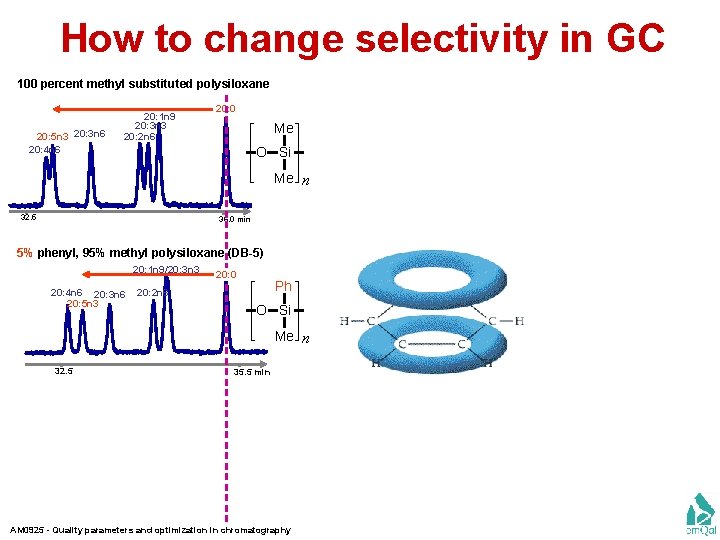
How to change selectivity in GC 100 percent methyl substituted polysiloxane 20: 5 n 3 20: 3 n 6 20: 4 n 6 20: 1 n 9 20: 3 n 3 20: 2 n 6 20: 0 Me O Si Me n 32. 5 36. 0 min 5% phenyl, 95% methyl polysiloxane (DB-5) 20: 1 n 9/20: 3 n 3 20: 4 n 6 20: 3 n 6 20: 5 n 3 20: 0 Ph 20: 2 n 6 O Si Me n 32. 5 35. 5 min AM 0925 - Quality parameters and optimization in chromatography
How to change selectivity in GC 100 percent methyl substituted polysiloxane 20: 5 n 3 20: 3 n 6 20: 4 n 6 20: 1 n 9 20: 3 n 3 20: 2 n 6 20: 0 Me O Si Me n 32. 5 36. 0 min 5% phenyl, 95% methyl polysiloxane (DB-5) 20: 1 n 9/20: 3 n 3 20: 4 n 6 20: 3 n 6 20: 5 n 3 20: 0 Ph 20: 2 n 6 O Si Me n 32. 5 35. 5 min 14% phenyl, 86% methylpolysiloxane 20: 3 n 6/20: 5 n 3 20: 0 20: 4 n 6 20: 1 n 9/20: 2 n 6 20: 3 n 3 Ph O Si Me n 39. 0 42. 0 min AM 0925 - Quality parameters and optimization in chromatography
How to change selectivity in GC 100 percent methyl substituted polysiloxane 20: 5 n 3 20: 3 n 6 20: 4 n 6 20: 1 n 9 20: 3 n 3 20: 2 n 6 100% polyethylene glycol (HP Innowax) OH 20: 0 20: 1 Me O Si 5% phenyl, 95% methyl polysiloxane (DB-5) 20: 1 n 9/20: 3 n 3 20: 4 n 6 20: 3 n 6 20: 5 n 3 20: 0 Ph 20: 2 n 6 O Si Me n 32. 5 35. 5 min 14% phenyl, 86% methylpolysiloxane 20: 3 n 6/20: 5 n 3 20: 0 20: 4 n 6 20: 1 n 9/20: 2 n 6 20: 3 n 3 Ph O Si Me n 39. 0 42. 0 min AM 0925 - Quality parameters and optimization in chromatography 20: 3 n 6 20: 3 n 3 20: 4 n 6 20: 5 n 3 n OH 36. 0 min 20: 2 O Me n 32. 5 20: 0 30. 0 36. 0 min
How to change selectivity in GC 100 percent methyl substituted polysiloxane 20: 5 n 3 20: 3 n 6 20: 4 n 6 20: 1 n 9 20: 3 n 3 20: 2 n 6 100% polyethylene glycol (HP Innowax) OH 20: 0 20: 1 Me O Si 5% phenyl, 95% methyl polysiloxane (DB-5) 20: 1 n 9/20: 3 n 3 20: 4 n 6 20: 3 n 6 20: 5 n 3 20: 0 CN O Si Me n 32. 5 20: 2 20: 0 20: 1 n 9 22: 0 20: 1 n 9/20: 2 n 6 20: 3 n 3 20: 5 n 3 29. 0 min ≈ 90% cyanopropylpolysiloxane (SP-2560) 20: 3 n 6/20: 5 n 3 20: 0 20: 3 n 3 20: 3 n 6 20: 4 n 6 22: 1 24. 0 14% phenyl, 86% methylpolysiloxane Ph CN O Si Me n 39. 0 36. 0 min Me n 35. 5 min 20: 4 n 6 30. 0 ≈ 70% cyanopropyl polysiloxane (BPX-70) Ph 20: 2 n 6 20: 5 n 3 n OH 36. 0 min 20: 3 n 6 20: 3 n 3 20: 4 n 6 O Me n 32. 5 20: 2 42. 0 min AM 0925 - Quality parameters and optimization in chromatography 20: 1 18: 3 n 6 18: 3 n 3 20: 3 n 6 20: 4 n 6 20: 5 n 3 22: 0 22: 1 24: 0 20: 2 20: 3 n 3 22: 2 CN n 29. 0 38. 0 min
How to increase the efficiency? → Lecture 4 AM 0925 - Quality parameters and optimization in chromatography
How to increase the efficiency? → Lecture 4 The Purnell equation (The key to understand chromatography) Retention (Lecture 2) Selectivity (Lecture 3) Efficiency (Lecture 4) AM 0925 - Quality parameters and optimization in chromatography
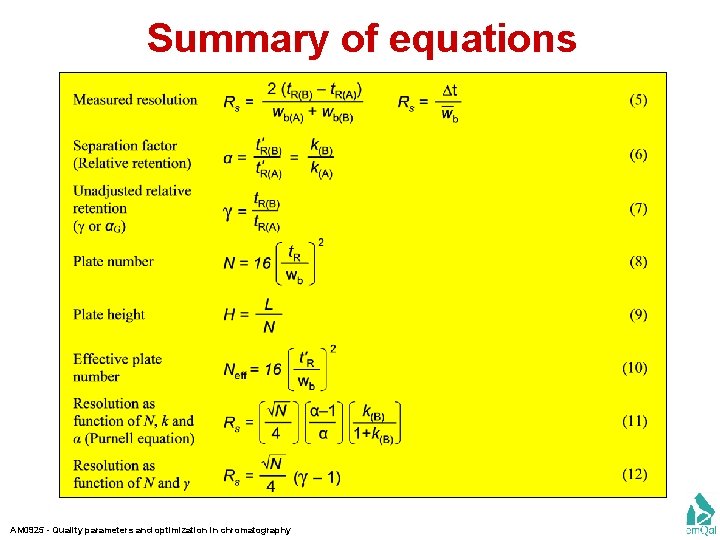
Summary of equations AM 0925 - Quality parameters and optimization in chromatography
AM 0925 - Quality parameters and optimization in chromatography