Lecture 3 Data Compression for Two Variables Scatterplots

Lecture 3. Data Compression for Two Variables: Scatterplots, Cross. Tabulations, and Correlation David R. Merrell 90 -786 Intermediate Empirical Methods for Public Policy and Management

Lecture 3: Agenda n n n Review of Lecture 2 Cross-Tabulations Comparison Bar Charts Parallel Box Plots Scatterplots Correlation Coefficients

Review of Lecture 2 n n Mean or Median Models for Data

Mean or Median n n Complaints have reached the city manager that Tardy City is taking too long to pay its bills. Data are days taken to pay seven bills: 34 27 64 31 30 26 35 Calculate the mean and median. What do you conclude?

Models for Data n n Data = Fit + Residual Fit as a Center n n Mean Median Mode Example: Number of Stat Courses Taken by Students in 90 -786
")
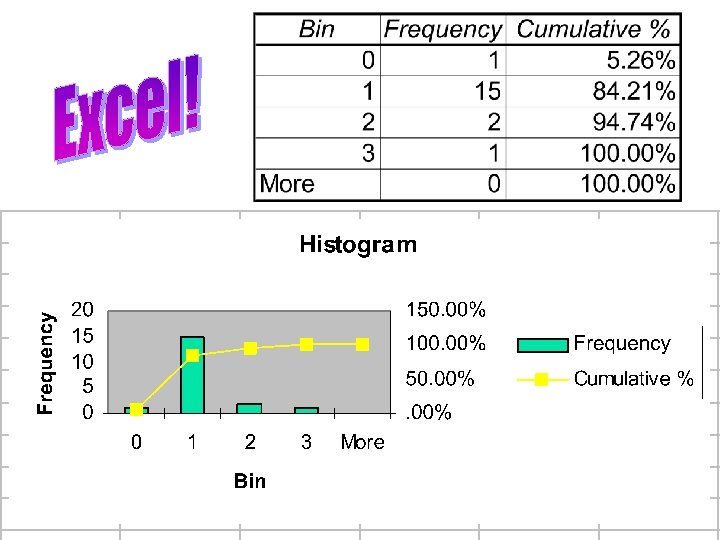
Summary Statistics (Excel)
 Descriptive Statistics Variable N Mean Median Tr Mea St. Dev SE")
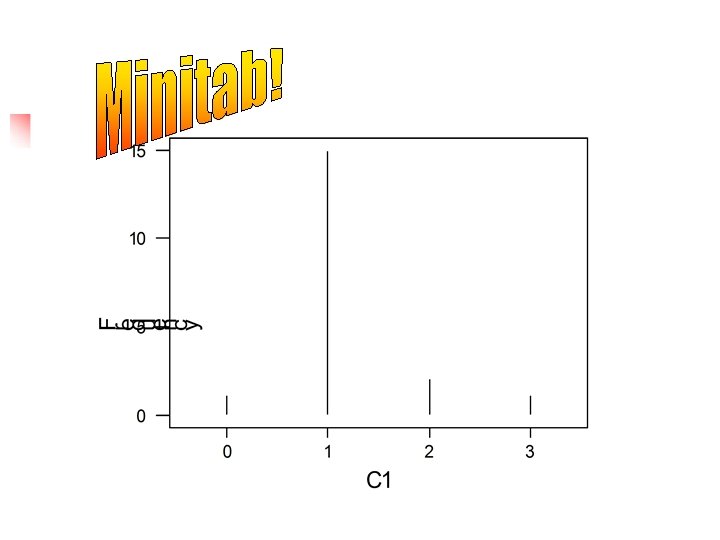
Summary Statistics (Minitab) Descriptive Statistics Variable N Mean Median Tr Mea St. Dev SE Mean C 1 19 1. 158 1. 000 1. 118 0. 602 0. 138 Variable C 1 1. 000 Min 0. 000 Max 3. 000 Q 1 1. 000 Q

Measures of Error

Data Compression for Two Variables. . . And More n n n n Two-Variable Description Cross-Tabulations Comparison Bar Charts Parallel Box Plots Scatterplot Matrix Correlation Coefficients

Two-Variable Description

Structure of a Cross-Tabulation

Street Repair Practices n n Study street repair practices of local government Cities and counties handle street repairs: n n n using their own public employees exclusively by contracting out part of the work contracting out all the work

Table 1. Street Repair: Counts Street Repair Practices by Type of Government: Public Employees and Contracting by Cities and Counties in the United States Type of Local Government

Table 2. Street Repair: Percents Street Repair Practices by Type of Government: Public Employees and Contracting by Cities and Counties in the United States Type of Local Government

Educational Achievement n n n Residents of Allegheny County that are in labor force Random sample survey of Allegheny County residents in labor force in 199? Variables: gender and highest educational achievement

Educational Achievement: Coding of Ordinal Variables n n n n 1 2 3 4 5 6 7 8 if if grade 4 or less grades 5 -7 grade 8 high school incomplete (9 -11) high school graduate (12) technical, trade, or business after high school college/ university incomplete college/university graduate or more

Educational Achievement Table

Bar Chart

Job Satisfaction and Income for Postal Employees

Five Number Summary Age of Allegheny County residents by location: individuals in labor force in 199? .

Parallel Box Plots 80 oo 70 o o 60 50 40 30 20 10 The Mon Valley Pittsburgh Other

Scatterplots n n n Creating via Excel Chart. Wizard Transformation of Variables Scatterplot Matrices

Salary Scatterplot 1 Years employed

Salary Scatterplot 2 Years employed

Salary Scatterplot 3 Years employed

Scatterplot Matrix Years Salary Age Hired

Correlation Coefficient, r

Properties of r

International Adoption Visas: 1991 vs 1988 n r: /academic/90 -786/ Chatterjee/ Adopt. dat

International Adoption Visas Country 1988 Etc. 1991 1992
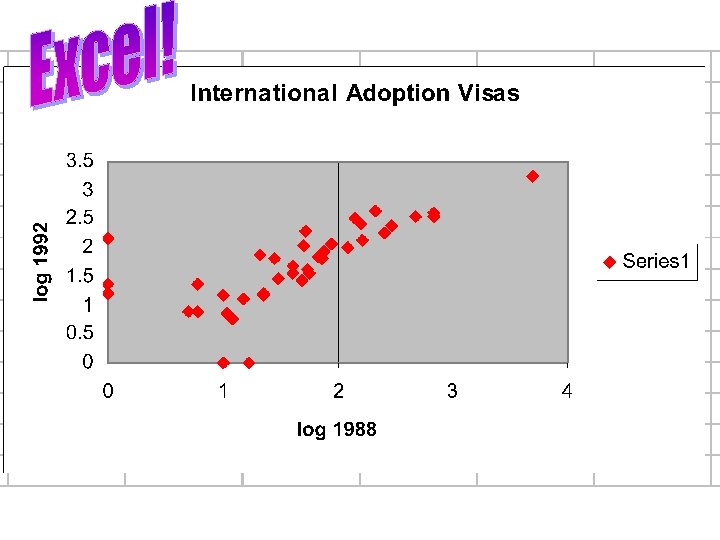

Excel Calculation of r n n n Use statistical function, correl Eliminate missing data values Identify X data Identify Y data Finish Value: r = 0. 879098 (. 88)
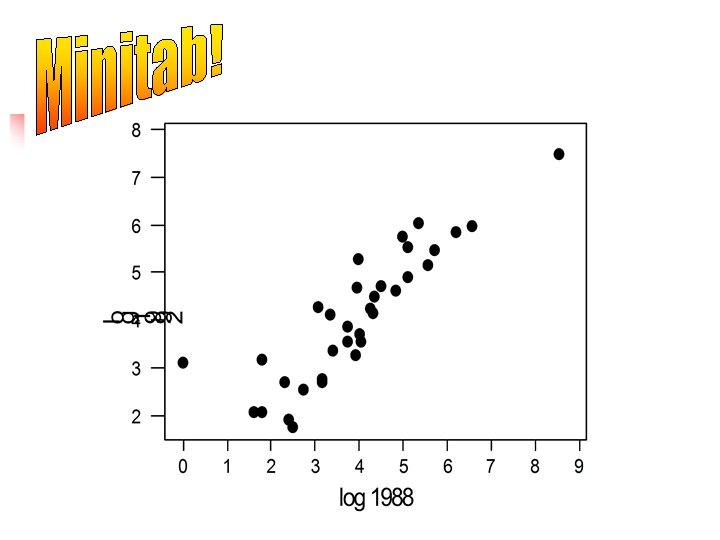
 Correlation of log 1988 and log 1992 =")
Minitab Calculation of r Correlations (Pearson) Correlation of log 1988 and log 1992 = 0. 873

Next Time. . . Ethics and the Value of Data n n Social Value of Data Privacy Issues Confidentiality Applications in Health Care
- Slides: 37