Lecture 29 Modeling Data Data Modeling Interpolate between

Lecture 29: Modeling Data

Data Modeling Interpolate between data points, using either linear or cubic spline models Model a set of data points as a polynomial

Interpolation When you take data, how do you predict what other data points might be? Two techniques are : n n Linear Interpolation Cubic Spline Interpolation What is the corresponding value of y for this x?

Linear Interpolation Assume the function between two points is a straight line Interpolated Points How do you find a point in between? X=2, Y=? Linear Interpolation – Connect the points with a straight line to find y

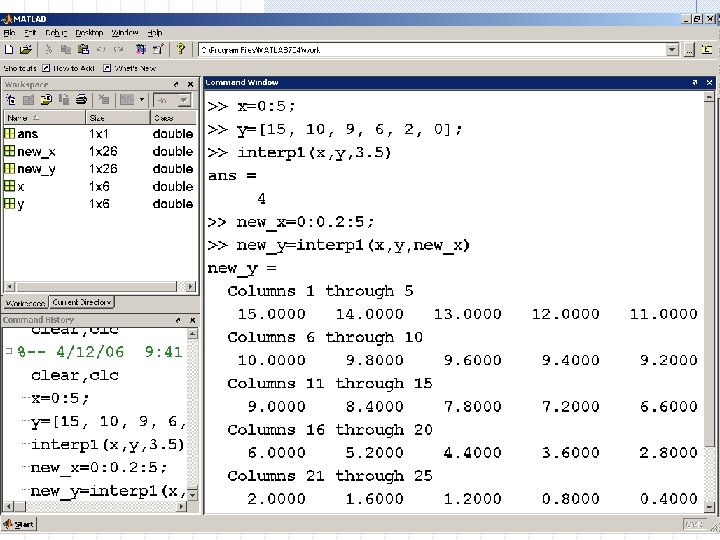
MATLAB Code interp 1 is the MATLAB function for linear interpolation First define an array of x and y for measured data Then define a new x array, that includes the x values for which you want to find y values new_y=interp 1(x, y, x_new)

 Both measured data points and interpolated data were")
plot(x, y, ‘-o’, new_x, new_y, ‘xr’) Both measured data points and interpolated data were plotted on the same graph.

Cubic Spline A cubic spline creates a smooth curve, using a third degree polynomial We can get an improved estimate by using the spline interpolation technique


Cubic Spline Interpolation. The diamond data points on the smooth curve were calculated. The star data points were measured. Note that every measured point also falls on the curved line.

Curve Fitting There is scatter in all collected data We can estimate the equation that represents the data by “eyeballing” a graph There will be points that do not fall on the line we estimate

This line is just a “best guess”

Linear Regression Finds the “best fit” straight line Minimizes the amount each point is away from the line It’s possible none of the points will fall on the line

Polynomial Regression Linear Regression finds a straight line, which is a first order polynomial If the data doesn’t represent a straight line, a polynomial of higher order may be a better fit

polyfit and polyval polyfit finds the coefficients of a polynomial representing the data polyval uses those coefficients to find new values of y, that correspond to the specified values of x

Coefficients of the first order polynomial describing the best fit line y = -2. 9143*x +14. 2857
- Slides: 17