Lecture 17 Thermal imaging diagnostics 1 Thermal imaging


 and")


 and")


- Slides: 47
Lecture 17. Thermal imaging diagnostics 1. Thermal imaging diagnostic of high-current electron beam 2. Thermal imaging diagnostics of powerful ion beam 1
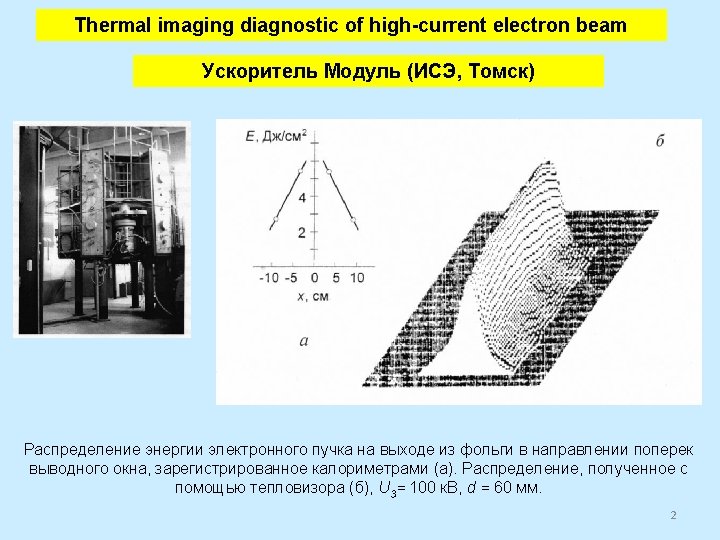
Thermal imaging diagnostic of high-current electron beam The scheme of thermal diagnostics of the electron beam (а): the diode chamber of the accelerator TEU-500 (1); the cathode (2); the anode grid and aluminum foil (3); thermal imager (4); the foamed polystyrene SPb-25 (5). The oscilloscope traces (b): of the accelerating voltage (1) and of the electron beam current (2) A. Pushkarev, G. Kholodnaya, R. Sazonov and D. Ponomarev. Thermal imaging diagnostics of high-current electron beams // Review of Scientific Instruments, 2012, Vol. 83, Issue 10, 3
1. 1. Faraday cup for electron beam RFC U Ie = U/RFC Electron beam To osc. Waveforms of (1) electron current and (2) voltage RFC = 0, 0485 Ohm
Measurement of distribution of energy density over cross section The thermogram of the electron beam and the distribution of the absorbed dose in the horizontal section after 2 (1), 11 (2) and 18 seconds (3) after the irradiation Normalized distribution of the absorbed dose in the horizontal section (data of Fig. 8) and the 6 dynamics of cooling the target 16 mm thick (1) and 24 mm thick (2)
Measurement of distribution of energy density over cross section The thermogram of the electron beam and the distribution of the absorbed dose in the horizontal section of the print 7
Thermal imaging diagnostic of high-current electron beam We can calculate the absorbed dose of the electron beam by comparing the temperature of the target before and after shot, provided that the target is not melted. Then the absorbed dose D, in Gy is: D (x, y) = сv ΔТ (x, y), in which сv is specific heat capacity of the target, ΔТ is the target heating. A. Pushkarev, G. Kholodnaya, R. Sazonov and D. Ponomarev. Thermal imaging diagnostics of high-current electron beams // Review of Scientific Instruments, 2012, Vol. 83, Issue 10, 8
Electron energy spectrum control The thermograms of the target with the A-K gap of 10. 5 mm (а) and 16 mm (b). Each space in the scale is 10 mm. Oscilloscope traces of the accelerating voltage (а) and the distribution of the absorbed dose 9 over the depth of the target (b) at the A–K gap of 10. 5 mm (1) and 16 mm (2)
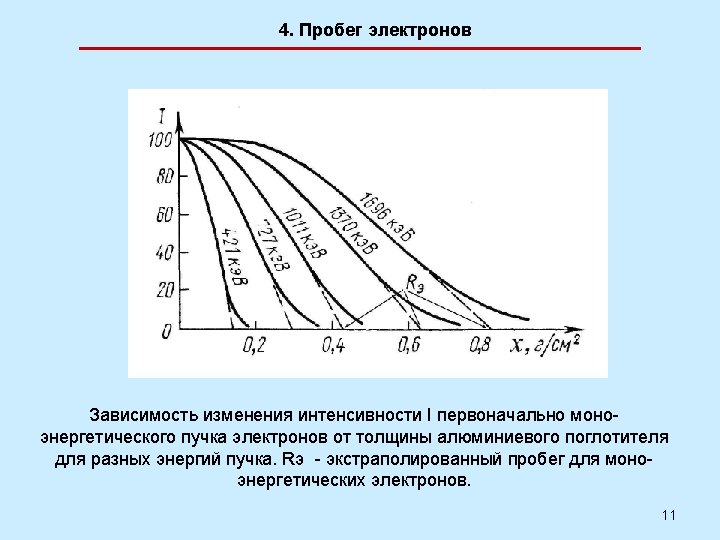
Electron energy spectrum control Normalized distribution of the absorbed dose over the depth of the target (spot) at A–K gap of 10. 5 mm (1) and 16 mm (2). Modeling of electron absorption (line) with the energy of 100 ke. V (3), 300 ke. V (4), 380 ke. V (5) and 500 ke. V (6). A. Pushkarev, G. Kholodnaya, R. Sazonov and D. Ponomarev. Thermal imaging diagnostics of high-current electron beams // Review of Scientific Instruments, 2012, Vol. 83, Issue 10, 10
Electron energy spectrum control Distribution of the absorbed dose over the depth of the target (1 – section 2, 2 – section 1 and 3 in Fig. 2 а): absolute (а) and normalized (b) values 12
Thermal imaging diagnostic of high-current electron beams Spatial distribution of electrons with energy in a chosen range The thermal print of the electron beam on the foamed polystyrene target 8 mm (а), 16 mm (b) and 24 mm (c) thick. Each space in the scale is 10 mm. 13
Spatial distribution of electrons with energy in a chosen range Distribution of the absorbed dose on the foamed polystyrene target 8 mm (1), 16 mm (2) and 24 mm (3) thick. Absolute (a) and normalized (b) values 14
Lecture 17. Diagnostics of pulsed ion beams 1. Thermal imaging diagnostic of high-current electron beam 2. Thermal imaging diagnostics of powerful ion beam 15
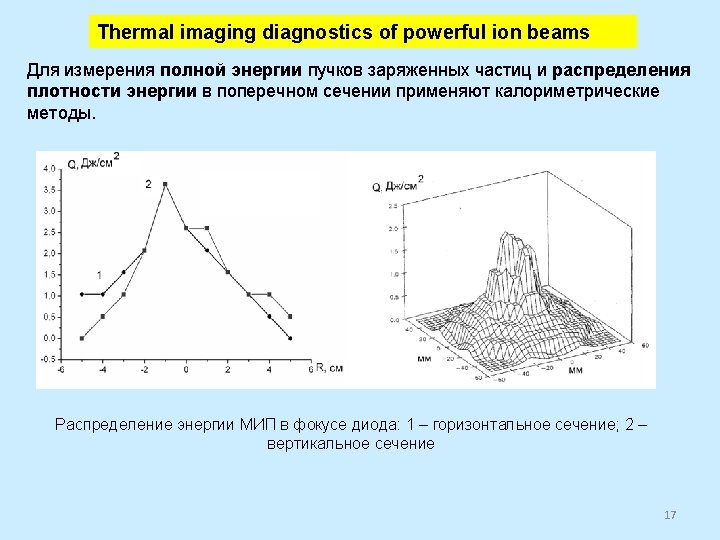
Thermal imaging diagnostics of powerful ion beams Использовать тепловизор для измерения распределения плотности энергии импульсного ионного пучка впервые предложили в 1997 году Davis, Bartsch, Olson, Rej, and Waganaar H. A. Davis, R. R. Bartsch, J. C. Olson, D. J. Rej, and W. J. Waganaar // J. Appl. Phys. 82 (7), 3223 (1997). 18
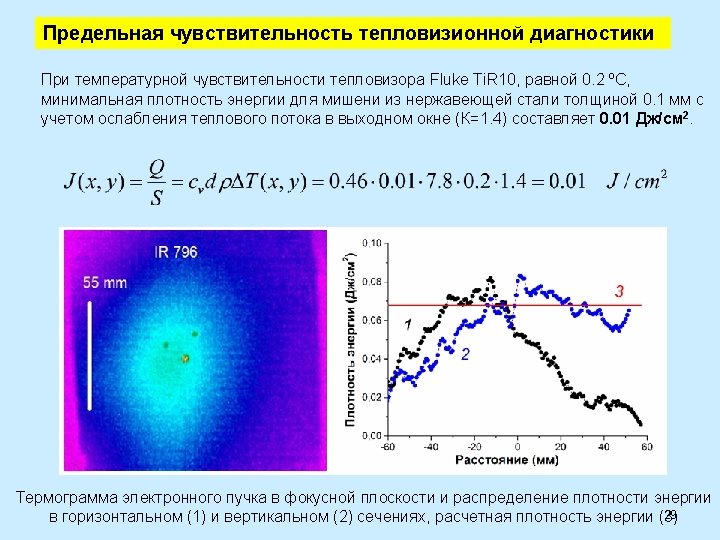
1. Thermal imaging diagnostics of powerful ion beams Unfocused beam energy density. The outer diameter of the beam is 29 cm. The beam profile for the focused beam. The outer diameter of the beam footprint is 15 cm. 19
1. Thermal imaging diagnostics of powerful ion beams Smart. View™ Isakova Yu. I. , Pushkarev A. I. Thermal imaging diagnostics of powerful ion beams // Instruments and 20 Experimental Techniques, 2013, Vol. 56, No. 2, pp. 185– 192
Calibration of the IR-diagnostics Fluke Ti. R 10 Diode assembly scheme Calibration curve for the Ca. F 2 window. 21
Calibration of the IR-diagnostics Calibration of transparency for the Ba. F 2 (1) and Ca. F 2 (2) windows Градуировочные графики для окна из Ba. F 2 в начале экспериментов (1) и через месяц (2) 22
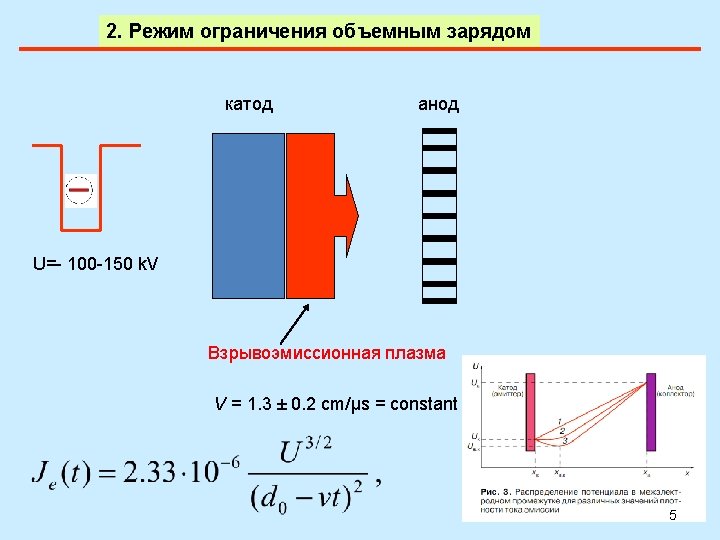
1. Thermal imaging diagnostics of powerful ion beams The energy density calculation The amount of energy Q, released in the target under exposure is equal to where сv is the specific heat capacity, S is the area of the target, d is the thickness of the target, ρ is the density, and ΔТ is the target heating. Then, the PIB energy density J(x, y), J/cm 2: 23
The time required for raising the temperature of the target After target heating by ion beam, the temperature of the other surface was viewed with the infrared camera. The time τ0. 5, required for raising the temperature of the rear (with respect to beam) surface of the target by 50% from the maximum can be calculated from the ratio Метод Паркера where d is the thickness of target; a is the temperature conductivity. Для мишени из нержавеющей стали толщиной 100 мкм (температуропроводность 1. 5· 10 -5 м 2/c) время прогрева по всей толщине не превышает 0. 25 мс. Parker W. J. , Jenkins R. J. , Butler C. P. and Abbott G. L. Flash Method of Determining Thermal Diffusivity, Heat Capacity, and Thermal Conductivity // J. Appl. Phys. – 1961. 32. 679. 24
1. Thermal imaging diagnostics of powerful ion beams В работе Xiao Yu представлены результаты расчета продолжительности прогрева мишени te, которое соответствовало выравниванию температуры по глубине с градиентом лицевой и тыльной сторон мишени менее 0. 02 K. Зависимость продолжительности прогрева мишени от ее толщины Xiao Yu, Jie Shen, Miao Qu, Haowen Zhong, Jie Zhang, Yanyan Zhang, Sha Yan, Gaolong Zhang, Xiaofu Zhang, Xiaoyun Le. Distribution and evolution of thermal field formed by intense pulsed ion beam on thin metal target // Nuclear Instruments and Methods in Physics Research B 365 (2015) P. 225– 229. 25
Study of target cooling The X-ray absorbed dose for one pulse at a distance of 20 cm from the output flange of the accelerator exceed 0. 5 m. Sv at a daily rate of 6 m. Sv. t = 2 s t = 6 s t = 9 s The distribution of the stainless steel target temperature in the horizontal section 30
Study of target cooling Infrared image of the target with a cupper central disc. Temperature distributions in horizontal direction before (1) and 0. 2 (2), 5 (3), 10 (4) and 20 s (5) after HIPIB irradiation 31
Study of target cooling The dependence of the total beam energy measured by thermal imaging method on the delay in registration of thermal imprint on the target 32
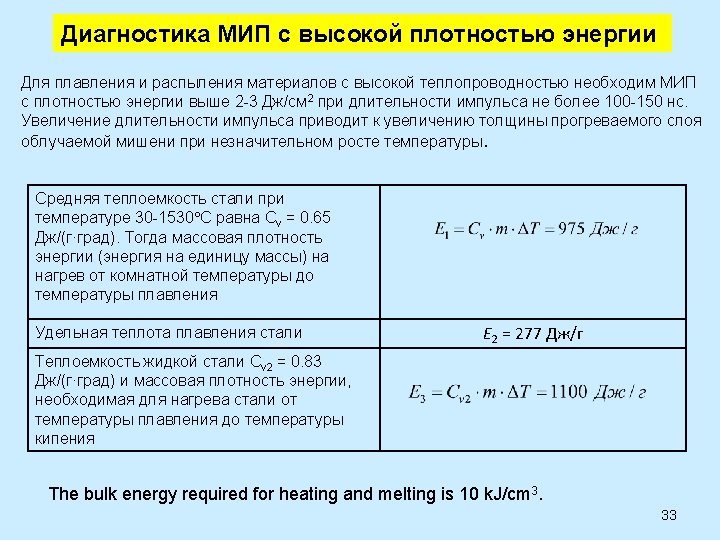
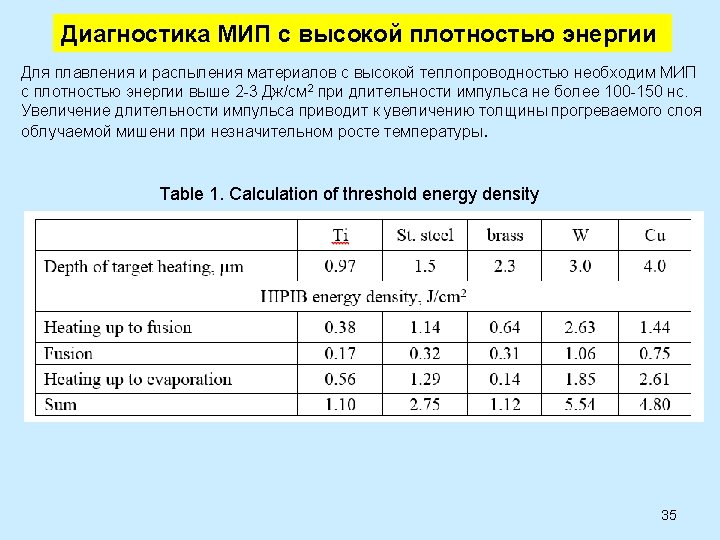
Диагностика МИП с высокой плотностью энергии The bulk energy required for heating and melting is 10 k. J/cm 3. Linear energy losses of C+ ions (1) and temperature distribution in stainless steel (a) and cupper (b) targets irradiated with ion beam at different times after interception with the beam: 50 ns (2), 75 ns (3) and 100 ns (4) 34
Диагностика МИП с высокой плотностью энергии HIPIB energy density distribution in focus in vertical (1) and horizontal (2) directions. Large target from brass 75 m (a) and titanium (b) 36
Диагностика МИП с высокой плотностью энергии HIPIB energy density in focus Relative overheating we calculated as: Jmax - HIPIB energy density in focus, Jth - threshold energy density. 37
Диагностика МИП с высокой плотностью энергии Dependence of absorbed energy density (1, 3) and threshold energy density (2, 4) on the incident energy density. Target from stainless steel (a), titanium (b) and results from [Davis] (3, 4) 38
Диагностика МИП с высокой плотностью энергии Dependence of an error of energy density measurement on HIPIB energy density at use of a target from titanium (1), stainless steel (2) and brass (3) The error of measurement is: 39
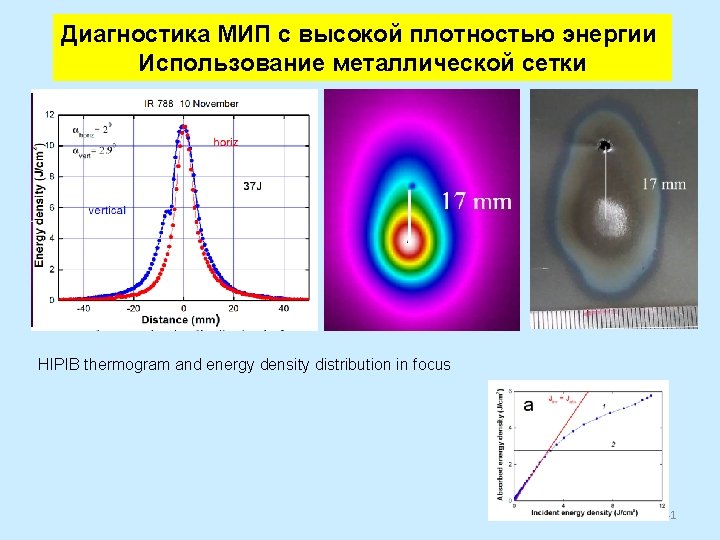
Диагностика МИП с высокой плотностью энергии Использование металлической сетки Energy density distribution in horizontal direction for different modes measurement 40
Study of a strip planar diode with self-magnetic insulation Schematic of the strip planar diode with self-magnetic insulation: potential electrode (1), grounded electrode (2); collimated Faraday cup (3), and Rogowski coil 42
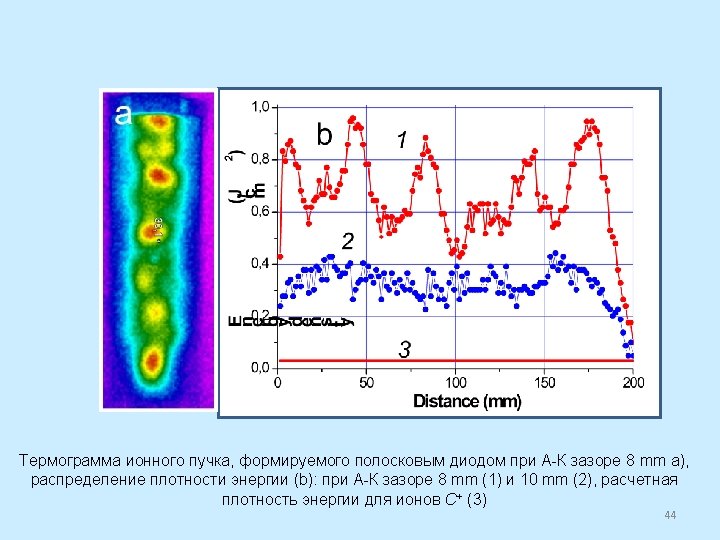
Thermal imprints of the ion beam and energy density distribution on the target 43
Thermal imprints of the ion beam and energy density distribution on the target 45 45
исходный фон мишени Photograph of a diode and energy density distribution on the target 46
Spiral self-magnetically insulated ion diode A. I. Pushkarev, Yu. I. Isakova A spiral self-magnetically insulated ion diode // Laser and Particle Beams, 47 2012, volume 30, issue 03, pp. 427 -433.