Lecture 17 Curve Sketching Last Lectures Summary We


 at the two endpoints of the domain [f(xl)")


 at the endpoints of the domain are")
, f (6), and f (10), we find the absolute")


- Slides: 35
Lecture 17 Curve Sketching
Last Lecture’s Summary We covered Sec 16. 2: Identification of Maxima and Minima • Relative Extrema (maxima and minima) • Absolute Maxima and Minima • Critical Points • First and Second Derivative Tests for Relative Extrema
Today We will cover sections 16. 3 and 16. 4: • Curve Sketching • Restricted Domain Considerations • Procedure for Identifying Absolute Maxima and Minima
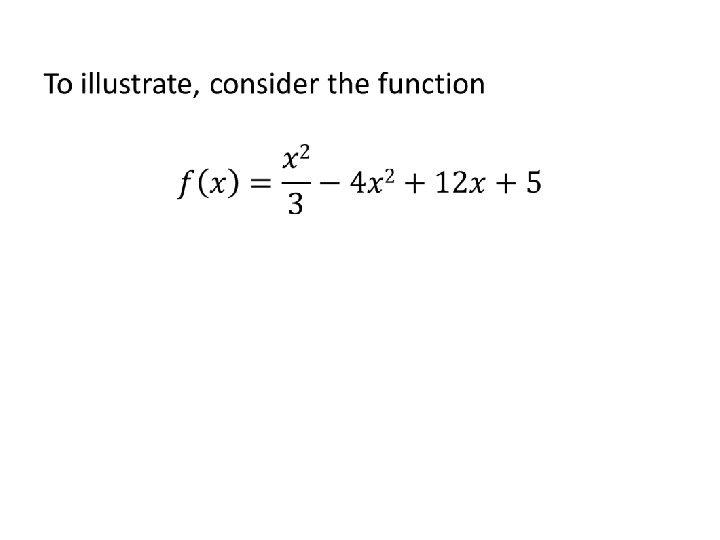
Curve Sketching functions is facilitated with the information we have acquired in this chapter. One can get a feeling for the general shape of the graph of a function without determining and plotting a large number of ordered pairs.
Key Data Points In determining the general shapes of the graph of a function, the following attributes are the most significant. • • Relative maxima and minima. Inflection points. x and y intercepts. Ultimate direction
1 - Relative Maxima and Minima •
2 - Inflection Points •
3 - Intercepts •
4 - Ultimate Direction •
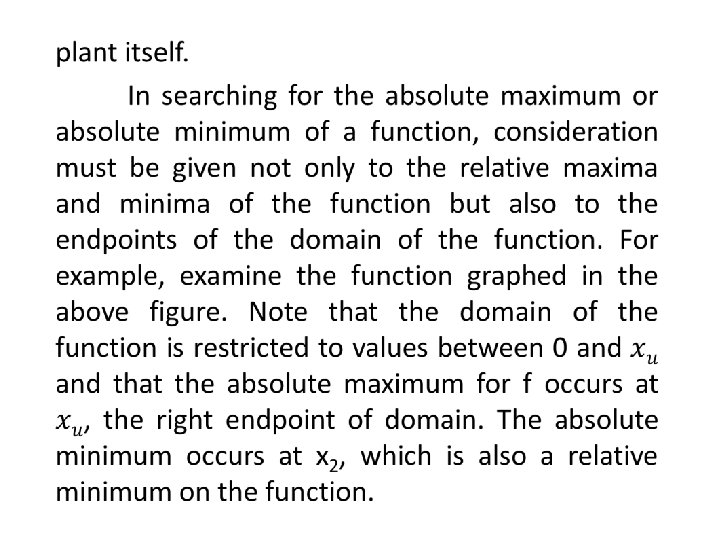
RESTRICTED-DOMAIN CONSIDERATIONS In this section we will examine procedures for identifying absolute maxima and minima when the domain of a function is restricted.
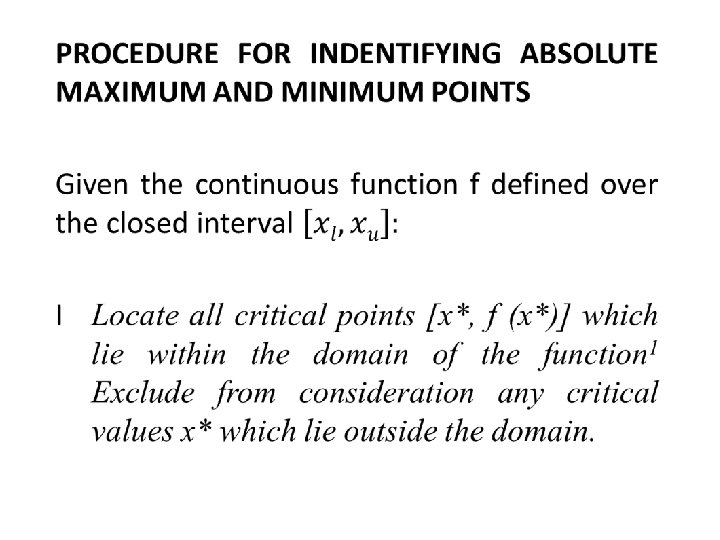
II Compute the values of f(x) at the two endpoints of the domain [f(xl) and f(xu). III Compare the values of f(x*) for all relevant critical points with (xl) and (xu). The absolute maximum in the largest of these values. The absolute minimum is the smallest of these values.
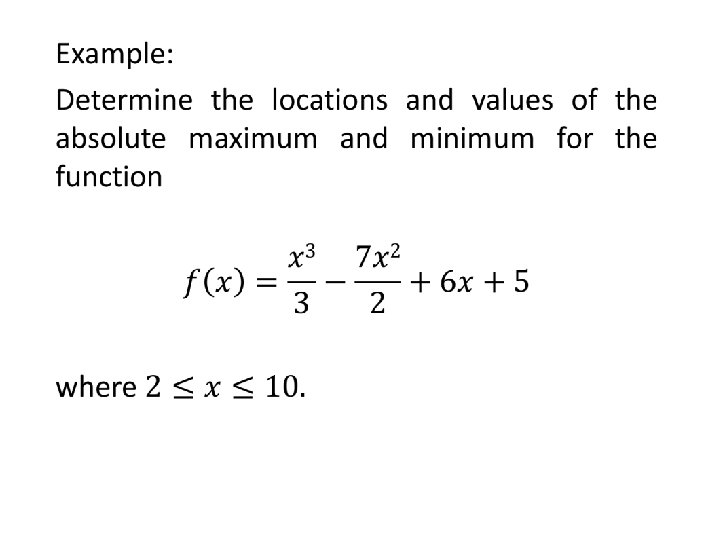
Step II The values of f (x) at the endpoints of the domain are
Step III Comparing f (2), f (6), and f (10), we find the absolute minimum of -13 occurs when x = 6 and the absolute maximum of 481/3 occurs when x = 10. The figure presents a sketch of the function.
Review Covered sections 16. 3 and 16. 4: • Curve Sketching • Restricted Domain Considerations • Procedure for Identifying Absolute Maxima and Minima Next, we’ll start Chapter 17: Application of Optimization.