Lecture 17 BIOLOGICAL PRODUCTIVITY AND ENERGY TRANSFER Chapters

Lecture 17: BIOLOGICAL PRODUCTIVITY AND ENERGY TRANSFER Chapters 13 -16

• Bigger fish eats big fish • Big fish eats little fish • And so on • Sometimes predators pick on prey bigger than themselves

PRIMARY PRODUCTIVITY • Rate at which energy is stored in organic matter • Photosynthesis using solar radiation • Chemosynthesis using chemical reactions • 99. 9% of marine life relies directly or indirectly on photosynthesis for food
")
PHOTOSYNTHETIC PRODUCTIVITY • Chemical reaction that stores solar energy in organic molecules (chemical energy) Fig. 13. 2

CHEMOSYNTHESIS Fig. 13. 4 • Energy to bond carbon atoms into glucose comes from breaking the bonds between sulfur and hydrogen • No sunlight is required • Bacteria and archaea

• Flow of energy through living systems • Stored energy released when food is used for growth, movement, repair and reproduction • Produces waste heat which is transferred to space • One-way flow of energy Fig. 13. 3
 – Total amount of organic carbon produced")
PHOTOSYNTHETIC PRODUCTIVITY • Gross primary production (GPP) – Total amount of organic carbon produced by photosynthesis per unit time in certain area • Net primary production (NPP) – Gross primary production minus cellular respiration (NPP = organic carbon remaining for growth, reproduction or GPP - Respiration) • New production – Proportion of production supported by nutrients added to local ecosystem (e. g. , upwelling) • Regenerated production – Proportion of production supported by recycled nutrients within ecosystem

NEW PRODUCTION
 –")
FACTORS AFFECTING PRIMARY PRODUCTIVITY • Nutrients – Nitrate, phosphorous, iron, silica, vitamins(? ) – Most from river runoff and deep water – Productivity high along continental margins, where nutrients are plentiful (but light can be limiting) • Solar radiation – Uppermost surface seawater and shallow seafloor – Euphotic zone from surface to about 100 m (330 ft), depends on water clarity

NUTRIENTS:

LIGHT IN THE OCEAN Fig. 13. 15

LIGHT TRANSMISSION IN THE OCEAN • Color of ocean ranges from deep blue to yellowgreen • Limiting factors – Turbidity and colored chemicals from runoff – Sun’s angle of incidence – Photosynthetic pigment (chlorophyll) • Eutrophic – highly productive, lots of nutrients (green water) • Oligotrophic – low productivity, limited nutrients (blue water)

FACTORS AFFECTING PRIMARY PRODUCTIVITY • Temperature - establishes upper limit for cellular growth by controlling nutrient transport and biochemical reaction rates • Compensation depth - depth where production = consumption - depth to which 1% of surface light penetrates, bottom of euphotic zone - deeper the phytoplankter, the less light it receives

COMPENSATION DEPTH Fig. 14. 11

OCEAN PRODUCTIVITY • Primary productivity = grams of carbon bound into organic material per square meter of ocean surface area per year (g. C/m 2/yr) Net primary productivity Fig. 13. 5

OCEAN COLOR Fig. 13. 6 • Chlorophyll – green pigment responsible for trapping sunlight required for photosynthesis
 algae")
TYPES OF PHOTOSYNTHETIC MARINE ORGANISMS • Anthophyta – Seed-bearing plants • Macroscopic (large) algae = seaweeds • Microscopic (small) algae = phytoplankton • Photosynthetic bacteria = cyanobacteria and photoheterotrophs

ANTHOPHYTA ‘HIGHER PLANTS’ • Only in shallow, clear coastal waters • Primarily sea grasses and marsh grasses • Mangroves

MACROSCOPIC ALGAE • “Seaweeds” - intertidal and subtidal in relatively clear shallow water • Small portion of ocean’s total primary productivity, but important for biodiversity • Brown algae - kelps • Green algae • Red algae (most abundant and most widespread)
 Green algae - “Dead Man’s Fingers” Brown algae")
Brown algae - Sargassum (Sargasso Sea) Green algae - “Dead Man’s Fingers” Brown algae - kelp Red algae - encrusting

MANGROVES AND KELP FORESTS Figs. 14. 18; 14. 19; 14. 21

MICROSCOPIC ALGAE • Produce food for 99% for marine animals • Most planktonic • Golden algae – Diatoms (tests of silica) – Coccolithophores (plates of calcium carbonate) • Dinoflagellates – Red tide (harmful algal bloom) (toxins, fish kills, human illness) • Flagellated, non-motile and colonial microalgae – very diverse assortment of species found globally
 Diatom – lives in “glass house” shell made of silicon dioxide (c)")
MICROALGAE (a) Diatom – lives in “glass house” shell made of silicon dioxide (c) Dinoflagellate – coated with organic theca (cell wall) (b) Coccolithophorid – coated with calcium carbonate disks

MICROALGAE Figs. 14. 5; 14. 7; 14. 8

PHYTOPLANKTON diatoms dinoflagellates diatom dinoflagellate

PHOTOSYNTHETIC BACTERIA • Cyanobacteria & photoheterotrophic bacteria • Extremely small and physically non-descript • Can only be confidently identified by biochemical and genetic techniques • May be responsible for half of total photosynthetic biomass in oceans

Plankton recognizable only by molecular techniques cyanobacteria heterotrophic bacteria & archaea some microalgae diatom

REGIONAL PRIMARY PRODUCTIVITY • Varies from very low to very high depending on – Distribution of nutrients – Seasonal changes in solar radiation • About 90% of surface biomass decomposed in surface ocean • About 10% sinks to deeper ocean below 200 m • Only 1% organic matter not decomposed in deep ocean and deposited on seafloor • Biological pump (CO 2 and nutrients to sea floor sediments)

BIOLOGICAL PUMP
 bloom Zooplankton (mainly small crustaceans)")
POLAR OCEAN PRODUCTIVITY Winter darkness Summer sunlight Phytoplankton (diatoms) bloom Zooplankton (mainly small crustaceans) productivity follows • Example Arctic Ocean • •

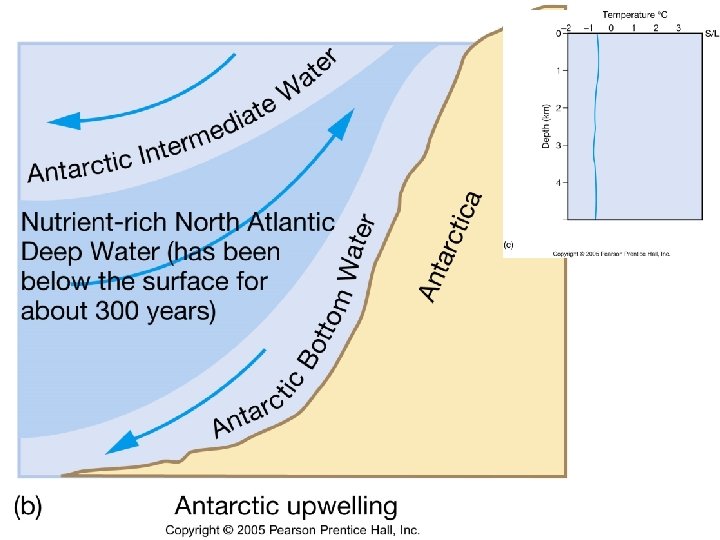
POLAR OCEAN PRODUCTIVITY • Availability of sunlight and • High nutrients due to upwelling of North Atlantic Deep Water – No thermocline – No barrier to vertical mixing • Blue whales migrate to feed on maximum zooplankton productivity

TROPICAL OCEAN PRODUCTIVITY • • • Permanent thermocline is barrier to vertical mixing Low rate primary productivity (lack of nutrients) High primary productivity in areas of Equatorial upwelling Coastal upwelling Coral reefs – Symbiotic algae – Recycle nutrients within the ecosystem

WHY IS PRODUCTIVITY LOW IN TROPICAL OCEANS?

TEMPERATE OCEAN PRODUCTIVITY • Limited by both available sunlight and • Available nutrients • Highly seasonal pattern – Winter low (lots of nutrients, little sunlight due to low angle of incidence, deep mixing) – Spring high (spring bloom, more light, less mixing) – Summer low (lots of sunlight, little nutrients due to stratification) – Fall high (fall bloom, more mixing + nutrients)

TEMPERATE OCEAN PRODUCTIVITY

PRODUCTIVITY OF TEMPERATE OCEANS

REGIONAL PRODUCTIVITY

NUTRIENT FLOW IN MARINE ECOSYSTEMS Nutrients cycled from one chemical form to another Biogeochemical cycling Example, nutrients fixed by producers Passed onto consumers Some nutrients released to seawater through decomposers • Nutrients can be recycled through upwelling • • •

BIOGEOCHEMICAL CYCLING

ZOOPLANKTON CONSUME PRIMARY PRODUCERS Copepod Krill Ctenophore Figs. 14; 14. 15; 14. 16
 and environment")
ENERGY FLOW IN MARINE SYSTEMS • Ecosystem includes living organisms (biotic community) and environment • Solar energy converted to chemical energy by producers (mainly photosynthesis) • Consumers eat other organisms – Herbivores – Carnivores – Omnivores – Bacteriovores • Decomposers breaking down dead organisms or waste products

TROPHIC PYRAMID • Trophic pyramids - volume of each box proportional to size of biomass (standing stock) • Typical trophic transfer between compartments is 10%, but varies among ecosystems • Number of compartments depends on ecosystem (# increases moving offshore)

BIOMASS PYRAMID • Number of individuals and total biomass decrease at successive trophic levels • Organisms increase in size

PASSAGE OF ENERGY BETWEEN TROPHIC LEVELS

FOOD PARTITIONING IN HERBIVORE • Chemical energy is transferred from producers to consumers • Feeding stage is trophic level • About 10% of energy transferred to next trophic level

ALGAE SUPPORTED BIOTIC COMMUNITY

FOOD CHAIN VERSUS FOOD WEB Food chain • • Primary producer Herbivore One or more carnivores Somewhat antiquated model of real world • Food web • Branching network of many consumers • Consumers more likely to survive with alternative food sources • Probably most common and accurate model

FOOD CHAIN VERSUS FOOD WEB

OCEANIC FOOD WEB Fig. 13. 9

POLAR FOOD WEB • Polar example of energy transfer through food web • production of top consumers (carnivores and baleen whales) proportional to primary production http: //www. oceansonline. com/oceanicfoodwebs. htm

MARINE FISHERIES • • • Commercial fishing Most from continental shelves Over 20% from areas of upwelling that make up 0. 1% of ocean surface area

OVERFISHING • • Taking more fish than sustainable Remaining fish young, small About 30% of fish stocks depleted or overfished About 47% fished at biological limit

INCIDENTAL CATCH OR BYCATCH • Non-commercial species taken incidentally by commercial fishers • Bycatch may be 25% or 800% of commercial fish – Birds, turtles, dolphins, sharks – Dolphin-safe tuna • Driftnets or gill nets banned in 1989 Fig. 17. 21

FISHERIES MANAGEMENT • Regulate fishing • Conflicting interests • Human employment • Self-sustaining marine ecosystems (within reason - if human impacts exceed some threshold, system does not return to previous state) • Marine reserves (patches of habitat made off-limits) • International waters • Enforcement difficult

FISHERIES MANAGEMENT • Many large fishing vessels • 1995 world fishing fleet spent $124 billion to catch $70 billion worth of fish Fig. 17. 20 Fig. 17. 15

FISHERIES MANAGEMENT • Northwest Atlantic Fisheries such as Grand Banks and Georges Bank • Canada and U. S. restrict fishing and enforce bans • Some fish stocks in North Atlantic rebounding • Other fish stocks still in decline (e. g. , cod)

FISHERIES MANAGEMENT • Consumer choices in seafood • “Choices” continually change as individual species become commercially extinct • Consume and purchase seafood from healthy, thriving fisheries – Examples, farmed seafood, Alaska salmon • Avoid overfished or depleted seafood – Examples, tuna, shark, shrimp
- Slides: 58