Lecture 13 The Stars The Nature of Stars


")


 Spectral classes might make more sense if arranged by temperature")


 Theory of thermal ionization")


")


 diagram identifies a definite relationship between temperature and absolute magnitude")
 diagram identifies a definite relationship between temperature and absolute magnitude")
 to bottom right (cool")


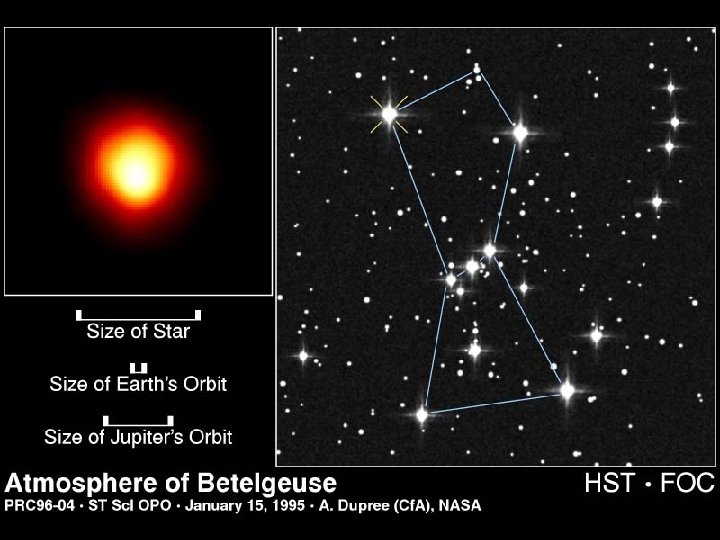


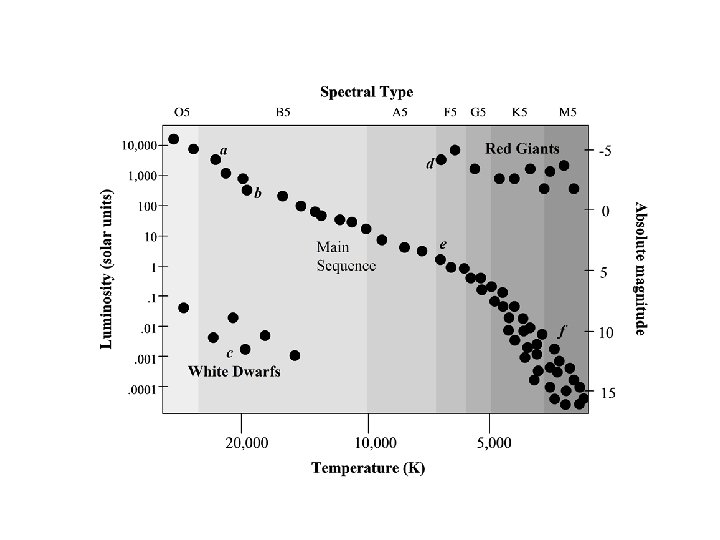


 diagram identifies a definite relationship between temperature and absolute magnitude")


")
 Gliese 581 g is")


")
 What is radial velocity and how does increasing it affect the Doppler shift?")


 KEPLER")
- Slides: 61
Lecture 13: The Stars –
The Nature of Stars • Classification of Stars • Birth and Death of Stars
Quick Review…
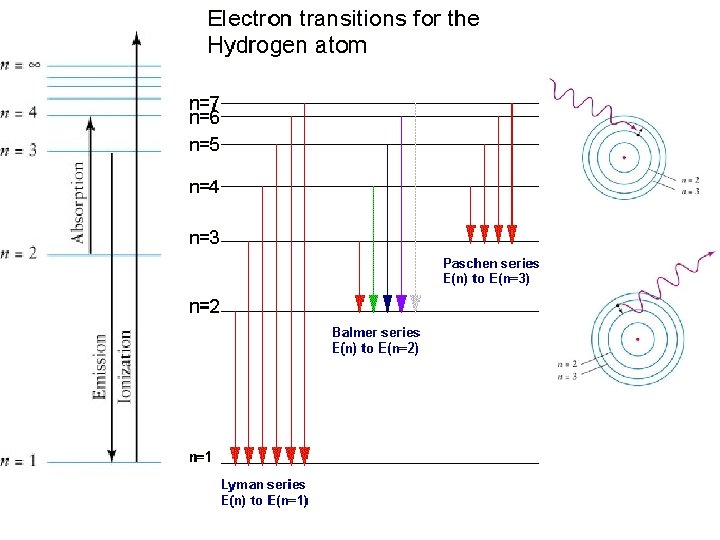
A star’s color reveals its surface temperature. What color is this star? Green Add absorption lines… present for all stars! Sun’s Blackbody Curve
• Wien's Law tells us that objects of different temperature emit spectra that peak at different wavelengths. • Hotter objects emit most of their radiation at shorter wavelengths; hence they will appear to be bluer/whiter. • Cooler objects emit most of their radiation at longer wavelengths; hence they will appear to be redder. • Furthermore, at any wavelength, a hotter object radiates more (is more luminous) than a cooler one.
Spectra of Stars
Women Computers (1890)
Diversity Leads to Revolution • Annie Jump Cannon • Antonia Maury Both above contributed to identifying Stellar Classification Systems • Meghnad Saha Pressure and Temperatures of Stellar Atmospheres • Cecilia Payne-Gaposchkin: First to show Sun is mainly composed of ____.
Her work cataloging stars was integral to the development of our contemporary classification system Annie Jump Cannon (1863 -1941)
Classification Scheme A B C D E. . . S Where “A” stars had the most Hydrogen and “S” stars had the least Hydrogen!
Antonia Maury (1866 -1952) Spectral classes might make more sense if arranged by temperature
Absorption Line Spectra of Stars Wavelength increases to right O B A Temperature increases as go up F Mnemonic: G Oh Be a Fine Girl (Guy) Kiss Me K M
A Revolution • Most astronomers believed that the differences in spectral lines were due to subtle differences in chemical abundance. • Indian physicist Meghnad Saha offered another explanation, which was confirmed at Harvard by Cannon and Maury’s work.
Pressure and Temperatures of Stellar Atmospheres Meghnad Saha (1893 -1956) Theory of thermal ionization of atoms
First to show that the Sun & stars are mainly composed of hydrogen, contradicting accepted wisdom at the time. Cecelia Payne-Gaposchkin (1900 -1979) First Ph. D in Astronomy from Harvard/Radcliffe
Together Saha and Payne. Gaposchkin • Gave theoretical explanation for Cannon’s classification scheme. • Showed that the differences in spectra (absorption lines) are due to temperature and thermal ionization of atoms not abundance of elements • Provided a convincing argument that stars are mostly made of hydrogen.
Stars are classified by their spectra as O, B, A, F, G, K, and M spectral types
What does this give us? A new way to classify stars: • color • peak wavelength of the black body curve • spectral class all of which are indicators of a star’s temperature
Summary of Spectral Classes (What type is our Sun? )
Stars are classified by their spectra as O, B, A, F, G, K, and M spectral types • • OBAFGKM hottest to coolest bluish to reddish Each spectral type is now broken up into 10 s temperature sub-ranges. 0 (hottest) to 9 (coolest) • An important sequence to remember: – – Oh Be a Fine Guy (or Girl), Kiss Me Overseas Broadcast - A Flash: Godzilla Kills Mothra Over-Budget Adult Films Give Knights Merriment One Boring Afternoon, Frank Grew Killer Marijuana
Looking for correlations: Height vs. IQ ? Height vs. Weight ?
QUESTIONS: • Are more luminous stars always larger? • What combinations of temperature and luminosity are possible?
THE H-R DIAGRAM • done independently by Enjar Hertzsprung and Henry Norris Russell • graph of luminosity (or absolute magnitude, M) versus temperature (or spectral class)
The Hertzsprung. Russell (H-R) diagram identifies a definite relationship between temperature and absolute magnitude HR DIAGRAM absolute magnitude vs temperature or luminosity vs spectral type
The Hertzsprung. Russell (H-R) diagram identifies a definite relationship between temperature and absolute magnitude HR DIAGRAM absolute magnitude vs temperature or luminosity vs spectral type
MAIN SEQUENCE • Goes from top left (hot and bright) to bottom right (cool and dim). • 90% of the stars are in the Main Sequence stage of their lives • Includes our Sun.
• Main Sequence stars are found in a band from the upper left to the lower right
RED GIANTS • Really Big, Not Very Hot but VERY BRIGHT! • Betelgeuse: 3500 K , 100, 000 times more luminous than the sun • radius must be 1000 x that of Sun!
• Red Giant and Supergiant stars are found above and to the right of the Main Sequence stars
WHITE DWARFS • Very Small, Very Hot but Not Very Bright • Sirius B: 27, 000 K, but gives off 1000 times less light than the Sun • 100 times smaller than the Sun
One of the nearest globular clusters in the sky.
• Tiny White Dwarf stars are found in the lower left corner of the HR diagram
Determining the Sizes of Stars from an HR Diagram • The Smallest stars are the tiny White Dwarf stars and are found in the lower left corner of the HR diagram • Main sequence stars span a range of sizes from the small found in the lower right to the large found in the upper left • The largest stars are the Giant and Supergiant stars which are found in the upper right corner
Determining the Sizes of Stars from an HR Diagram • The Smallest stars are the tiny White Dwarf stars and are found in the lower left corner of the HR diagram • Main sequence stars span a range of sizes from the small found in the lower right to the large found in the upper left • The largest stars are the Giant and Supergiant stars which are found in the upper right corner
How does the size of a star near the top left of the H-R diagram compare with a star of the same luminosity near the top right of the H-R diagram? A. They are the same size. B. The star near the top left is larger. C. The star near the top right is larger. D. There is insufficient information to determine this. 0/0
The star Rigel is about 100, 000 times brighter than the Sun and belongs to spectral type B 8. The star Sirius B is about 3000 times dimmer than the Sun and assume that it also belongs to spectral type B 8. Which star has the greatest surface temperature? A. Rigel B. Sirius B C. They have the same temperature. D. There is insufficient information to determine this. 0/0
The Hertzsprung. Russell (H-R) diagram identifies a definite relationship between temperature and absolute magnitude HR DIAGRAM absolute magnitude vs temperature or luminosity vs spectral type
Which is hotter a B 3 or an A 7? Which is hotter a B 0 or a B 9?
B 0 B 9
What about the Masses of Stars on the H-R Diagram? • Main Sequence stars range from 0. 1 M to ~100 M • The masses of Main Sequence stars increase with increasing luminosity, size and temperature • Main Sequence stars increase in mass from the lower right to the upper left of the H-R Diagram
There is a relationship between mass and luminosity for Main Sequence stars Bigger (more massive) is brighter and hotter!
There is a relationship between mass and luminosity for Main Sequence stars the numbers shown are masses in terms of the Sun’s mass Bigger (more massive) is brighter and hotter!
There is not a simple relationship for the Mass of Non-Main Sequence stars: • Giants and Supergiants: range from M to about 20 M • White Dwarfs: approximately M or less
Average Densities: • SUN: about density of water • GIANTS: One thousand times less dense than AIR! • DWARFS: about 1 million times the Sun’s density – one teaspoon: 5 tons!!!
Extrasolar Planets (Exoplanets)
One of the latest discovered Exoplanets: (reported September 29, 2010) Gliese 581 g is the first planet found to lie squarely in its star’s habitable zone, where the conditions are right for liquid water. The new planet is about three times the mass of Earth, which indicates it is probably rocky and has enough surface gravity to sustain a stable atmosphere.
Gliese 581 g – Habitable Exoplanet? http: //www. wired. com/wiredscience/2010/09/ real-habitable-exoplanet/ It orbits star once every 36. 6 Earth days at a distance of just 13 million miles (1 Astronomical Unit = 92955 887. 6 miles) Is this exoplanet closer to its sun than we are to our Sun, or farther away? Whose LAW tells you?
The discovery is based on 11 years of observations using the HIRES spectrometer at the Keck Telescope in Hawaii, combined with data from the HARPS (High-Accuracy Radialvelocity Planet Searcher) instrument at the European Southern Observatory in La Silla, Chile. The surface of a planet that close to our sun would be scorching hot. But because the star Gliese 581 is only about 1 percent as bright as the sun, temperatures on the new planet should be much more comfortable. Taking into account the presence of an atmosphere and how much starlight the planet probably reflects, astronomers calculated the average temperature ranges from minus 24 degrees to 10 degrees above zero Fahrenheit.
Gravity dictates that such a close-in planet would keep the same side facing the star at all times, the same way the moon always shows the same face to Earth. That means the planet has a blazing-hot daytime side, a frigid nighttime side, and a band of eternal sunrise or sunset where water — and perhaps life — could subsist comfortably. Any life on this exotic world would be confined to this perpetual twilight zone, Vogt says, but there’s room for a lot of diversity.
Extrasolar planets or Exoplanets G. Marcy and P. Butler HOW MANY EXOPLANETS FOUND TO DATE? Over 500!!
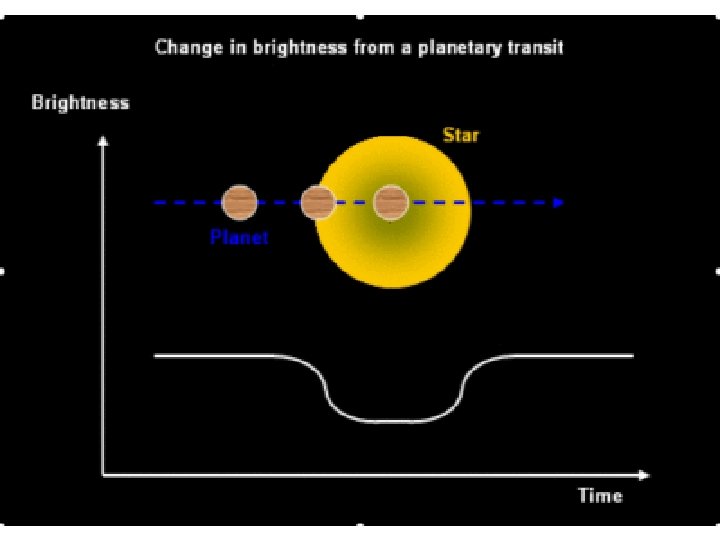
Planet detection and methods: 1. Doppler Shift 2. Pulsar Timing 3. Direct Imaging 4. Gravitational Lensing 5. Transit of planets in front of Star/Sun (method used by the K _ _ _ telescope)
Doppler shifts used to measure the radial velocity of the star's movement
Radial Velocity Curve (positive when moving away from observer)
1) What is radial velocity and how does increasing it affect the Doppler shift? 2) When is radial velocity defined to be positive? 3) What is the period of an orbit and how does the period of a star and its exoplanet compare? 4) What point do the star and its exoplanet orbit about? 5) Which direction does the exoplanet orbit if the Star orbits clockwise?
A Orbit of star Radial Velocity 20 m/s Earth 10 m/s D B Time -10 m/s - 20 m/s Orbit of planet C Given the location marked on the star's radial velocity curve, at what location in the planet's orbit (1 -4) would you expect the planet to be?
Given the location marked with the dot on the star’s radial velocity curve, at what location (A, B, C or D) would you expect the planet to be located at this time?
Transit of an Exoplanet across a sun. Demonstration! (note condition for viewing this) KEPLER TELESCOPE uses this method!