
Lecture 11 Segmentation and Grouping Gary Bradski Sebastian
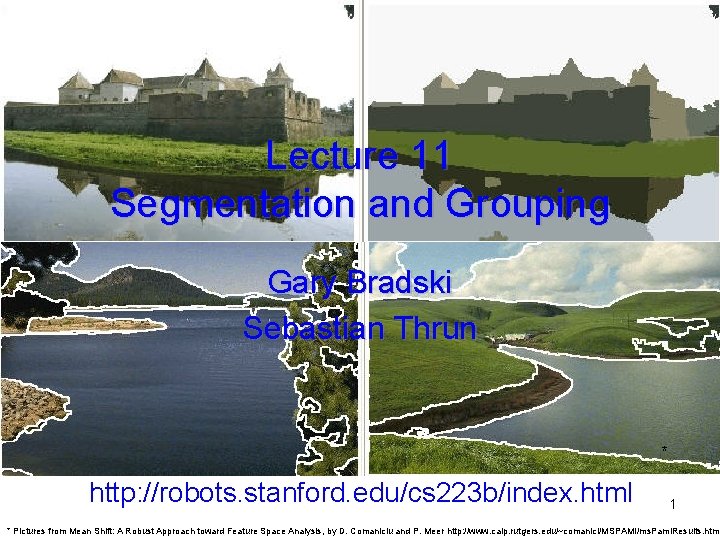
Lecture 11 Segmentation and Grouping Gary Bradski Sebastian Thrun * http: //robots. stanford. edu/cs 223 b/index. html 1 * Pictures from Mean Shift: A Robust Approach toward Feature Space Analysis, by D. Comaniciu and P. Meer http: //www. caip. rutgers. edu/~comanici/MSPAMI/ms. Pami. Results. html
Outline • Segmentation Intro – What and why – Biological Segmentation: • By learning the background • By energy minimization – Normalized Cuts • By clustering – Mean Shift (perhaps the best technique to date) • By fitting – optional, but projects doing SFM should read. Reading source: Forsyth Chapters in segmentation, available (at least this term) http: //www. cs. berkeley. edu/~daf/new-seg. pdf 2
Intro: Segmentation and Grouping What: Segmentation breaks an image into groups over space and/or time Why: • Motivation: – not for recognition – for compression • Relationship of sequence/set of tokens – Always for a goal or application • Currently, no real theory Tokens are – The things that are grouped (pixels, points, surface elements, etc. ) • top down segmentation – tokens grouped because they lie on the same object • bottom up segmentation – tokens belong together because of some local affinity measure • Bottom up/Top Dowon need not be mutually exclusive 3
Biological: Segmentation in Humans 4
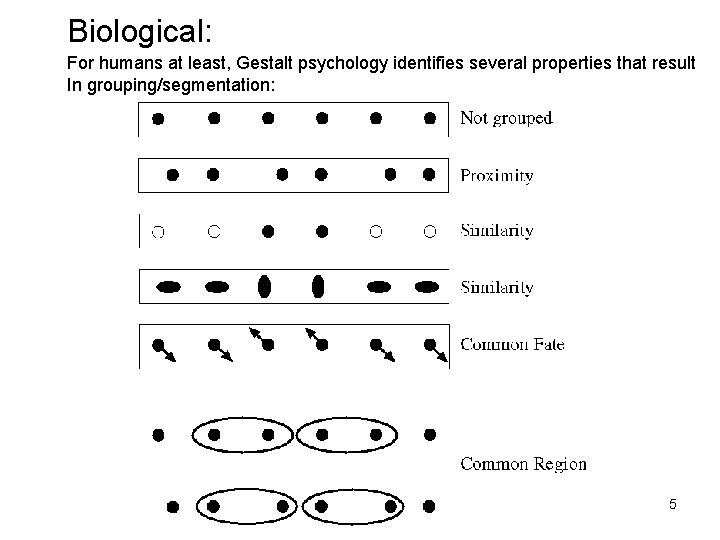
Biological: For humans at least, Gestalt psychology identifies several properties that result In grouping/segmentation: 5
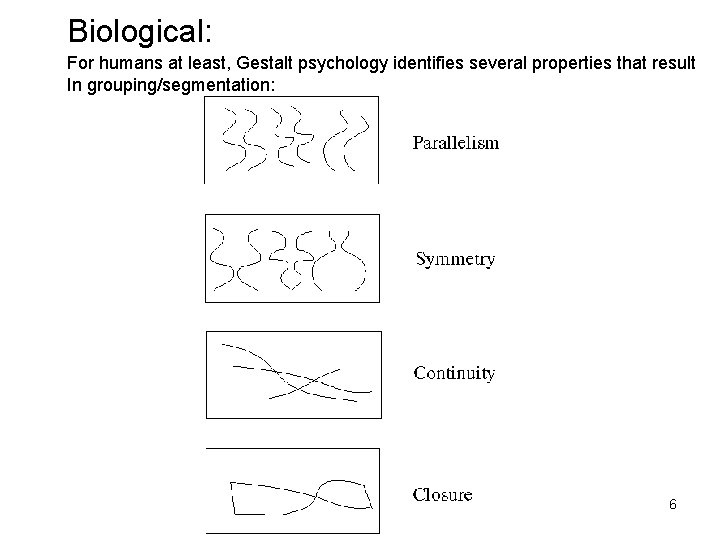
Biological: For humans at least, Gestalt psychology identifies several properties that result In grouping/segmentation: 6
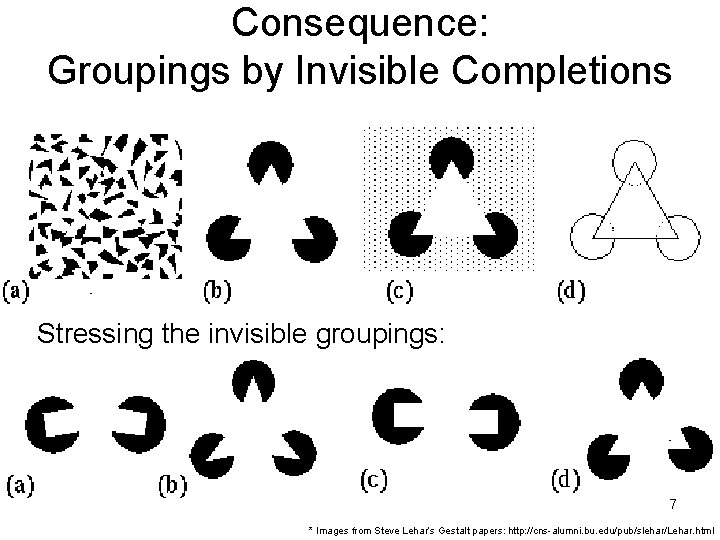
Consequence: Groupings by Invisible Completions Stressing the invisible groupings: 7 * Images from Steve Lehar’s Gestalt papers: http: //cns-alumni. bu. edu/pub/slehar/Lehar. html
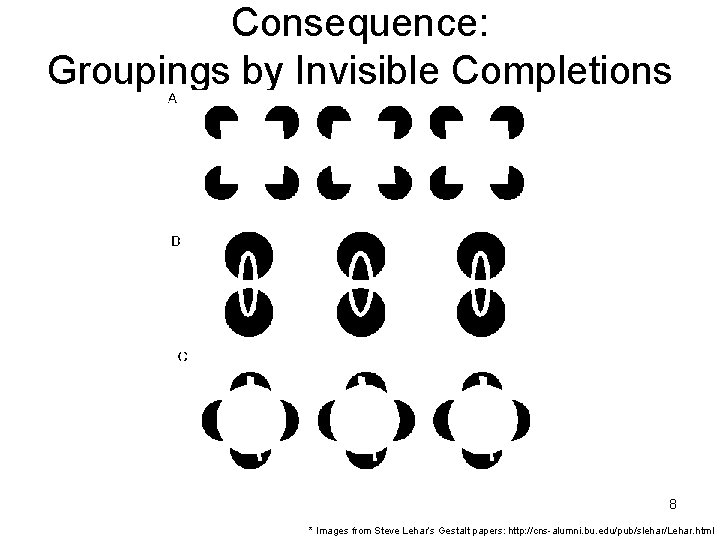
Consequence: Groupings by Invisible Completions 8 * Images from Steve Lehar’s Gestalt papers: http: //cns-alumni. bu. edu/pub/slehar/Lehar. html
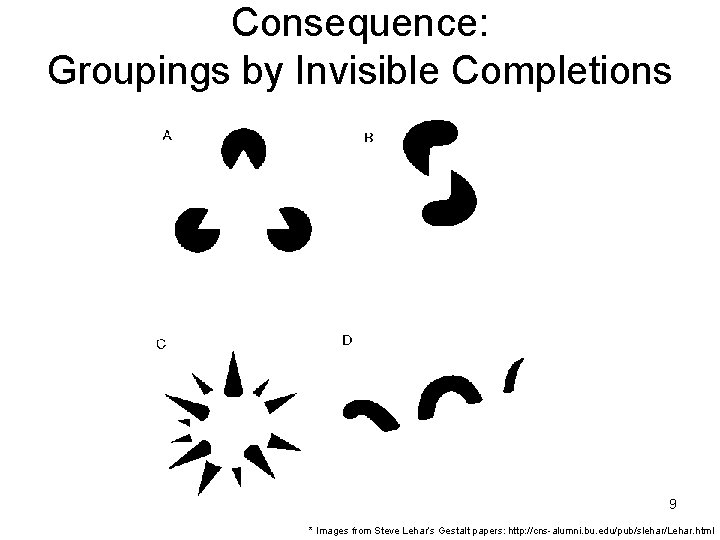
Consequence: Groupings by Invisible Completions 9 * Images from Steve Lehar’s Gestalt papers: http: //cns-alumni. bu. edu/pub/slehar/Lehar. html
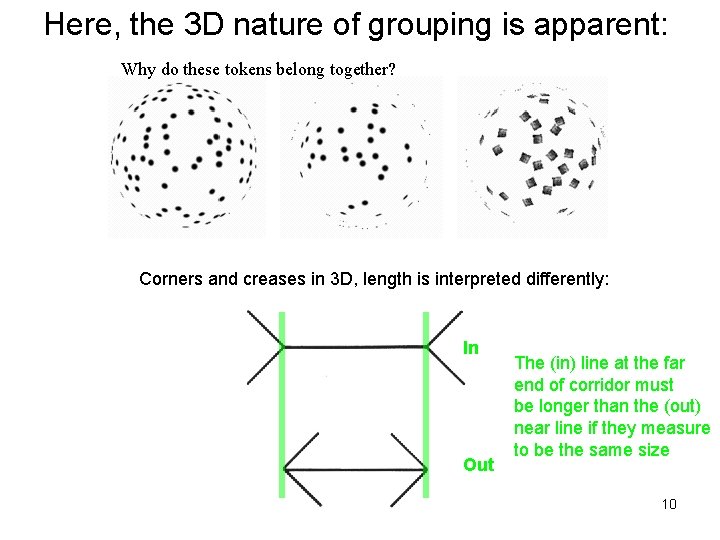
Here, the 3 D nature of grouping is apparent: Why do these tokens belong together? Corners and creases in 3 D, length is interpreted differently: In Out The (in) line at the far end of corridor must be longer than the (out) near line if they measure to be the same size 10
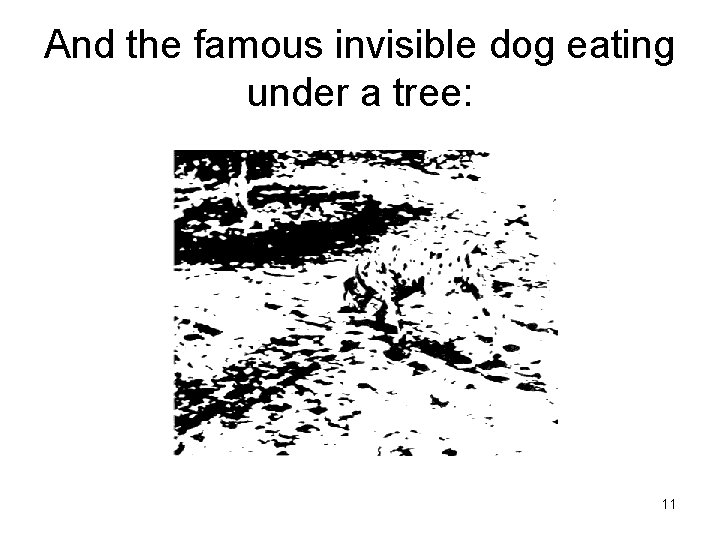
And the famous invisible dog eating under a tree: 11
Background Subtraction 12
Background Subtraction 1. Learn model of the background – 2. Take absolute difference with current frame – 3. 4. Pixels greater than a threshold are candidate foreground Use morphological open operation to clean up point noise. Traverse the image and use flood fill to measure size of candidate regions. – – 5. By statistics (m, s); mixture of Gaussians; Adaptive filter, etc Assign as foreground those regions bigger than a set value. Zero out regions that are too small. Track 3 temporal modes: (1) Quick regional changes are foreground (people, moving cars); (2) Changes that stopped a medium time ago are candidate background (chairs that got moved etc); (3) Long term statistically stable regions are background. 13
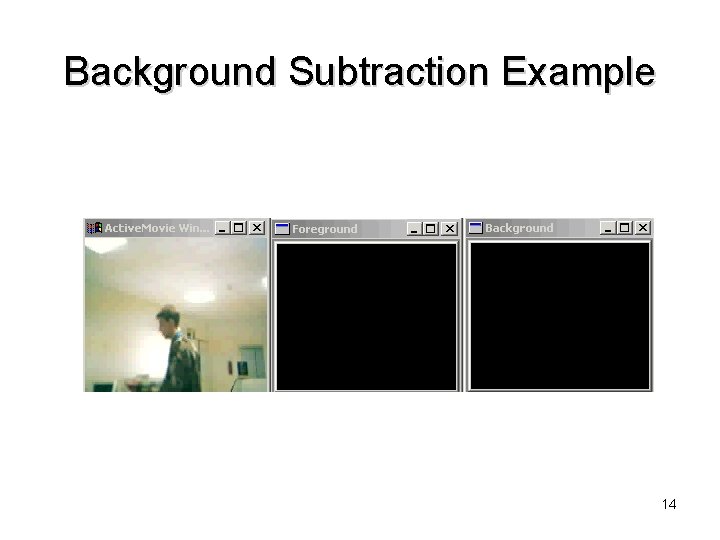
Background Subtraction Example 14
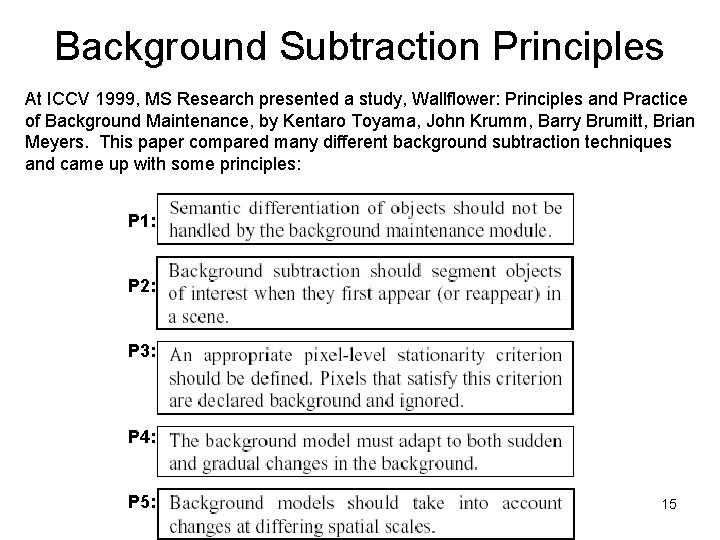
Background Subtraction Principles At ICCV 1999, MS Research presented a study, Wallflower: Principles and Practice of Background Maintenance, by Kentaro Toyama, John Krumm, Barry Brumitt, Brian Meyers. This paper compared many different background subtraction techniques and came up with some principles: P 1: P 2: P 3: P 4: P 5: 15
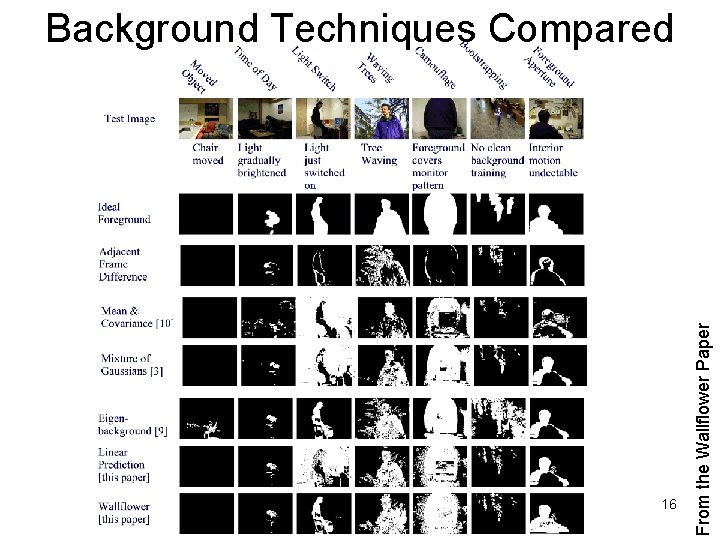
16 From the Wallflower Paper Background Techniques Compared
Segmentation by Energy Minimization: Graph Cuts 17
Graph theoretic clustering • Represent tokens (which are associated with each pixel) using a weighted graph. – affinity matrix (pi same as pj => affinity of 1) • Cut up this graph to get subgraphs with strong interior links and weaker exterior links Application to vision originated with Prof. Malik at Berkeley 18
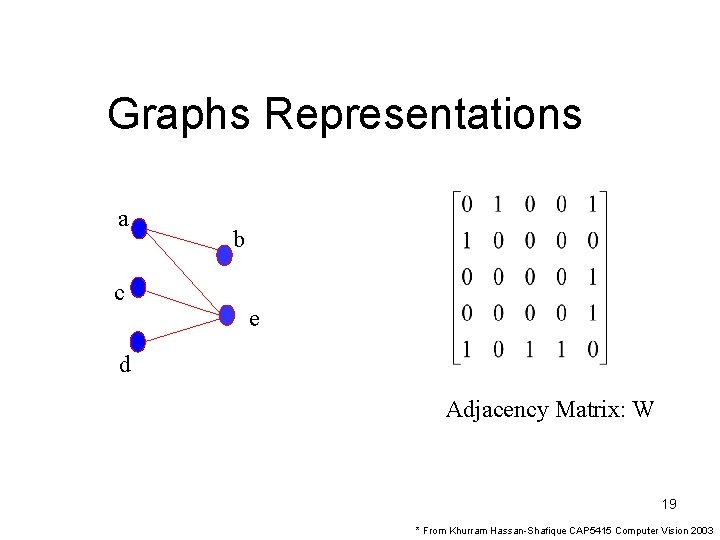
Graphs Representations a c b e d Adjacency Matrix: W 19 * From Khurram Hassan-Shafique CAP 5415 Computer Vision 2003
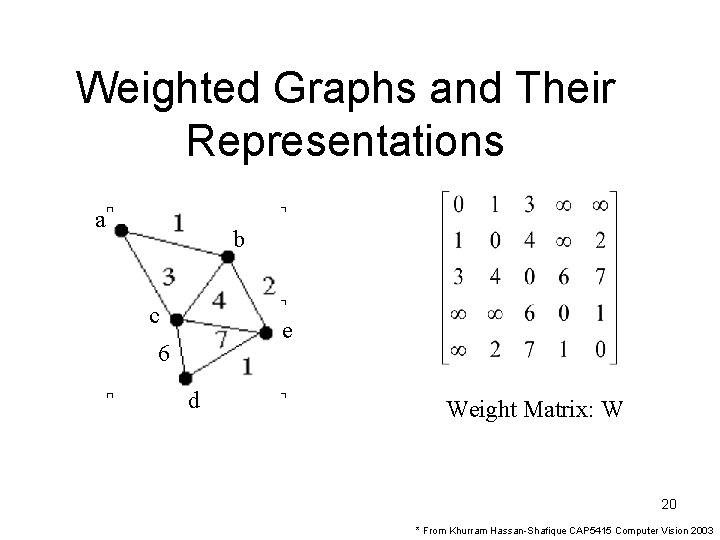
Weighted Graphs and Their Representations a b c e 6 d Weight Matrix: W 20 * From Khurram Hassan-Shafique CAP 5415 Computer Vision 2003
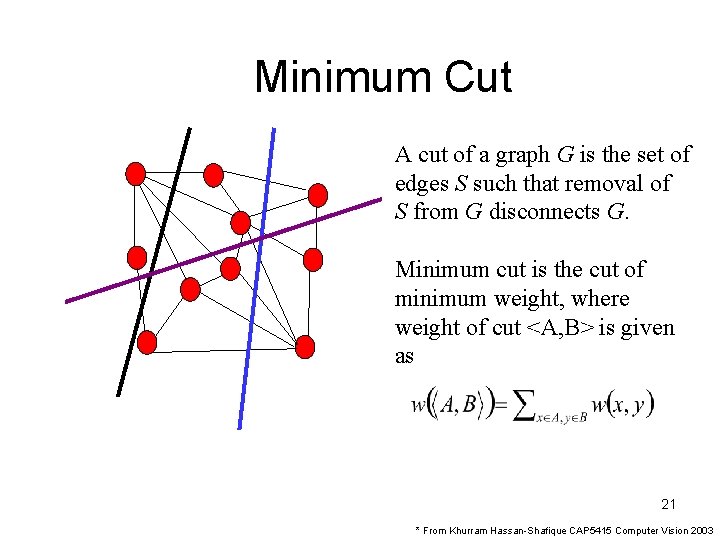
Minimum Cut A cut of a graph G is the set of edges S such that removal of S from G disconnects G. Minimum cut is the cut of minimum weight, where weight of cut <A, B> is given as 21 * From Khurram Hassan-Shafique CAP 5415 Computer Vision 2003
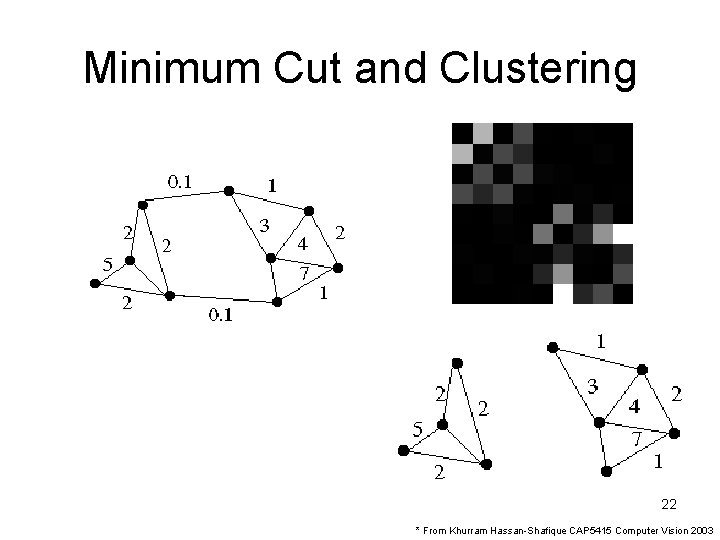
Minimum Cut and Clustering 22 * From Khurram Hassan-Shafique CAP 5415 Computer Vision 2003
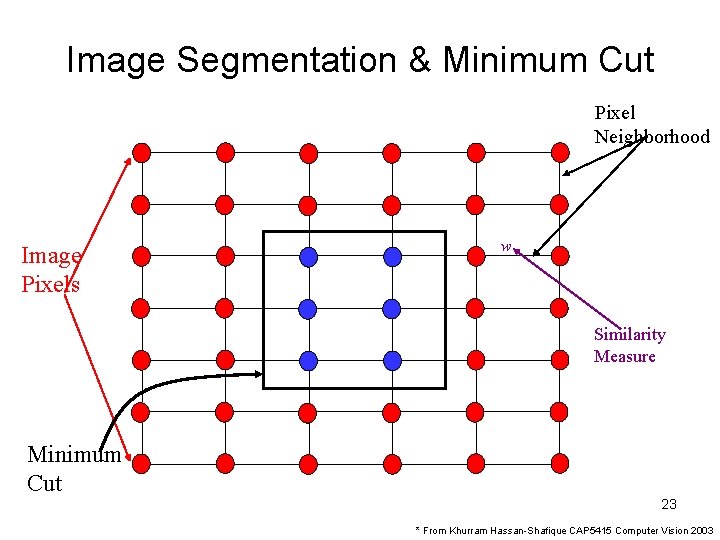
Image Segmentation & Minimum Cut Pixel Neighborhood Image Pixels w Similarity Measure Minimum Cut 23 * From Khurram Hassan-Shafique CAP 5415 Computer Vision 2003
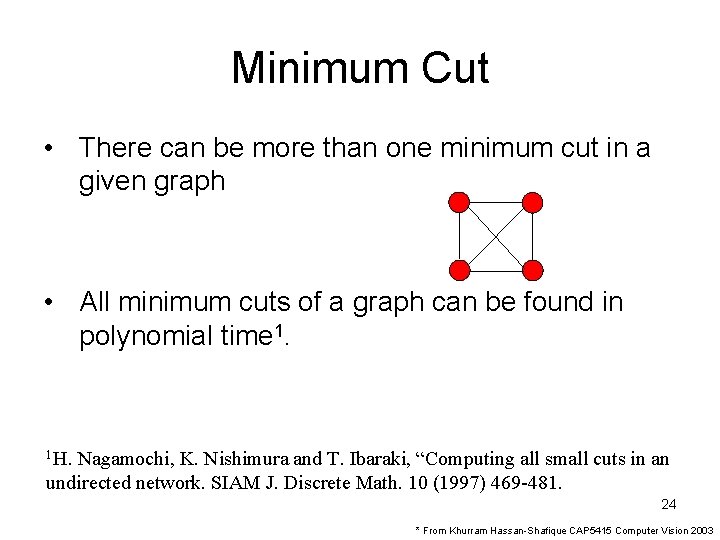
Minimum Cut • There can be more than one minimum cut in a given graph • All minimum cuts of a graph can be found in polynomial time 1. 1 H. Nagamochi, K. Nishimura and T. Ibaraki, “Computing all small cuts in an undirected network. SIAM J. Discrete Math. 10 (1997) 469 -481. 24 * From Khurram Hassan-Shafique CAP 5415 Computer Vision 2003
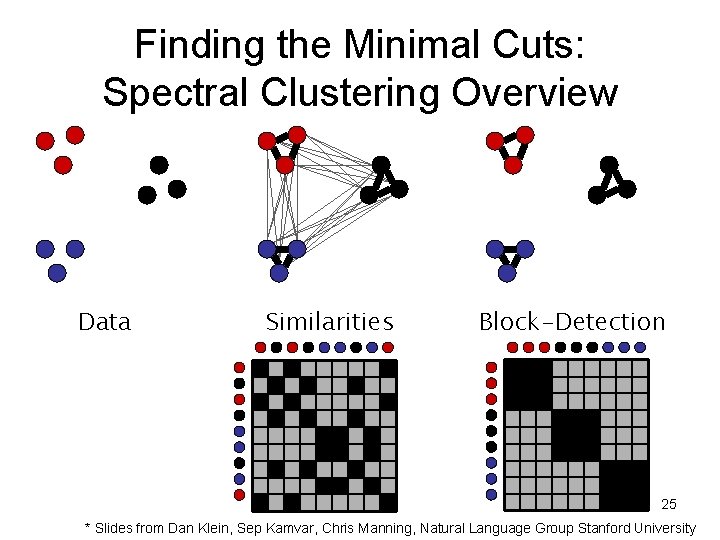
Finding the Minimal Cuts: Spectral Clustering Overview Data Similarities Block-Detection 25 * Slides from Dan Klein, Sep Kamvar, Chris Manning, Natural Language Group Stanford University
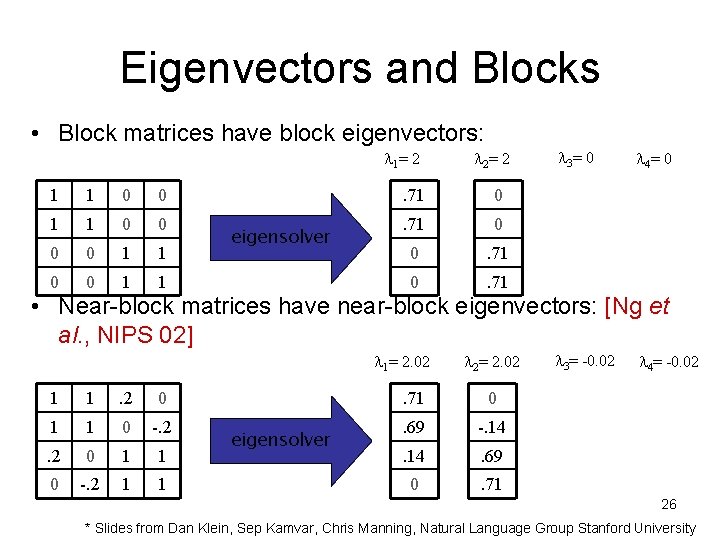
Eigenvectors and Blocks • Block matrices have block eigenvectors: 1= 2 1 1 0 0 0 0 1 1 eigensolver 2= 2 . 71 0 0 . 71 3= 0 4= 0 • Near-block matrices have near-block eigenvectors: [Ng et al. , NIPS 02] 1= 2. 02 1 1 . 2 0 1 1 0 -. 2 1 1 eigensolver 2= 2. 02 . 71 0 . 69 -. 14 . 69 0 . 71 3= -0. 02 4= -0. 02 26 * Slides from Dan Klein, Sep Kamvar, Chris Manning, Natural Language Group Stanford University
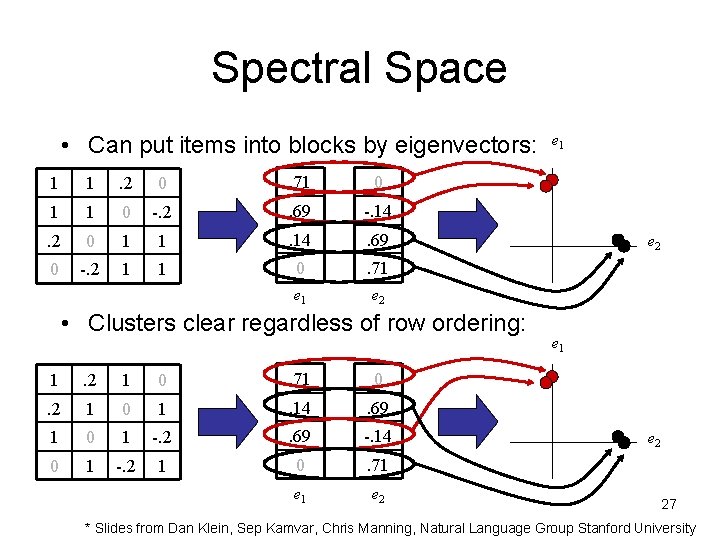
Spectral Space • Can put items into blocks by eigenvectors: 1 1 . 2 0 . 71 0 1 1 0 -. 2 . 69 -. 14 . 2 0 1 1 . 14 . 69 0 -. 2 1 1 0 . 71 e 2 • Clusters clear regardless of row ordering: 1 . 2 1 0 . 71 0 . 2 1 0 1 . 14 . 69 1 0 1 -. 2 . 69 -. 14 0 1 -. 2 1 0 . 71 e 2 e 1 e 2 27 * Slides from Dan Klein, Sep Kamvar, Chris Manning, Natural Language Group Stanford University
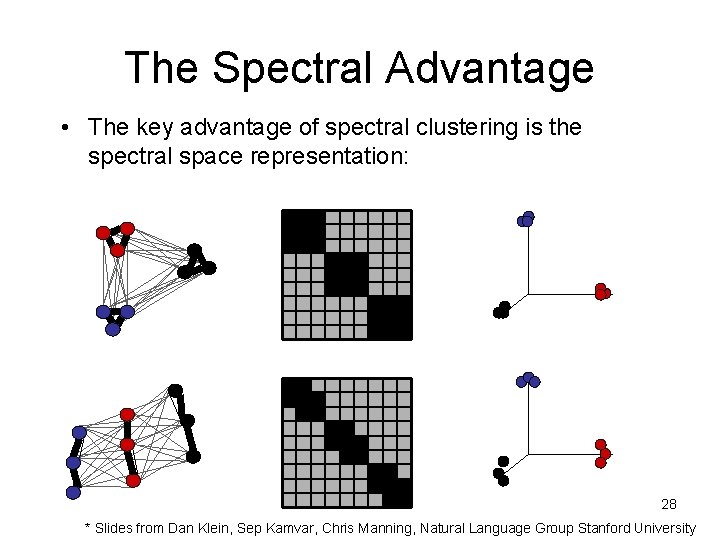
The Spectral Advantage • The key advantage of spectral clustering is the spectral space representation: 28 * Slides from Dan Klein, Sep Kamvar, Chris Manning, Natural Language Group Stanford University
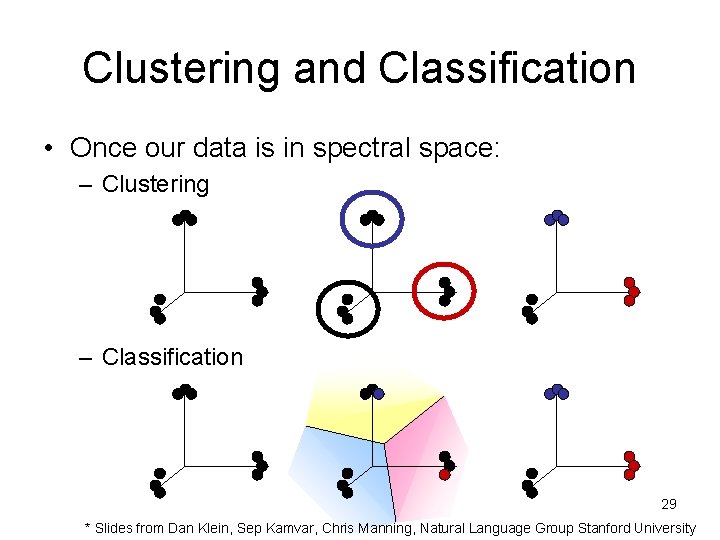
Clustering and Classification • Once our data is in spectral space: – Clustering – Classification 29 * Slides from Dan Klein, Sep Kamvar, Chris Manning, Natural Language Group Stanford University
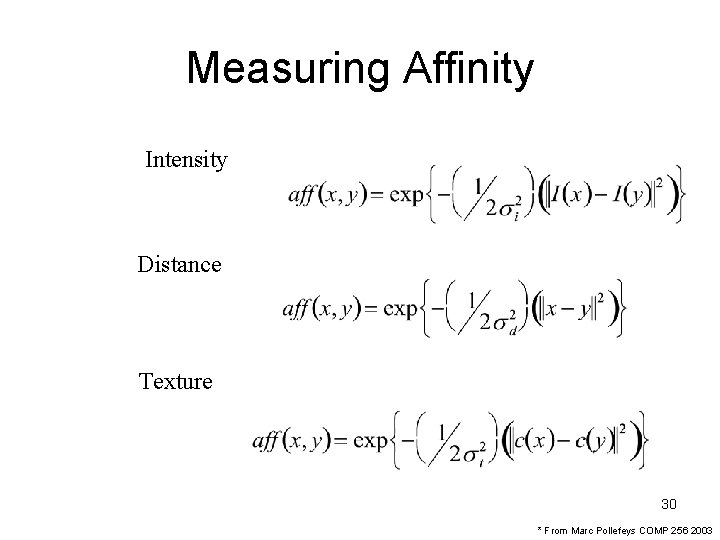
Measuring Affinity Intensity Distance Texture 30 * From Marc Pollefeys COMP 256 2003
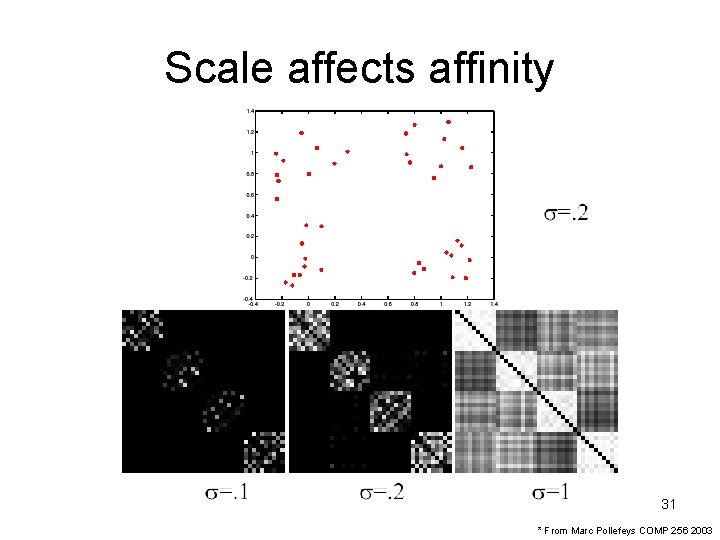
Scale affects affinity 31 * From Marc Pollefeys COMP 256 2003
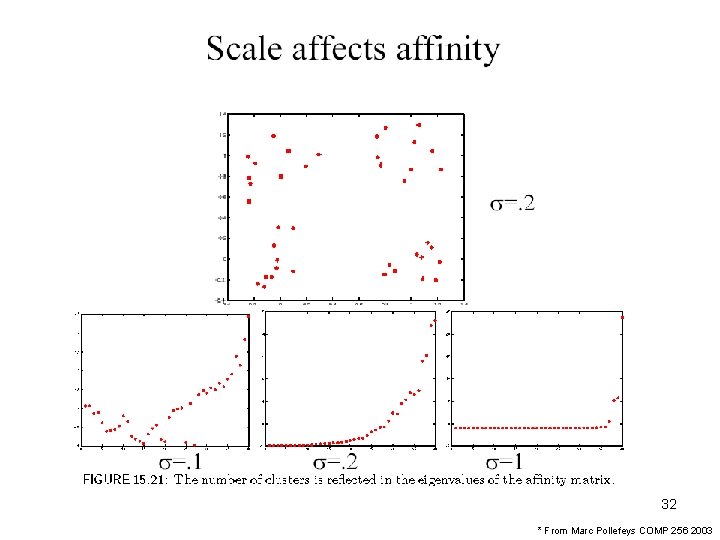
32 * From Marc Pollefeys COMP 256 2003
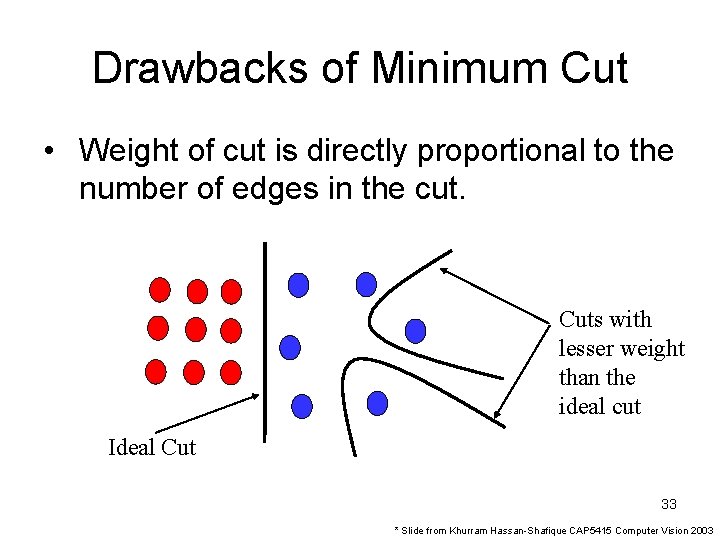
Drawbacks of Minimum Cut • Weight of cut is directly proportional to the number of edges in the cut. Cuts with lesser weight than the ideal cut Ideal Cut 33 * Slide from Khurram Hassan-Shafique CAP 5415 Computer Vision 2003
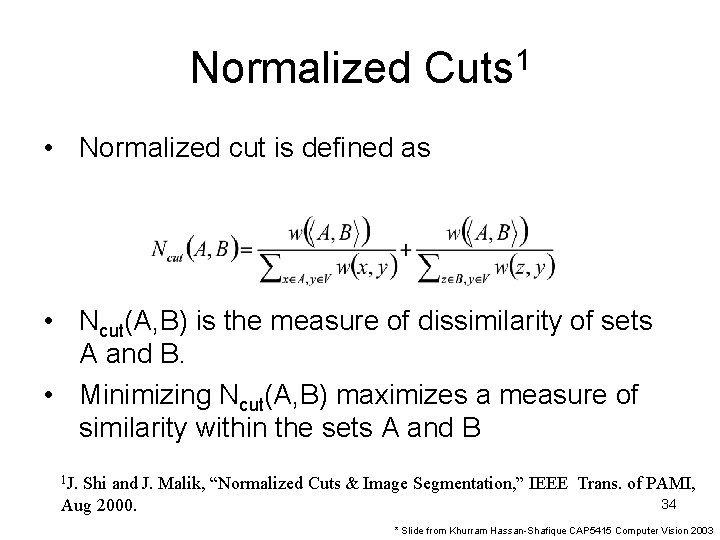
Normalized Cuts 1 • Normalized cut is defined as • Ncut(A, B) is the measure of dissimilarity of sets A and B. • Minimizing Ncut(A, B) maximizes a measure of similarity within the sets A and B 1 J. Shi and J. Malik, “Normalized Cuts & Image Segmentation, ” IEEE Trans. of PAMI, 34 Aug 2000. * Slide from Khurram Hassan-Shafique CAP 5415 Computer Vision 2003
Finding Minimum Normalized-Cut • Finding the Minimum Normalized-Cut is NP-Hard. • Polynomial Approximations are generally used for segmentation 35 * Slide from Khurram Hassan-Shafique CAP 5415 Computer Vision 2003
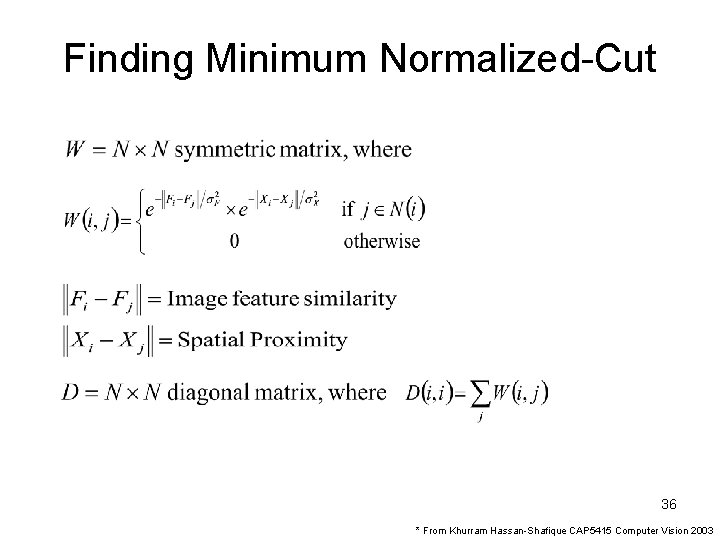
Finding Minimum Normalized-Cut 36 * From Khurram Hassan-Shafique CAP 5415 Computer Vision 2003
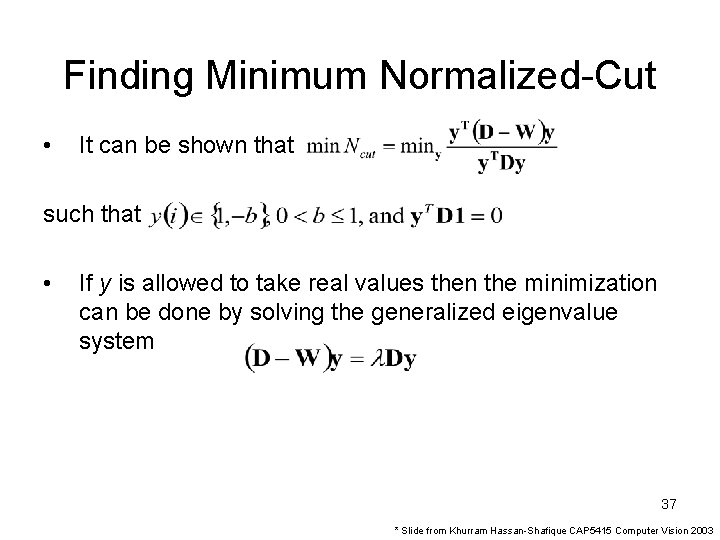
Finding Minimum Normalized-Cut • It can be shown that such that • If y is allowed to take real values then the minimization can be done by solving the generalized eigenvalue system 37 * Slide from Khurram Hassan-Shafique CAP 5415 Computer Vision 2003
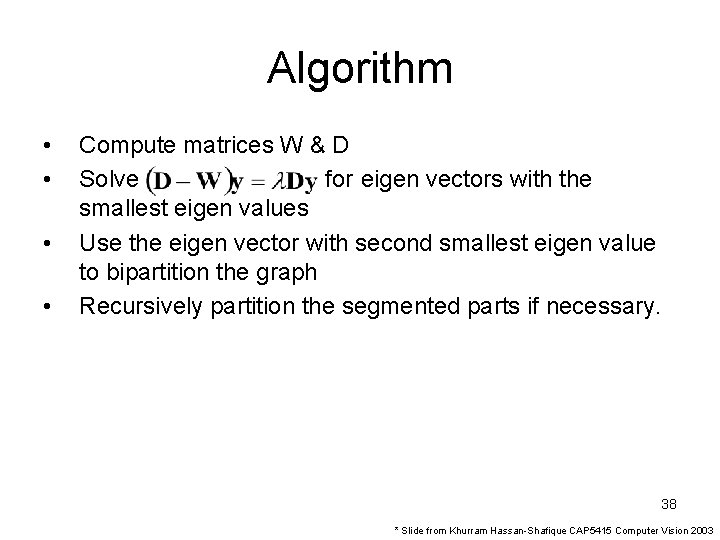
Algorithm • • Compute matrices W & D Solve for eigen vectors with the smallest eigen values Use the eigen vector with second smallest eigen value to bipartition the graph Recursively partition the segmented parts if necessary. 38 * Slide from Khurram Hassan-Shafique CAP 5415 Computer Vision 2003
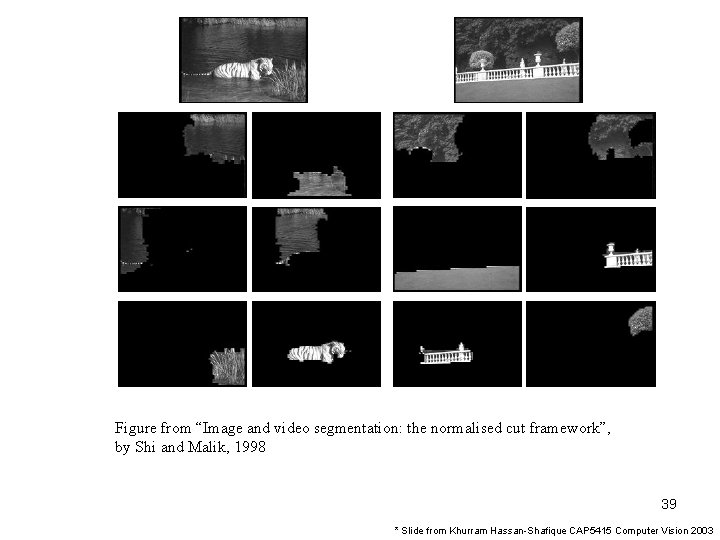
Figure from “Image and video segmentation: the normalised cut framework”, by Shi and Malik, 1998 39 * Slide from Khurram Hassan-Shafique CAP 5415 Computer Vision 2003
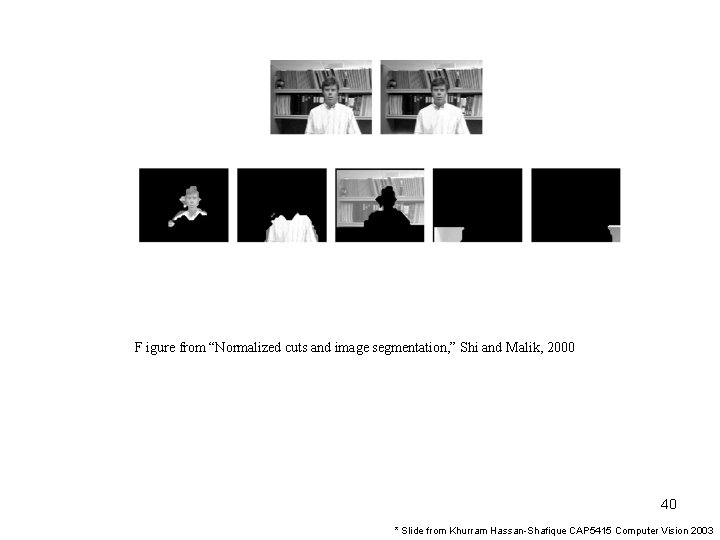
F igure from “Normalized cuts and image segmentation, ” Shi and Malik, 2000 40 * Slide from Khurram Hassan-Shafique CAP 5415 Computer Vision 2003
Drawbacks of Minimum Normalized Cut • Huge Storage Requirement and time complexity • Bias towards partitioning into equal segments • Have problems with textured backgrounds 41 * Slide from Khurram Hassan-Shafique CAP 5415 Computer Vision 2003
Segmentation by Clustering 42
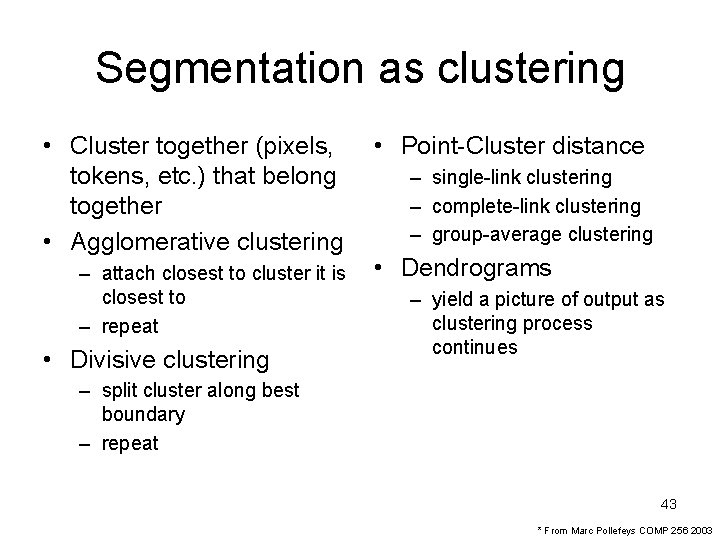
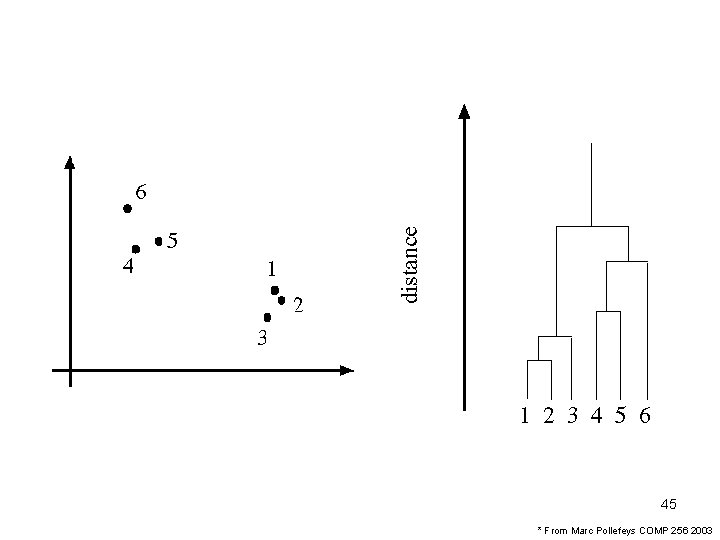
Segmentation as clustering • Cluster together (pixels, tokens, etc. ) that belong together • Agglomerative clustering – attach closest to cluster it is closest to – repeat • Divisive clustering • Point-Cluster distance – single-link clustering – complete-link clustering – group-average clustering • Dendrograms – yield a picture of output as clustering process continues – split cluster along best boundary – repeat 43 * From Marc Pollefeys COMP 256 2003
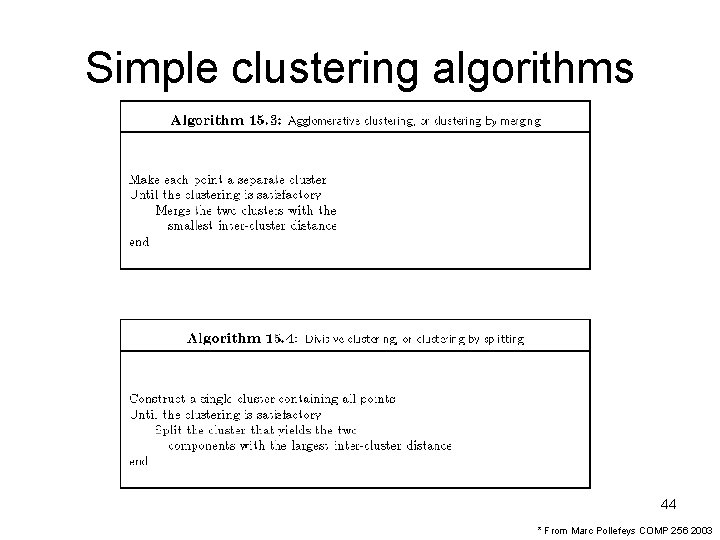
Simple clustering algorithms 44 * From Marc Pollefeys COMP 256 2003
45 * From Marc Pollefeys COMP 256 2003
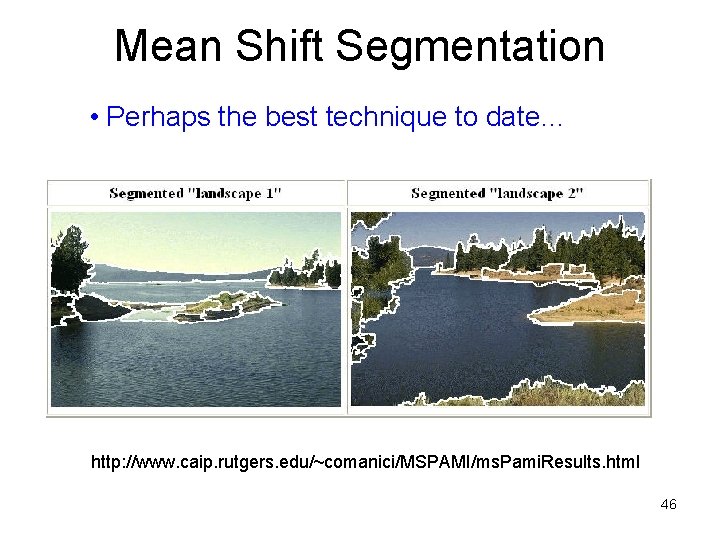
Mean Shift Segmentation • Perhaps the best technique to date… http: //www. caip. rutgers. edu/~comanici/MSPAMI/ms. Pami. Results. html 46
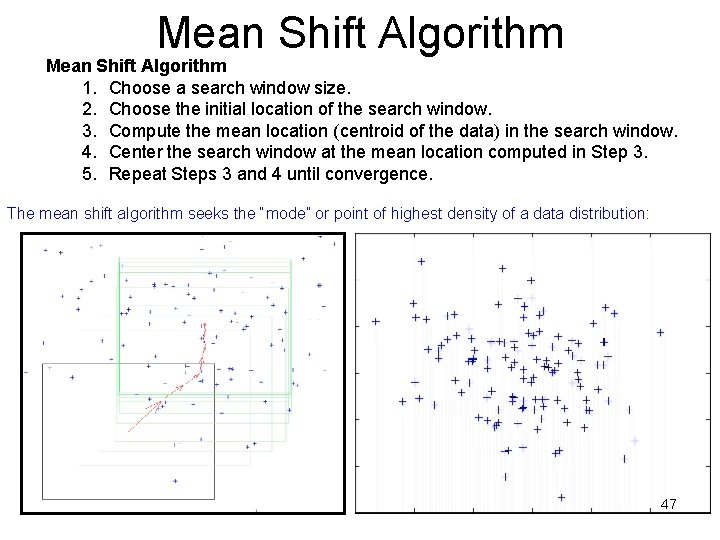
Mean Shift Algorithm 1. Choose a search window size. 2. Choose the initial location of the search window. 3. Compute the mean location (centroid of the data) in the search window. 4. Center the search window at the mean location computed in Step 3. 5. Repeat Steps 3 and 4 until convergence. The mean shift algorithm seeks the “mode” or point of highest density of a data distribution: 47
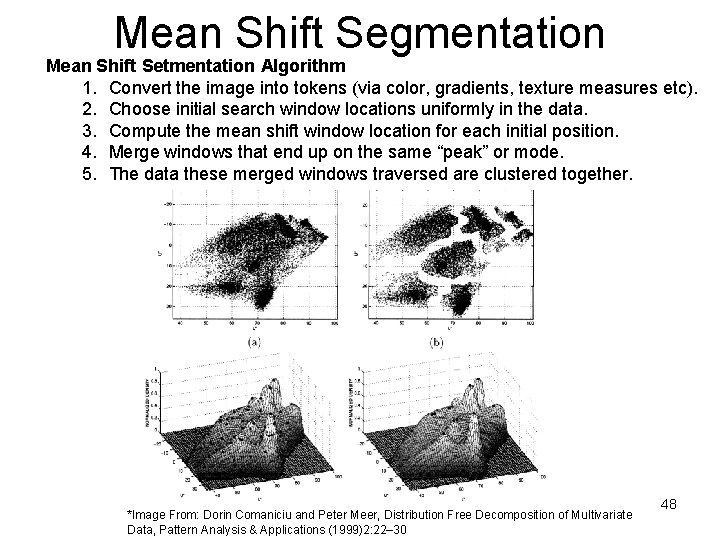
Mean Shift Segmentation Mean Shift Setmentation Algorithm 1. Convert the image into tokens (via color, gradients, texture measures etc). 2. Choose initial search window locations uniformly in the data. 3. Compute the mean shift window location for each initial position. 4. Merge windows that end up on the same “peak” or mode. 5. The data these merged windows traversed are clustered together. *Image From: Dorin Comaniciu and Peter Meer, Distribution Free Decomposition of Multivariate Data, Pattern Analysis & Applications (1999)2: 22– 30 48
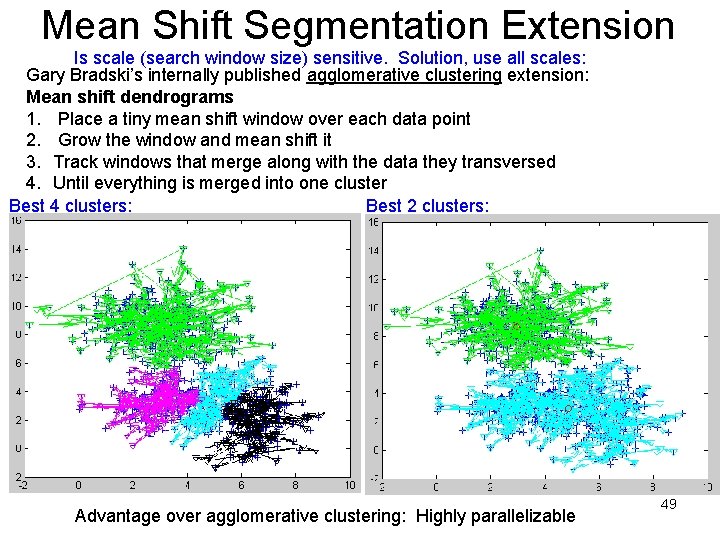
Mean Shift Segmentation Extension Is scale (search window size) sensitive. Solution, use all scales: Gary Bradski’s internally published agglomerative clustering extension: Mean shift dendrograms 1. Place a tiny mean shift window over each data point 2. Grow the window and mean shift it 3. Track windows that merge along with the data they transversed 4. Until everything is merged into one cluster Best 4 clusters: Best 2 clusters: Advantage over agglomerative clustering: Highly parallelizable 49
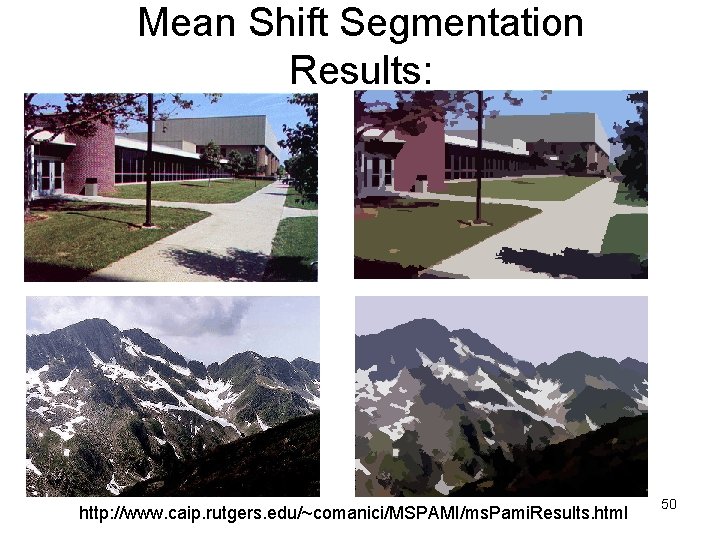
Mean Shift Segmentation Results: http: //www. caip. rutgers. edu/~comanici/MSPAMI/ms. Pami. Results. html 50
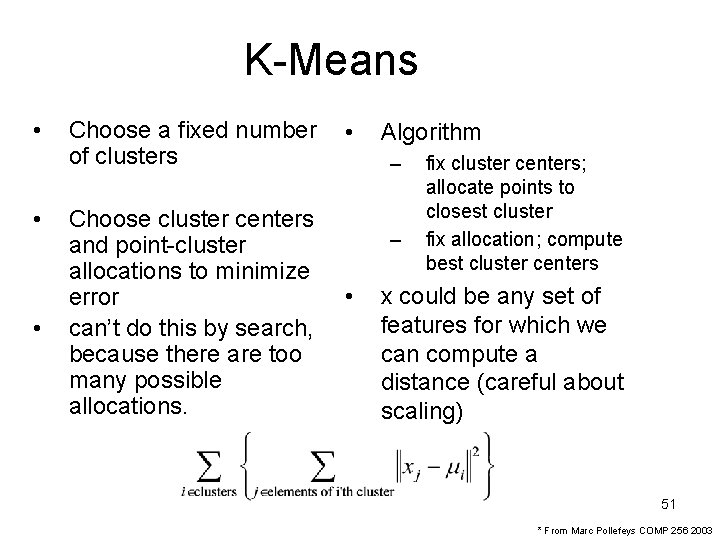
K-Means • • • Choose a fixed number of clusters Choose cluster centers and point-cluster allocations to minimize error can’t do this by search, because there are too many possible allocations. • Algorithm – – • fix cluster centers; allocate points to closest cluster fix allocation; compute best cluster centers x could be any set of features for which we can compute a distance (careful about scaling) 51 * From Marc Pollefeys COMP 256 2003
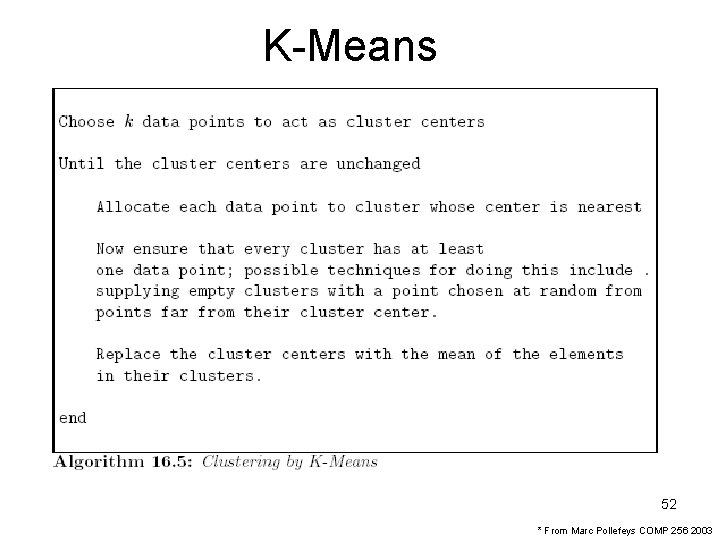
K-Means 52 * From Marc Pollefeys COMP 256 2003
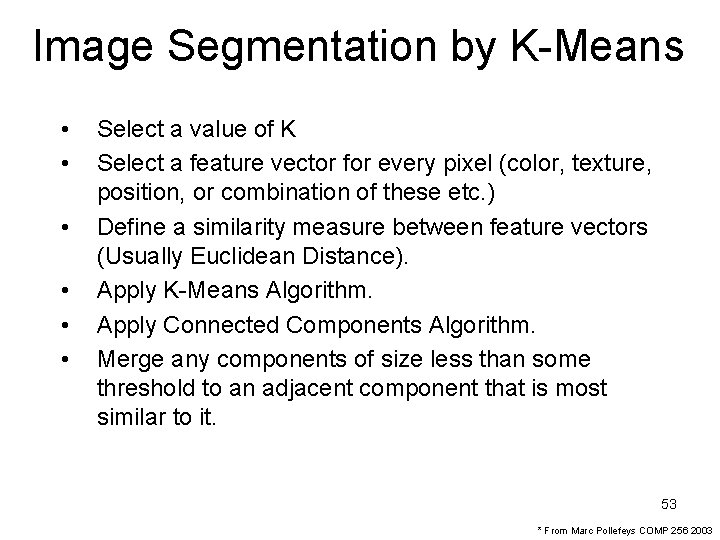
Image Segmentation by K-Means • • • Select a value of K Select a feature vector for every pixel (color, texture, position, or combination of these etc. ) Define a similarity measure between feature vectors (Usually Euclidean Distance). Apply K-Means Algorithm. Apply Connected Components Algorithm. Merge any components of size less than some threshold to an adjacent component that is most similar to it. 53 * From Marc Pollefeys COMP 256 2003
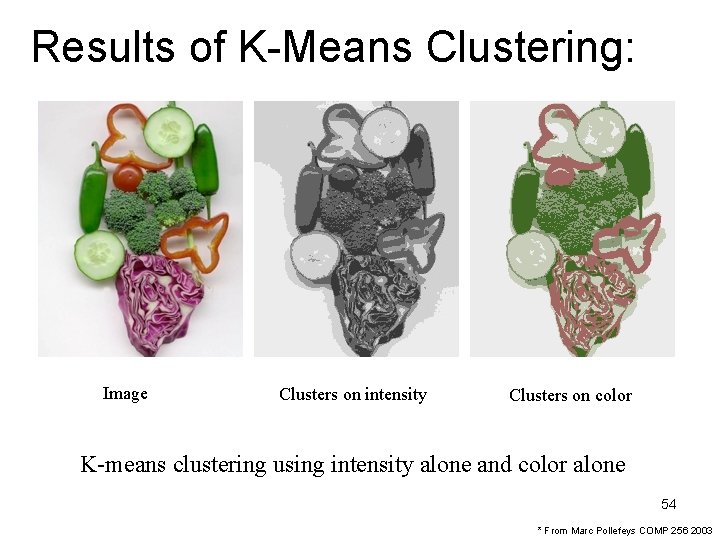
Results of K-Means Clustering: Image Clusters on intensity Clusters on color K-means clustering using intensity alone and color alone 54 * From Marc Pollefeys COMP 256 2003

Optional Section: Fitting with RANSAC (RANdom SAmple Consensus) Who should read? Everyone doing a project that requires: • Structure from motion or • finding a Fundamental or Essential matrix 55
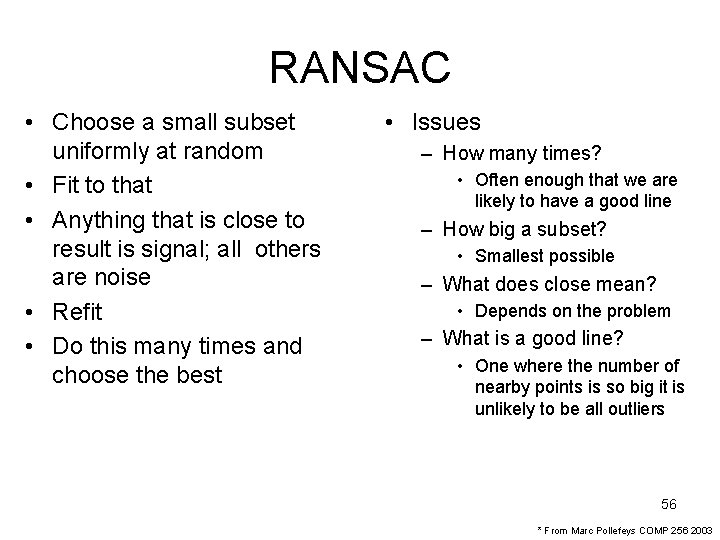
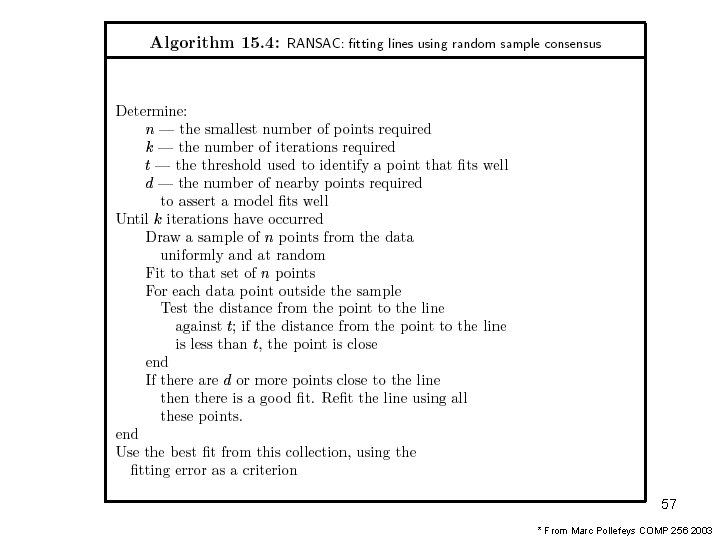
RANSAC • Choose a small subset uniformly at random • Fit to that • Anything that is close to result is signal; all others are noise • Refit • Do this many times and choose the best • Issues – How many times? • Often enough that we are likely to have a good line – How big a subset? • Smallest possible – What does close mean? • Depends on the problem – What is a good line? • One where the number of nearby points is so big it is unlikely to be all outliers 56 * From Marc Pollefeys COMP 256 2003
57 * From Marc Pollefeys COMP 256 2003
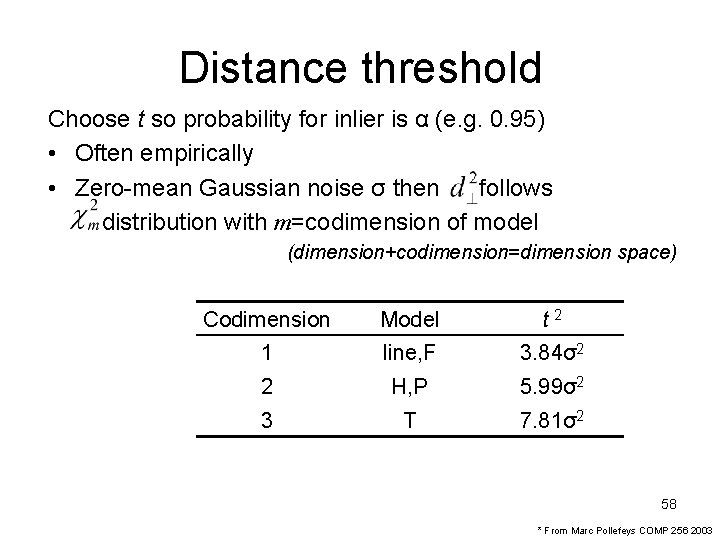
Distance threshold Choose t so probability for inlier is α (e. g. 0. 95) • Often empirically • Zero-mean Gaussian noise σ then follows distribution with m=codimension of model (dimension+codimension=dimension space) Codimension Model t 2 1 line, F 3. 84σ2 2 H, P 5. 99σ2 3 T 7. 81σ2 58 * From Marc Pollefeys COMP 256 2003
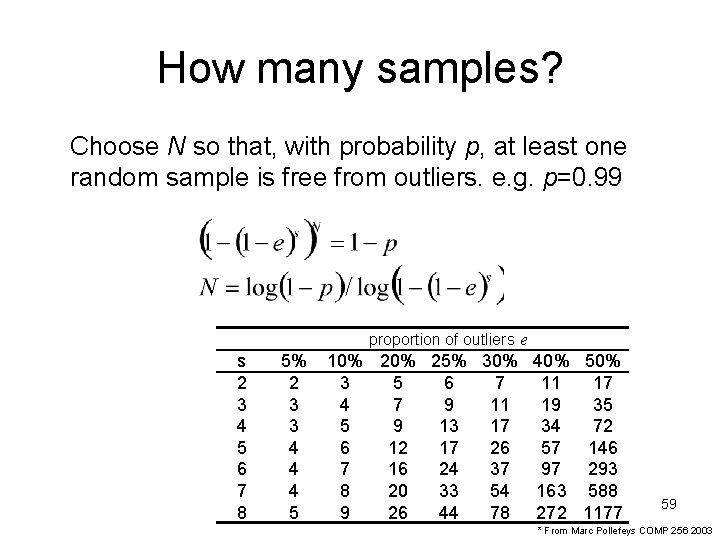
How many samples? Choose N so that, with probability p, at least one random sample is free from outliers. e. g. p=0. 99 proportion of outliers e s 2 3 4 5 6 7 8 5% 2 3 3 4 4 4 5 10% 25% 30% 40% 50% 3 5 6 7 11 17 4 7 9 11 19 35 5 9 13 17 34 72 6 12 17 26 57 146 7 16 24 37 97 293 8 20 33 54 163 588 9 26 44 78 272 1177 59 * From Marc Pollefeys COMP 256 2003
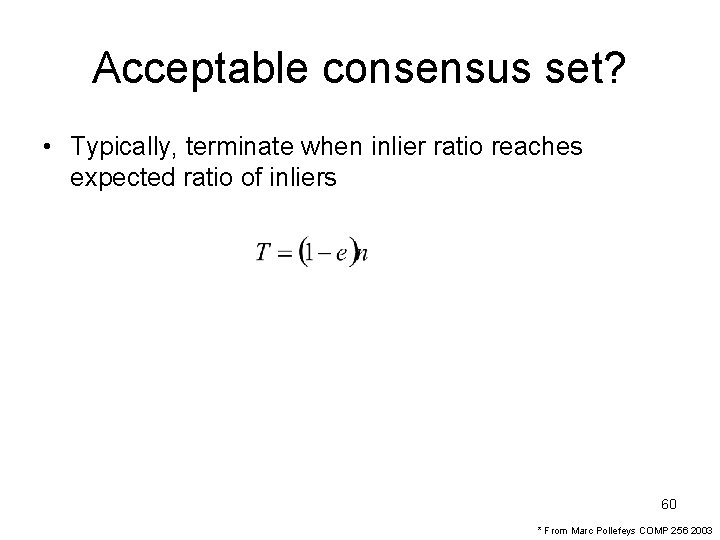
Acceptable consensus set? • Typically, terminate when inlier ratio reaches expected ratio of inliers 60 * From Marc Pollefeys COMP 256 2003
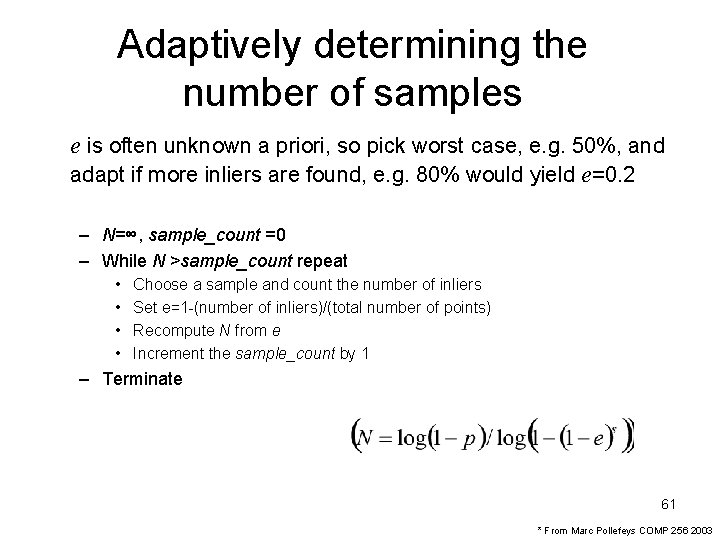
Adaptively determining the number of samples e is often unknown a priori, so pick worst case, e. g. 50%, and adapt if more inliers are found, e. g. 80% would yield e=0. 2 – N=∞, sample_count =0 – While N >sample_count repeat • • Choose a sample and count the number of inliers Set e=1 -(number of inliers)/(total number of points) Recompute N from e Increment the sample_count by 1 – Terminate 61 * From Marc Pollefeys COMP 256 2003
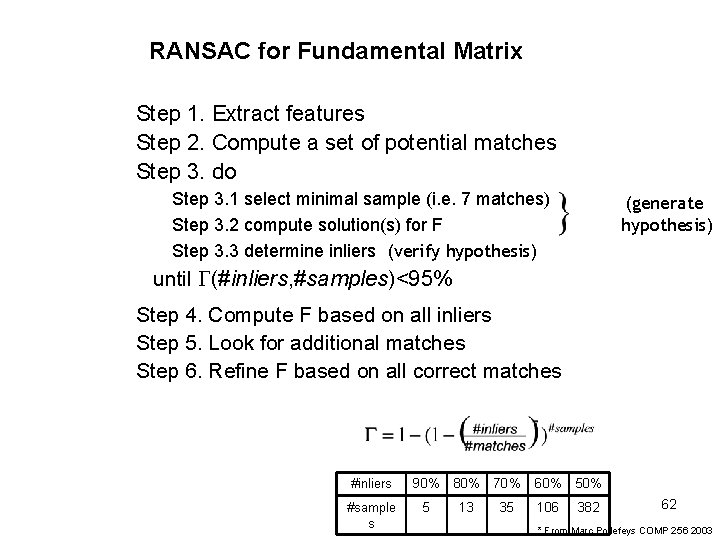
RANSAC for Fundamental Matrix Step 1. Extract features Step 2. Compute a set of potential matches Step 3. do Step 3. 1 select minimal sample (i. e. 7 matches) Step 3. 2 compute solution(s) for F Step 3. 3 determine inliers (verify hypothesis) (generate hypothesis) until (#inliers, #samples)<95% Step 4. Compute F based on all inliers Step 5. Look for additional matches Step 6. Refine F based on all correct matches #inliers 90% 80% 70% 60% 50% #sample s 5 13 35 106 382 62 * From Marc Pollefeys COMP 256 2003
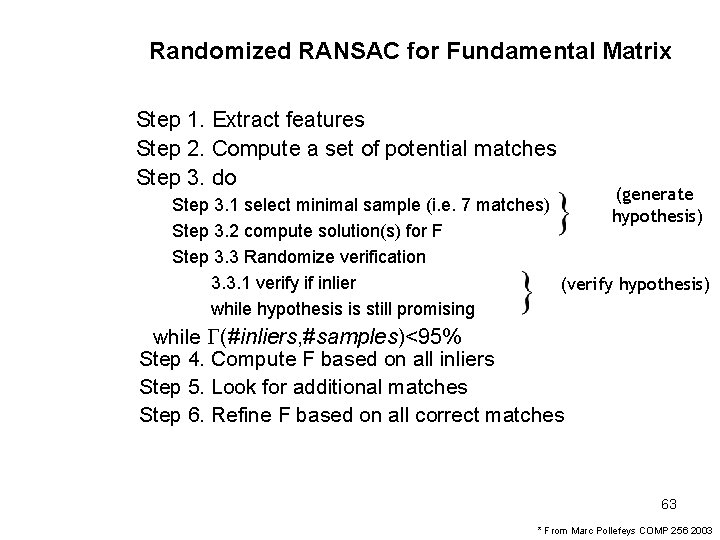
Randomized RANSAC for Fundamental Matrix Step 1. Extract features Step 2. Compute a set of potential matches Step 3. do (generate Step 3. 1 select minimal sample (i. e. 7 matches) hypothesis) Step 3. 2 compute solution(s) for F Step 3. 3 Randomize verification 3. 3. 1 verify if inlier (verify hypothesis) while hypothesis is still promising while (#inliers, #samples)<95% Step 4. Compute F based on all inliers Step 5. Look for additional matches Step 6. Refine F based on all correct matches 63 * From Marc Pollefeys COMP 256 2003
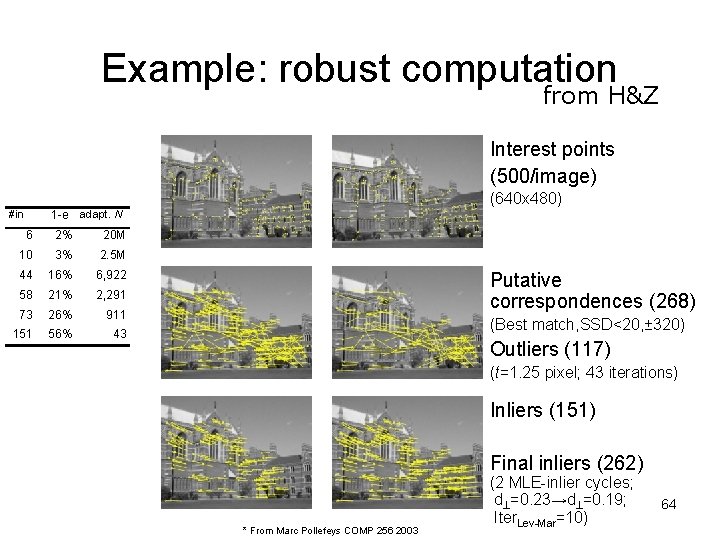
Example: robust computation from H&Z Interest points (500/image) (640 x 480) #in 1 -e adapt. N 6 2% 20 M 10 3% 2. 5 M 44 16% 6, 922 58 21% 2, 291 73 26% 911 151 56% 43 Putative correspondences (268) (Best match, SSD<20, ± 320) Outliers (117) (t=1. 25 pixel; 43 iterations) Inliers (151) Final inliers (262) * From Marc Pollefeys COMP 256 2003 (2 MLE-inlier cycles; d =0. 23→d =0. 19; Iter. Lev-Mar=10) 64
More on robust estimation • LMed. S, an alternative to RANSAC (minimize Median residual in stead of maximizing inlier count) • Enhancements to RANSAC – Randomized RANSAC – Sample ‘good’ matches more frequently – … • RANSAC is also somewhat robust to bugs, sometimes it just takes a bit longer… 65 * From Marc Pollefeys COMP 256 2003
- Slides: 65