Lecture 11 Resilient Cities part 1 The Age


 Source: United")
 Source: United Nations, Department")


- Slides: 13
Lecture 11 Resilient Cities, part 1 The Age of Sustainable Development
11. 1. GDP Per Capita vs. Urbanized Proportion of Country Source: World Bank. 2014. “World Development Indicators. ”
11. 2. The World’s Largest Urban Areas, Estimated Population as of 2012 (UN Population Division) Source: United Nations Department of Economic and Social Affairs Population Division (DESA Population Division). 2013. “World Population Prospects: The 2012 Revision. ” New York.
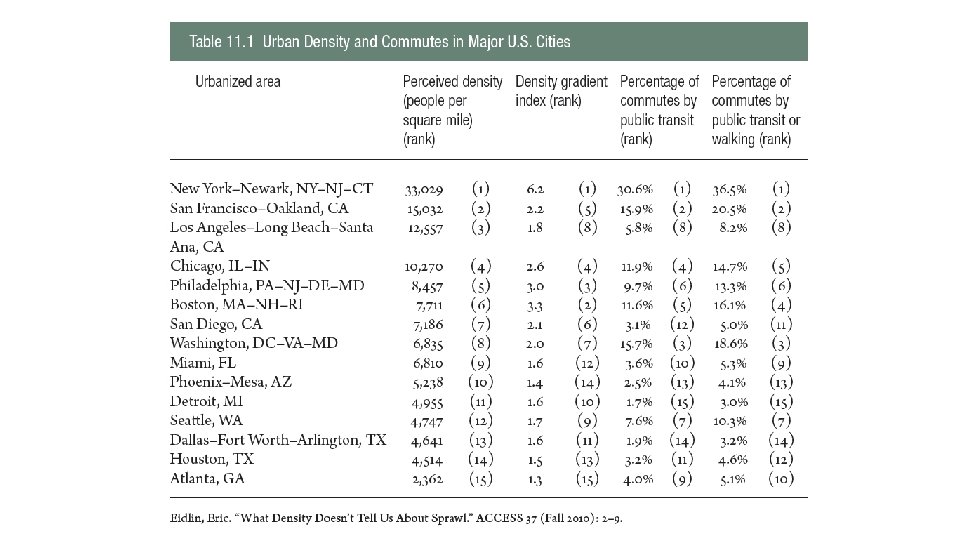
11. 3. Major Global Cities
11. 4. Global Population Distribution, Urban vs. Rural Source: United Nations, Department of Economic and Social Affairs, Population Division (DESA Population Division). 2012. “World Urbanization Prospects: The 2011 Revision. ” New York.
11. 5. Proportion of Population in Urban Areas by Region (1950 -2050) Source: United Nations, Department of Economic and Social Affairs, Population Division (DESA Population Division). 2012. “World Urbanization Prospects: The 2011 Revision. ” New York.
11. 6. Distribution of World Urban Populations (1950, 2011, 2050) Source: United Nations, Department of Economic and Social Affairs, Population Division (DESA Population Division). 2012. “World Urbanization Prospects: The 2011 Revision. ” New York.
11. 7. Greenhouse Gas Emissions, NYC vs. Major US Cities Source: Dickinson, Jonathan, and Andrea Tenorio. 2011. Inventory of New York City Greenhouse Gas Emissions, September 2011. New York: Mayor’s Office of Long-Term Planning and Sustainability.
11. 8 a. Commuters in Indonesia Reuters/Crack Palinggi. 11. 8 b. Line to enter a train station in the Phillipines Reuters/John Javellana.
11. 9. Seoul Subway Station “Train Waiting for Start, ” Doo Ho Kim, Flickr, CC BY-SA 2. 0.
11. 10. Seoul Metro Map Courtesy of the Seoul Metropolitan Rapid Transit Corporation.
11. New York City’s Water Supply System Source: New York City Department of Environmental Protection.