Lecture 11 Probability Distributions John Rundle Econophysics PHYS

Lecture 11 Probability Distributions John Rundle Econophysics PHYS 250

Probability Distributions • Q: Why should we care about probability distributions? Why not just focus on the data? • A: Outliers. We want to know how probable are the outliers of large market moves, so we can control our exposure and risk

Probability Distributions: Gaussian https: //en. wikipedia. org/wiki/Normal_distribution • In probability theory, the normal (or Gaussian) distribution is a very common continuous probability distribution. • Normal distributions are important in statistics and are often used in the natural and social sciences to represent real-valued random variables whose distributions are not known. Density Function Cumulative Distribution Function

Probability Distributions: Gaussian https: //en. wikipedia. org/wiki/Normal_distribution • The normal distribution is useful because of the central limit theorem. • In its most general form, under some conditions (which include finite variance), it states that averages of random variables independently drawn from independent distributions converge in distribution to the normal, that is, become normally distributed when the number of random variables is sufficiently large. • Physical quantities that are expected to be the sum of many independent processes (such as measurement errors) often have distributions that are nearly normal. • Moreover, many results and methods (such as propagation of uncertainty and least squares parameter fitting) can be derived analytically in explicit form when the relevant variables are normally distributed. • Example: In a large number of trials of a Binomial distribution, sums of random deviates from these trials will converge to a Normal distribution as the number of deviates in the sums increase.

Probability Distributions: Gaussian https: //en. wikipedia. org/wiki/Normal_distribution

Standard Normal Distribution https: //en. wikipedia. org/wiki/Normal_distribution

Gaussian Distribution: CDF https: //en. wikipedia. org/wiki/Normal_distribution

Gaussian Distribution: CDF https: //en. wikipedia. org/wiki/Normal_distribution Also called the complement to the error function, erfc

Confidence Intervals https: //en. wikipedia. org/wiki/Normal_distribution

Central Limit Theorem https: //en. wikipedia. org/wiki/Normal_distribution

Quantile Definition https: //en. wikipedia. org/wiki/Quantile • In statistics and probability quantiles are cut points dividing the range of a probability distribution into continuous intervals with equal probabilities, or dividing the observations in a sample in the same way. • There is one less quantile than the number of groups created. Thus quartiles are three cut points that will divide a dataset into four equal-sized groups.

Summary of Normal Distribution https: //en. wikipedia. org/wiki/N ormal_distribution

Log Normal Distribution https: //en. wikipedia. org/wiki/Log-normal_distribution • In probability theory, a log-normal (or lognormal) distribution is a continuous probability distribution of a random variable whose logarithm is normally distributed. • Thus, if the random variable is log-normally distributed, then Y = ln �(X) has a normal distribution. • Likewise, if Y has a normal distribution, then X = exp�(Y) has a log-normal distribution. • A random variable which is log-normally distributed takes only positive real values. • Whereas the Normal distribution describes a sum of random variables, the Log. Normal distribution describes a product of random variables

Log Normal Distribution https: //en. wikipedia. org/wiki/Log-normal_distribution

Application of Log. Normal Distribution to Stock Prices Because of compounding, the change in price after N days (in %) will be a product of N factors. However, in real markets, there are non-random factors that lead to non-random (persistent) changes in stock prices.

Summary of Log. Normal Distribution https: //en. wikipedia. org/wiki/L og-normal_distribution
 is")
Student’s t-Distribution https: //en. wikipedia. org/wiki/Student's_t-distribution • Student's t-distribution (or simply the t-distribution) is any member of a family of continuous probability distributions that arises when estimating the mean of a normally distributed population in situations where the sample size is small and population standard deviation is unknown. • Whereas a normal distribution describes a full population of deviates, t-distributions describe samples drawn from a full population • Accordingly, the t-distribution for each sample size is different, and the larger the sample, the more the distribution resembles a normal distribution.

Student’s t-Distribution https: //en. wikipedia. org/wiki/Student's_t-distribution

Student’s t-Distribution https: //en. wikipedia. org/wiki/Student's_t-distribution
 Distribution https: //en. wikipedia. org/wiki/Cauchy_distribution • The Cauchy distribution, named after Augustin")
Lorentz (Cauchy) Distribution https: //en. wikipedia. org/wiki/Cauchy_distribution • The Cauchy distribution, named after Augustin Cauchy, is a continuous probability distribution. It is also known, especially among physicists, as the Lorentz distribution (after Hendrik Lorentz), Cauchy–Lorentz distribution, Lorentz(ian) function, or Breit–Wigner distribution. • The Cauchy distribution is often used in statistics as the canonical example of a "pathological" distribution since both its mean and its variance are undefined • Its importance in physics is the result of it being the solution to the differential equation describing forced resonance. • In spectroscopy, it is the description of the shape of spectral lines which are subject to homogeneous broadening in which all atoms interact in the same way with the frequency range contained in the line shape.
 Distribution https: //en. wikipedia. org/wiki/Cauchy_distribution Density Function Cumulative Distribution Function")
Lorentz (Cauchy) Distribution https: //en. wikipedia. org/wiki/Cauchy_distribution Density Function Cumulative Distribution Function

Lorentz Density Function https: //en. wikipedia. org/wiki/Cauchy_distribution

Lorentz Distribution: CDF https: //en. wikipedia. org/wiki/Cauchy_distribution

Summary of Lorentz Distribution https: //en. wikipedia. org/wiki/ Cauchy_distribution

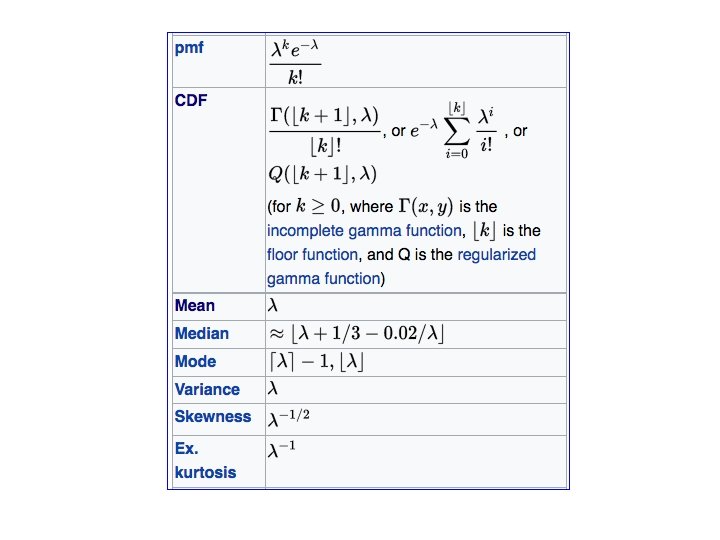
Poisson Distribution https: //en. wikipedia. org/wiki/Poisson_distribution • In probability theory and statistics, the Poisson distribution is a discrete probability distribution that expresses the probability of a given number of events occurring in a fixed interval of time and/or space if these events occur with a known average rate and independently of the time since the last event. • The Poisson distribution can also be used for the number of events in other specified intervals such as distance, area or volume. • The Poisson distribution is a 1 -parameter distribution • The time intervals between arrivals in a Poisson process are exponentially distributed at the Poisson rate

Poisson Distribution https: //en. wikipedia. org/wiki/Poisson_distribution

Poisson Distribution https: //en. wikipedia. org/wiki/Poisson_distribution A 1 -parameter distribution

Poisson Distribution https: //en. wikipedia. org/wiki/Poisson_distribution

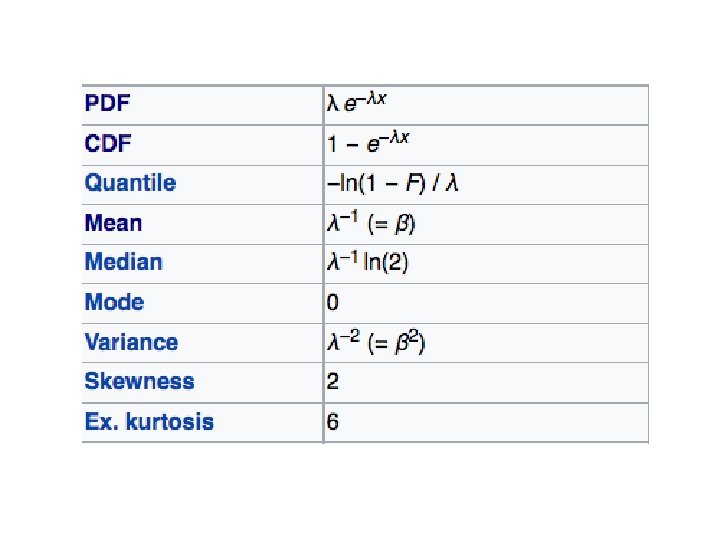
Exponential Distribution https: //en. wikipedia. org/wiki/Exponential_distribution • The exponential distribution is the probability distribution that describes the time between events in a Poisson process, i. e. a process in which events occur continuously and independently at a constant average rate. • It is a particular case of the gamma distribution. • It is the continuous analogue of the geometric distribution, and it has the key property of having no memory of prior events. • In addition to being used for the analysis of Poisson processes, it is found in various other contexts.

Exponential Distribution https: //en. wikipedia. org/wiki/Exponential_distribution

Exponential Distribution https: //en. wikipedia. org/wiki/Exponential_distribution

Binomial Distribution https: //en. wikipedia. org/wiki/Binomial_distribution • The binomial distribution with parameters n and p is the discrete probability distribution of the number of successes in a sequence of n independent yes/no experiments, each of which yields success with probability p. • Example: Coin flips • A success/failure experiment is also called a Bernoulli experiment or Bernoulli trial • When n = 1, the binomial distribution is a Bernoulli distribution. • The binomial distribution is the basis for the popular binomial test of statistical significance. • The binomial distribution is frequently used to model the number of successes in a sample of size n drawn with replacement from a population of size N.

Binomial Distribution https: //en. wikipedia. org/wiki/Binomial_distribution

Binomial Distribution https: //en. wikipedia. org/wiki/Binomial_distribution

Binomial Distribution https: //en. wikipedia. org/wiki/Binomial_distribution

Weibull Distribution https: //en. wikipedia. org/wiki/Binomial_distribution

Weibull Distribution https: //en. wikipedia. org/wiki/Binomial_distribution • If the quantity X is a "time-to-failure", the Weibull distribution gives a distribution for which the failure rate is proportional to a power of time • A value of k < 1 indicates that the failure rate decreases over time. This happens if there is significant "infant mortality", or defective items failing early. • A value of k = 1 indicates that the failure rate is constant over time. This might suggest random external events are causing mortality, or failure. The Weibull distribution reduces to an exponential distribution; • A value of k > 1 indicates that the failure rate increases with time. This happens if there is an "aging" process, or parts that are more likely to fail as time goes on.

Weibull Distribution https: //en. wikipedia. org/wiki/Bin omial_distribution

Pareto Distribution https: //en. wikipedia. org/wiki/Pareto_distribution The Pareto distribution, named after the Italian civil engineer, economist, and sociologist Vilfredo Pareto, is a power law probability distribution that is used in description of social, scientific, geophysical, actuarial, and many other types of observable phenomena.

Pareto Distribution https: //en. wikipedia. org/wiki/Pareto_distribution

Pareto Distribution https: //en. wikipedia. org/wiki/Pareto_distribution

Pareto Distribution https: //en. wikipedia. org/wiki/Par eto_distribution
- Slides: 44