Lecture 11 Ocean Primary Production and Biogeochemical Controls

Lecture 11: Ocean Primary Production and Biogeochemical Controls Oceanic ecosystem largely depends on the biochemical process of phytoplankton

Learning Objectives 1. Understand the trophic dynamics in the ocean 2. Know the marine productivity and its global distribution 3. Biological productivity in the upwelling water

ENERGY Autotrophs: organisms capable of self-nourishment by synthesizing food from inorganic nutrients heterotrophs: organisms not belonging to autotrophs; all animals are heterotrophs c. f. Fig. 10 -1 in text
 Transfer and energy path")
Difference between Mass (i. e. chemicals) Transfer and energy path

Difference between Mass Transfer and energy path
")
Difference between Mass Transfer and energy path Mass transfer is recycling (self-contained)

Difference between Mass Transfer and energy path Physiologic processes Energy is replenished all the time

Trophic levels and dynamics Although simple, it reminds us that all of the energy that a species expends relies on the photosynthesis of plants Simple food chain Trophic dynamics: study the interrelationships among organisms by means of the nutrition flow in the ecosystem The first trophic level is the autotroph, i. e. the plant producer, providing the matter and energy to the higher trophic levels, i. e. consumers

Omnivore: both plant and animal eater Food Web: a network of interlaced and interdependent food chains grazing food chain phytoplankton → zooplankton → nekton detritus → deposit feeder → nekton detritus food chain

Size increases biomass increases Energy amount increases Higher order trophic levels depend on the lower order trophic levels Energy pyramid Where does the energy go?

Energy transfer between trophic levels is not efficient Typically, a positive correlation exists between body size of aqua animals and their trophic level Exceptions? simple rule
 • Grazer")
Five basic consuming types of aqua animals (Fig. 10 -3 in text) • Grazer − herbivores (e. g. sea urchin) • Predator − carnivores (e. g. shark) • Scavenger − benthic invertebrates (e. g. crab) • Filter feeder − animals living in burrows • Deposit feeder − animals living in sediments Dynamical time lag exists between the food abundance and animal population

Trophic levels and dynamics Food Web Energy Sunlight and nutrition supplies are two principal factors that limit the primary production in the ocean. In addition to forming carbohydrates (via photosynthesis), plants also manufacture other organic compounds, including proteins, lipids, and nucleic acids such as DNA and RNA.

Plankton blooms Cell division causes diatom populations to increase dramatically and rapidly (within several days) under preferable growth conditions Red tide

Plankton Blooms Bands of the dionflagellate Lingulodinium polyedrum moving onshore over the troughs of a series of internal waves

Nonlinear Internal Waves and Phytoplankton Isopycnals Have you noted how fast the time lapse is !

green tide Alaska

Large scale Eddies 200 km

Note that where do the
 Central Gyres 2) Upwelling Regions")
Surface CHL-A 1) Central Gyres 2) Upwelling Regions

Production of Organic Carbon Export

Why do we care about the Carbon Export Production? • The total amount of carbon in the ocean is about 50 times greater than the amount in the atmosphere, and is exchanged with the atmosphere on a time-scale of several hundred years. • At least 50% of the oxygen we breathe comes from the photosynthesis of marine plants. • Currently, 48% of the carbon emitted to the atmosphere by fossil fuel burning is sequestered into the ocean. • But the future fate of this important carbon sink is largely uncertain (therefore anxious) because of potential climate change impacts on ocean circulation, biogeochemical cycling, and ecosystem dynamics => Definition of primary productivity in the ocean
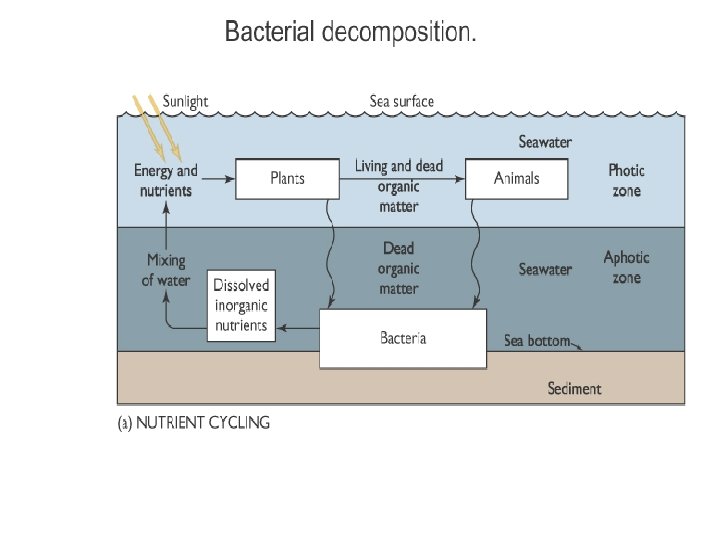

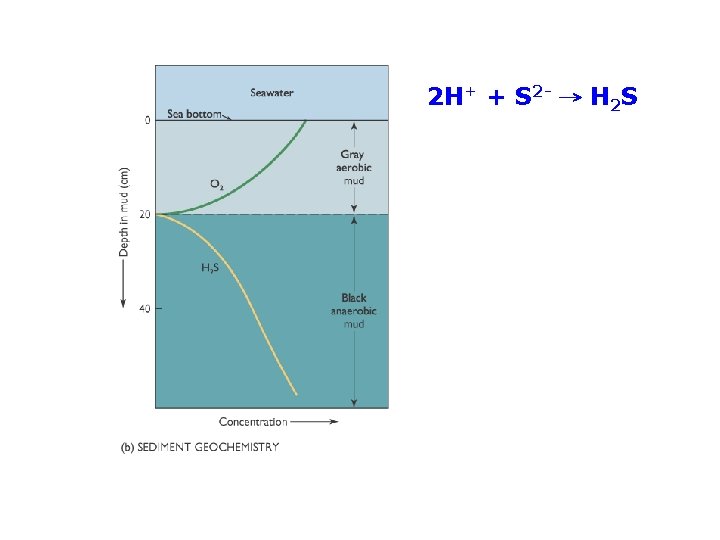
Roles of bacterial in the ecosystem 1. Bacterial decompose dead tissue and release essential inorganic nutrients into the water for recycling by plants. *NH 3 + 2 O 2 → H+ + NO 3 - +H 2 O (aerobic bacterial) *SO 42 - → 2 O 2 + S 2 - (anaerobic bacterial) 2. Plays both the starting point (providing nutrients for plant photosynthesis) and the ending point (proceeding the decay of organic matter) of the food cycle that provides the linkage between nonliving and living matter. 3. Also serve as food for some species of zooplankton
 are predominantly photosynthetic prokaryotic (初核質 ) organisms containing a blue pigment")
Cyanobacteria (blue-green algae) are predominantly photosynthetic prokaryotic (初核質 ) organisms containing a blue pigment in addition to chlorophyll. They use sunlight directly to manufacture food from dissolved nutrients.

Hydrothermal vents and Chemosynthetic bacteria Chemical energy released by the oxidation of inorganic compounds is used to produce food. The base of vent community is occupied by microbes rather than by plants, because there is no light in the deep sea.

Global Carbon Cycle Marine Biota Export Production inside the ocean
 Nutrient Sources for Primary Production and")
What are the controllers on Export Production? (1) Nutrient Sources for Primary Production and (2) limitations of CO 2 fluxes The fluxed of organic carbon must be sustained by an adequate flux of macronutrients (P, N, Si) If macronutrients are unavailable then the CO 2 flux is reduced! Macronutrients vs. micronutrients (p 339 in text)
 Ocean nutrient inventory 2)2) Utilization of")
What are the controllers on Export Production? 1) Ocean nutrient inventory 2)2) Utilization of nutrients in HNLC condition 3)3) Change of Redfield Ratio (A. C. Redfield 1958; 1963)
 Ocean nutrient inventory Nitrogen appears to")
What are the controllers on Export Production? 1) Ocean nutrient inventory Nitrogen appears to be the most important controlling factor that limit the primary productivity of ecosystems. Why ? (important; p 339 in text) • N is an essential nutrient for all living organisms (nucleic acids and amino acids) • N has many oxidation states, which makes speciation and redox chemistry very interesting • NH 4+ is the preferred N nutrient

Fixation N 2 Nitrification Mix Layer depth NH 4 NO 3 Uptake Phytoplankton Grazing Chlorophyll Zooplankton Mortality Water column Continental shelf sediments are responsible for up to 67% of marine N denitrification estimates Mineralization Susp. particles Large detritus Nitrification N 2 NH 4 De-nitrification Sediment Organic matter NO 3 Aerobic mineralization De-nitrification − the removal of fixed N, mostly NO 3 -, resulting in the formation of nonbiologically available N, primarily N 2 gas
 Utilization of nutrients in HNLC")
What are the controllers on Export Production? 2) Utilization of nutrients in HNLC

HNLC − High-Nutrient, Low-Chlorophyll ü It describe areas of the ocean where the number of phytoplankton are low in spite of high macronutrient concentrations (nitrate, phosphate, silica acid). ü HNLC is thought to be caused by the scarcity of iron (a micronutrient which phytoplankton require for photosynthesis) and high grazing rates of micro-zooplankton that feed on the phytoplankton. ü The HNLC condition has been observed in the equatorial and sub-arctic Pacific Ocean, the Southern Ocean, and in strong upwelling regimes, such as off central and northern California and off Peru.

Southern Ocean HNLC

Southern Ocean HNLC • Nitrate and phosphate concentrations are high year round but standing stocks of phytoplankton are always low (0. 2 -0. 4 µg/L; normal yield is 1 µg /L) • Iron concentrations in these waters are subnanomolar: the same as those that are known to limit growth of phytoplankton, particularly large species such as diatoms. • Addition of low levels of Fe promotes growth of large phytoplankton. -bottle experiments -in situ fertilization experiments

One of the possible solutions to global warming is to fertilize HNLC ocean areas lacking iron with iron to increase CO 2 absorption from phytoplankton.
 − the molecular ratio of carbon, nitrogen and phosphorus in phytoplankton.")
Redfield ratio (stoichiometry) − the molecular ratio of carbon, nitrogen and phosphorus in phytoplankton. ü Redfield (1963) described the remarkable congruence between the chemistry of the deep ocean and the chemistry of living things in the surface ocean (i. e. phytoplankton). Both have N: P ratios of about 16. ü When nutrients are not limiting, the molar element ratio C: N: P in most phytoplankton is 116: 1. ü Redfield thought it wasn't purely coincidental that the vast oceans would have a chemistry perfectly suited to the requirements of living organisms. ü He considered how the cycles of not just N and P but also C and O could interact to result in this match.

Modern Time N 2 fixation De-nitrification N = 25790 N* = N – 16 P

Biologically Mediated Exchange of CO 2 Between the Ocean and Atmosphere

Regions with upwelling represent the productivity Equatorial upwelling Coastal upwelling Water turbidity

ocean Open ocean continental shelves upwelling regions shallow estuaries terrestrial area deserts forest; grassland rain forests farmlands

Both physical and biological processes in the ocean affect the carbon cycle. In addition, physical processes influence the net production of biological oceanography.

HW#7 due on 6 June of class time
 e)")
HW#7 due on 6 June of class time d) e)

Question 3: HW#7 due on 6 June of class time
- Slides: 47