Lecture 1 Sequence Alignment Sequence alignment why Early


")


 qjk – number")

 be the penalty for a gap of length k and")

 Needleman, S. B & Wunsch, C. D. (1970) J. Mol.")


")


,")


 CINEMA- Java applet available from:")
- Slides: 35
Lecture 1 Sequence Alignment
Sequence alignment: why? • Early in the days of protein and gene sequence analysis, it was discovered that the sequences from related proteins or genes were similar, in the sense that one could align the sequences so that many corresponding residues match. • This discovery was very important: strong similarity between two genes is a strong argument for their homology. Bioinformatics is based on it. • Terminology: – Homology means that two (or more) sequences have a common ancestor. This is a statement about evolutionary history. – Similarity simply means that two sequences are similar, by some criterion. It does not refer to any historical process, just to a comparison of the sequences by some method. It is a logically weaker statement. • However, in bioinformatics these two terms are often confused and used interchangeably. The reason is probably that significant similarity is such a strong argument for homology.
An example of a sequence alignment for two proteins (the protein kinase KRAF_HUMAN and the uncharacterized O 22558 from Arabidopsis thaliana) using the BLAST program. Note: protein is expresses as a sequence of amino acids, represented by single letter alphabets.
Many genes have a common ancestor • The basis for comparison of proteins and genes using the similarity of their sequences is that the proteins or genes are related by evolution; they have a common ancestor. • Random mutations in the sequences accumulate over time, so that proteins or genes that have a common ancestor far back in time are not as similar as proteins or genes that diverged from each other more recently. • Analysis of evolutionary relationships between protein or gene sequences depends critically on sequence alignments.
A dotplot displays sequence similarity 50 100 150 100 150 Erythrocruorin from Chironomus (insect) 1 Hemoglobin A chain from human Symbols in matrix indicates degree of matching
Some definitions • Global alignment. Assumes that the two proteins are basically similar over the entire length of one another. • Local alignment. Searches for segments of the two sequences that match well. • Gaps and insertions. Match may be improved by putting gaps or inserting extra residues into one of the sequences. ---DFAHKAMM-PTWWEGCIL-----DXGHK-MMSPTW-ECAAL---
• Scoring. Quantifies the goodness of alignment. Exact match has highest score, substitution lower score and insertion and gaps may have negative scores. • Substitution matrix. A symmetrical 20*20 matrix (20 amino acids to each side). Each element gives a score that indicates the likelihood that the two residue types would mutate to each other in evolutionary time. • Gap penalty. Evolutionary events that makes gap insertion necessary are relatively rare, so gaps have negative scores. Three types: – Single gap-open penalty. This will tend to stop gaps from occuring, but once they have been introduced, they can grow unhindered. – Gap penalty proportional to the gap length. Works against larger gaps. – Gap penalty that combines a gap-open value with a gap-length value.
Substitution “log odds” matrix BLOSUM 62 sjk = 2 log 2(qjk/ejk) qjk – number of times j-k pair of residues seen together ejk – number of times j-k pair of residues Henikoff and Henikoff expected to be together(1992; PNAS 89: 10915 -10919)
sij = log 10 Mij = probability of replacement j to i per occurrence of residue j. ( M. O. Dayhoff, ed. , 1978, Atlas of Protein Sequence and Structure, Vol 5).
• Let W(k) be the penalty for a gap of length k and sub(A, B) the substitution score for replacing A residue by B. • The score for the alignment C - K H V F C R V C I C K K C - F C - K C V Is: 3 sub(C, C) + sub(K, K) + sub(H, C) + sub(F, F) + sub(V, K) + sub(I, V) + 3 W(1) If we use PAM 250 and gap penealty of 10, then score is 3 x 12 + 5 – 3 + 9 – 2 + 4 + 3 x(-10) = 19 Question is how to find the alignment with the highest scores.
There no single best alignment • Optimal alignment. The alignment that is the best, given the scoring convention. There is no such thing as the single best alignment. Good alignment is given by a scoring systems based on solid biology.
The Needleman-Wunsch-Sellers Algorithm (NWS) Needleman, S. B & Wunsch, C. D. (1970) J. Mol. Biol. 48: 443 -453; Sellers (Sellers, P. H. (1974), SIAM J. Appl. Math. 26: 787 • Dynamical-progamming algoritm for finding the highest-scoring alignment of two sequences (given a scoring scheme). • Let W(k) be the penalty for a gap of length k and sub(A, B) the substitution score for replacing A residue by B. • Suppose we want align two short sequences: CKHVFCRVCI and CKKCFCKCV
i = 1 to L j = 1 to L’ 1. Line sequences to form a Lx. L’ matrix; L, L’ are length if the two sequences. 2. Find the score at site (I, j) from scores at previous sites and scoring scheme. D i, j = max {D i+1, j+1 + sub(A i , B j ); D i, j+k + W(k), k = 1 to L’-j; D i+k, j + W(k), k = 1 to L-i }
3. Fill the empty sites in column i=L and row j=L’ with zeroes. (Here use simple diagonal – 0 and 1 - substitution matrix and ignore gap penalty. )
4. Move in to the next column and row. To go to site (i, j), choose from among (i+1, j), (i, j+1) and (i+1, j+1) that has the largest value, then add that value to the value of (i, j). E. g. Value of (6, 8) was 1. Go to that site from (7, 8). Value of (7, 8) is 1. So value of (6, 8) is updated to 2.
5. Repeat the process
6. Backtrace our path ending at the cell with value 5 at (1, 1) to identify all paths (value must increase along the path) leading to that (1, 1). These paths are highlighted as shown.
7. Some of the paths are CKHVFCRVCI CKKCFC-KCV CKHVFCRVCI CKKCFCK-CV C-KHVFCRVCI CKKC-FC-CKV CKH-VFCRVCI CKKC-FC-KCV 8. And these give alignments such as those on the left; all have a score of 5.
However if we used the more realistic PAM 250 substitution matrix then these alignments would have different scores (and the NWS algorithm would have picked the alignment with the highest one). Score with PAM 250 and gap penalty -10 CKHVFCRVCI CKKCFC-KCV 36 + 5 + 0 – 2 + 9 – 2 + 4 – 10 = 40 CKHVFCRVCI CKKCFCK-CV 36 + 5 + 0 – 2 + 9 + 5 + 4 – 10 = 47 C-KHVFCRVCI CKKC-FC-CKV 36 + 5 – 3 + 9 – 2 + 4 – 3 x 10 = 19 CKH-VFCRVCI CKKC-FC-KCV 36 + 5 + 0 + 9 – 2 + 4 – 3 x 10 = 22 Gap penalty is important; biology does not like gaps
Database searching • Probe sequence – When we have a sequence (the probe sequence), often we want to find other sequences similar to it in a database • Match sequence – The sequence(s) found by database search that is (are) similar to the probe sequence; also called a hit. • Homologs – Sequences having the same ancestor (who diverged and evolved differently)
• Score – Used to determine quality of match and basis for the selection of matches. Scores are relative. • Expectation value – An estimate of the likelihood that a given hit is due to pure chance, given the size of the database; should be as low as possible. E. V. ’s are absolute. A high score and a low E. V. indicate a true hit. • Sequence identity (%) (or Similarity) – Number of matched residues divided by total length of probe
• Rule-of-thumb for true hit – A database hit having a sequence identity of 25% or more (protein lengths 200 residues or more) is almost certainly a true hit • Popular and powerful sequence search software – BLAST • www. ncbi. nlm. nih. gov/blast/ • Or do a Google on “BLAST” – FASTA • www. ebi. ac. uk/fasta 33/ • Or do a Google on “FASTA”
Most important sequence databases • Genbank– maintained by USA National Center for Biology Information (NCBI) – All biological sequences • www. ncbi. nlm. nih. gov/Genbank. Overview. html – Genomes • www. ncbi. nlm. nih. gov: 80/entrez/query. fcgi? db=Genom e • Swiss-Prot - maintained by EMBL- European Bioinformatics Institute (EBI ) – Protein sequences • www. ebi. ac. uk/swissprot/
Multiple sequence alignment • Often a probe sequence will yield many hits in a search. Then we want to know which are the residues and positions that are common to all or most of the probe and match sequences • In multiple sequence alignment, all similar sequences can be compared in one single figure or table. The basic idea is that the sequences are aligned on top of each other, so that a coordinate system is set up, where each row is the sequence for one protein, and each column is the 'same' position in each sequence.
An example: cellulose-binding domain of cellobiohydrolase I Name of homologous domians consensus Position of residues and position common to most homologs
A schematic image of the 3 D structure of the domian. Arrows indicate beta sheets. Other parts are loops. Kraulis J, et al. , Biochemistry 1989, 28(18): 7241 -57
A sequence logo. This shows the conserved residues as larger characters, where the total height of a column is proportional to howconserved that position is. Technically, the height is proportional to the information content of the position.
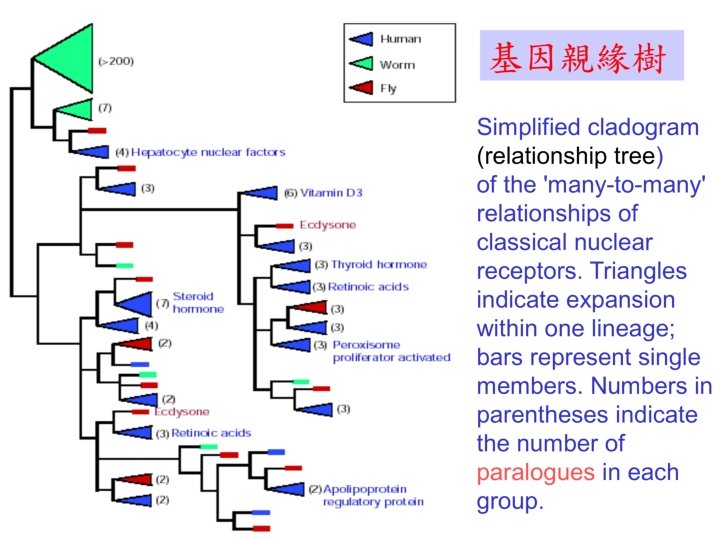
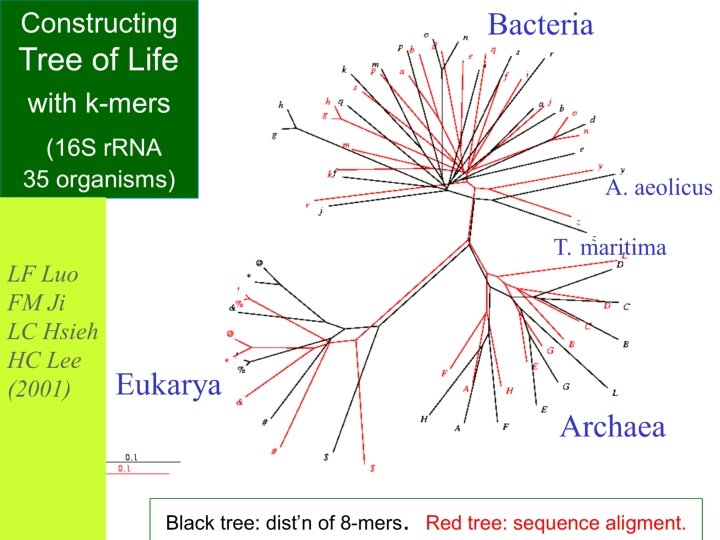
Applications of multiple sequence alignment • Identify consensus segments – Hence the most conserved sites and residues • Use for construction of phylogenesis – Convert similarity to distance www. ch. embnet. org/software/Clustal. W. html – Of genes, strains, organisms, species, life
Clustal. W: A standard multiple alignment program • Original paper – Thompson JD, Higgins DG, Gibson TJ. Nucleic Acids Res 1994 11; 22: 4673 -80 • Where to find on web – – – www. ebi. ac. uk/clustalw/ www. ch. embnet. org/software/Clustal. W. html www. clustalw. genome. ad. jp/ bioweb. pasteur. fr/seqanal/interfaces/clustalw. html Do a Google on “Clustal. W”
Overview of Clustal. W Procedure Hbb_Human Hbb_Horse Hba_Human Hba_Horse Myg_Whale 1 2 3 4 5 . 17. 59. 77 CLUSTAL W. 60. 59. 77 . 13. 75 Hbb_Human . 75 - 2 3 Quick pairwise alignment: calculate distance matrix 4 Hbb_Horse Hba_Human Neighbor-joining tree (guide tree) 1 Hba_Horse Myg_Whale alpha-helices 1 2 3 4 5 PEEKSAVTALWGKVN--VDEVGG GEEKAAVLALWDKVN--EEEVGG PADKTNVKAAWGKVGAHAGEYGA AADKTNVKAAWSKVGGHAGEYGA EHEWQLVLHVWAKVEADVAGHGQ 2 1 3 4 Progressive alignment following guide tree
Databases of multiple alignments • Pfam: Protein families database of aligments and HMMs • www. cgr. ki. se • PRINTS, multiple motifs consisting of ungapped, aligned segments of sequences, which serve as fingerprints for a protein family • www. bioinf. man. ac. uk • BLOCKS, multiple motifs of ungapped, locally aligned segments created automatically • fhcrc. org
This lecture is mostly based on • Lecture on Sequence alignment by Per Kraulis, SBC, Uppsala University – www. sbc. su. se/~per/molbioinfo 2001/multali. html • Elementary Sequence Analysis by Brian Golding, Computational Biology, Mc. Master U. – helix. biology. mcmaster. ca/courses. html • A rich resource of lectures is given at Research Computing Resource New York Universtiy School of Medicine – www. med. nyu. edu/rcr/btr/complete. html
Manual Alignment- software GDE- The Genetic Data Environment (UNIX) CINEMA- Java applet available from: – http: //www. biochem. ucl. ac. uk Seqapp/Seqpup- Mac/PC/UNIX available from: – http: //iubio. indiana. edu Se. Al for Macintosh, available from: – http: //evolve. zoo. ox. ac. uk/Se-Al. html Bio. Edit for PC, available from: – http: //www. mbio. ncsu. edu/RNase. P/info/programs/BIOEDIT/bi oedit. html