Lecture 09 B Phase Diagrams B Prof DR
 Phase Diagrams (B) Prof. DR. Adel Abd El-Mageed")
Lecture # 09 (B) Phase Diagrams (B) Prof. DR. Adel Abd El-Mageed
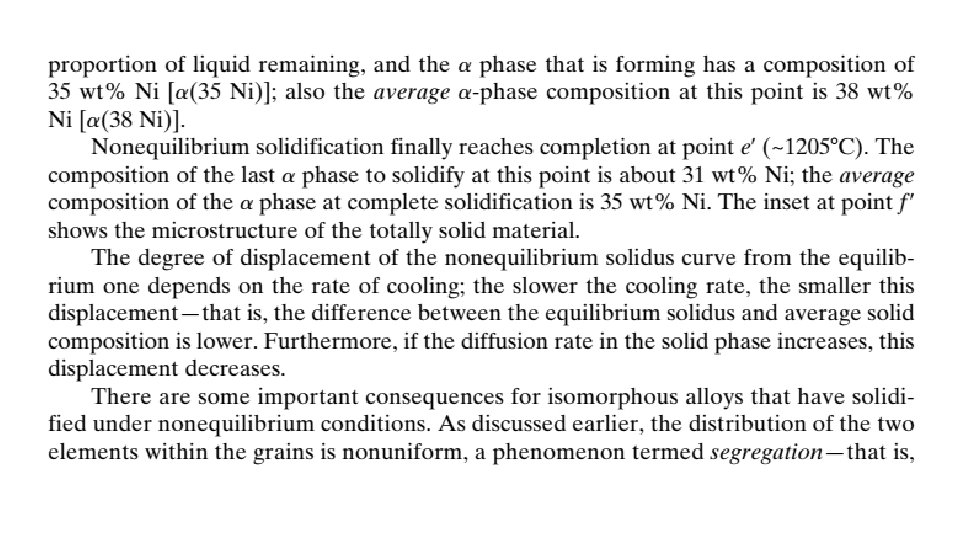

9. 10 MECHANICAL PROPERTIES OF ISOMORPHOUS ALLOYS We now briefly explore how the mechanical properties of solid isomorphous alloys are affected by composition as other structural variables (e. g. , grain size) are held constant. For all temperatures and compositions below the melting temperature of the lowest melting component, only a single solid phase exists. Therefore, each component experiences solid-solution strengthening or an increase in strength and hardness by additions of the other component.

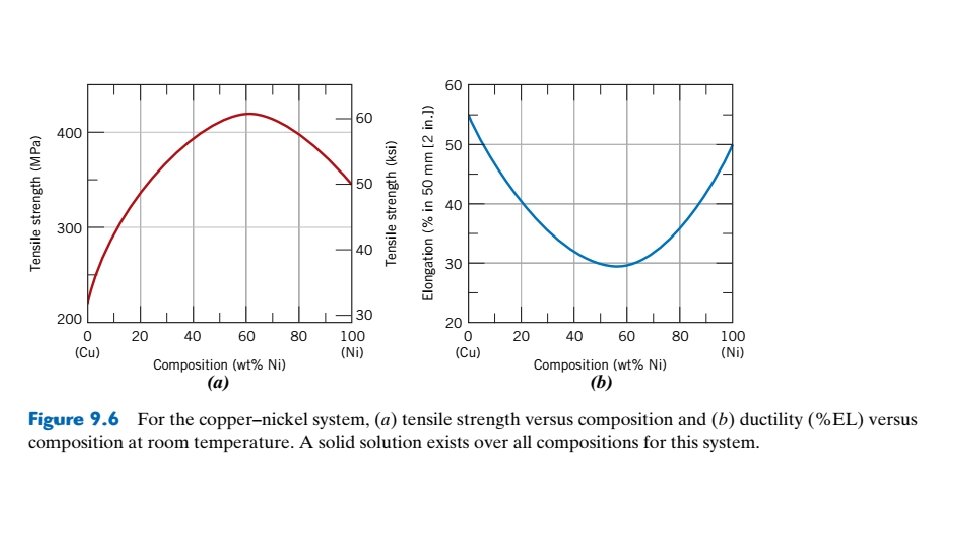
This effect is demonstrated in Figure 9. 6 a as tensile strength versus composition for the copper–nickel system at room temperature; at some intermediate composition, the curve necessarily passes through a maximum. Plotted in Figure 9. 6 b is the ductility (%EL)–composition behavior, which is just the opposite of tensile strength—that is, ductility decreases with additions of the second component, and the curve exhibits a minimum. 9. 11 BINARY EUTECTIC SYSTEMS
")
The following is a portion of the H 2 O–Na. Cl phase diagram: (a) Using this diagram, briefly explain how spreading salt on ice that is at a temperature below 0 C (32 F) can cause the ice to melt. (b) At what temperature is salt no longer useful in causing ice to melt?

EXAMPLE PROBLEM 9. 2
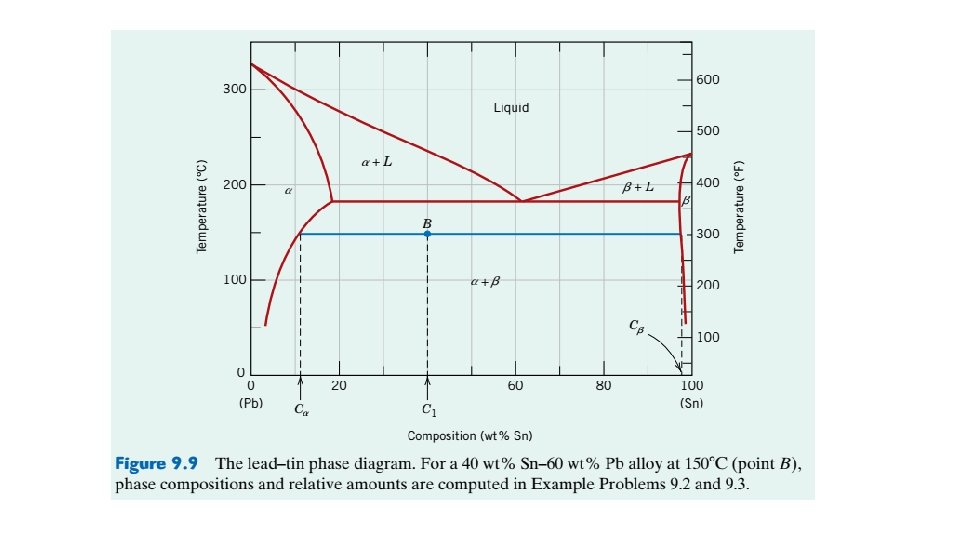
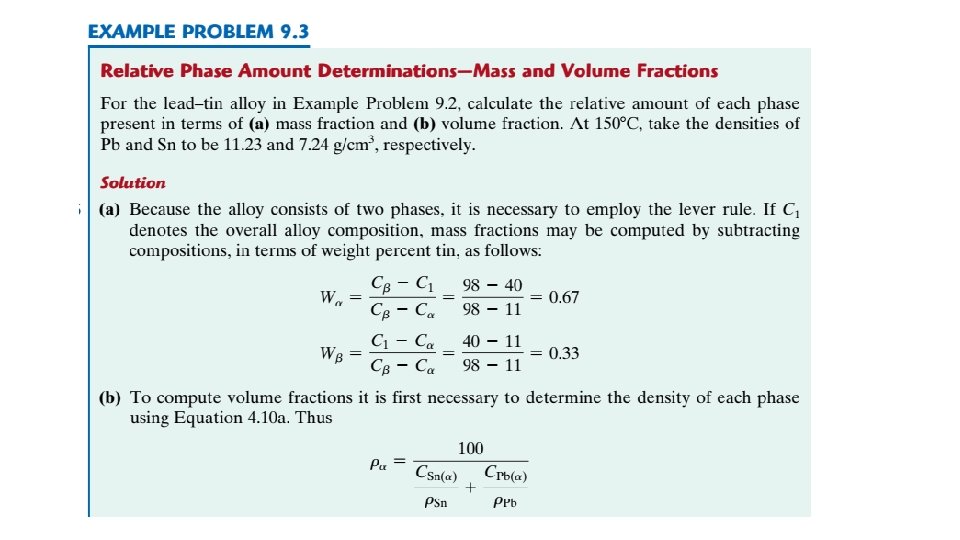
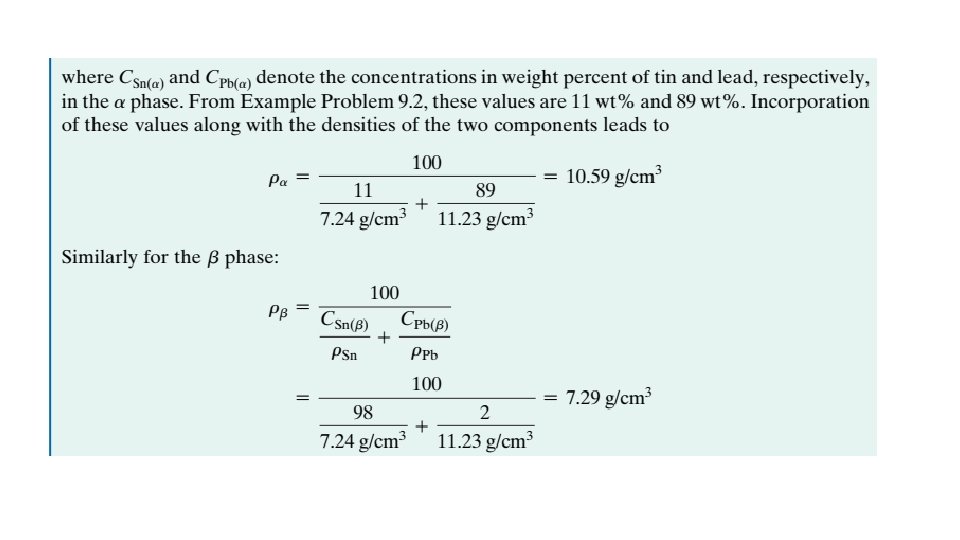
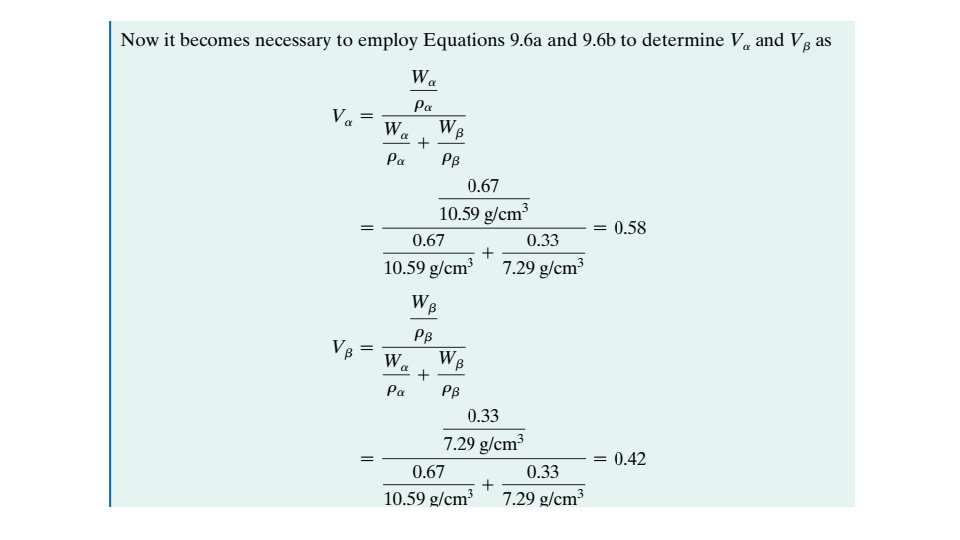
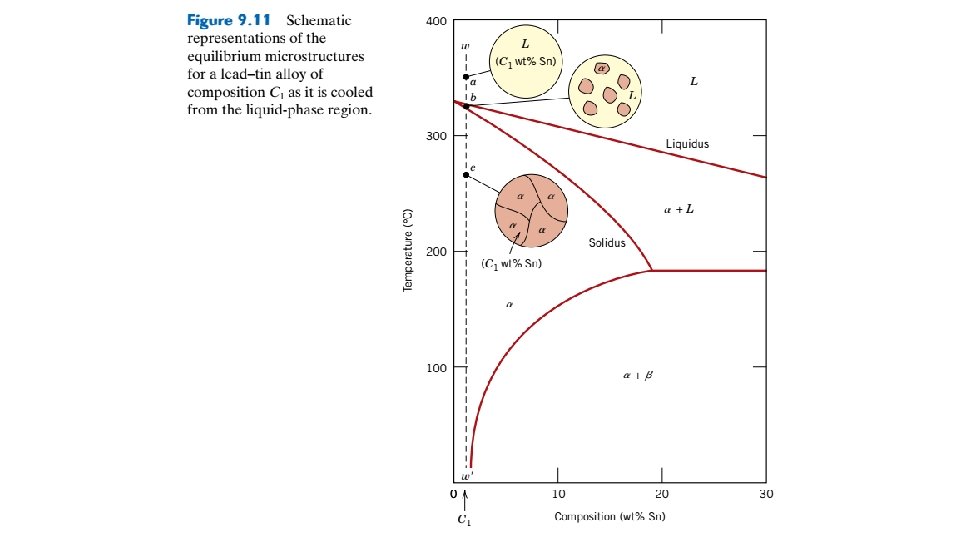

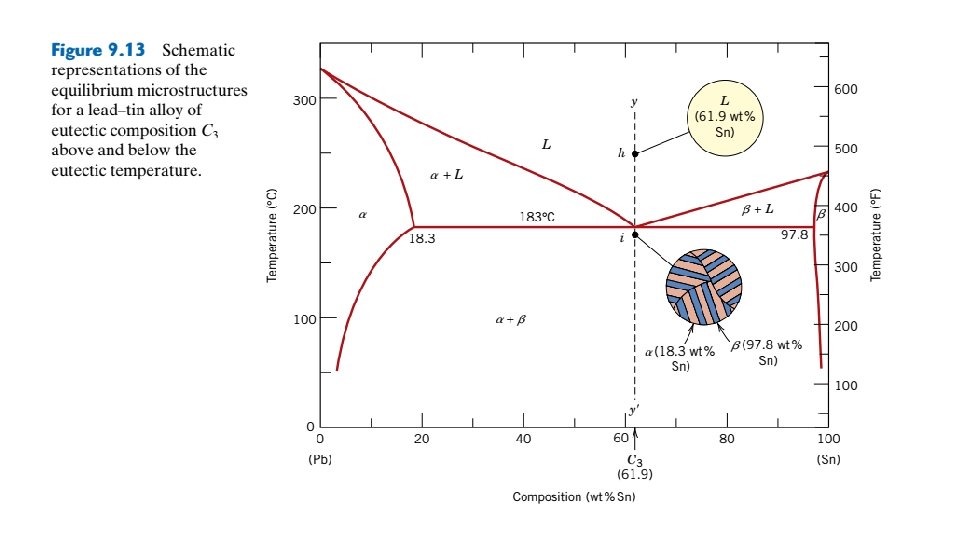
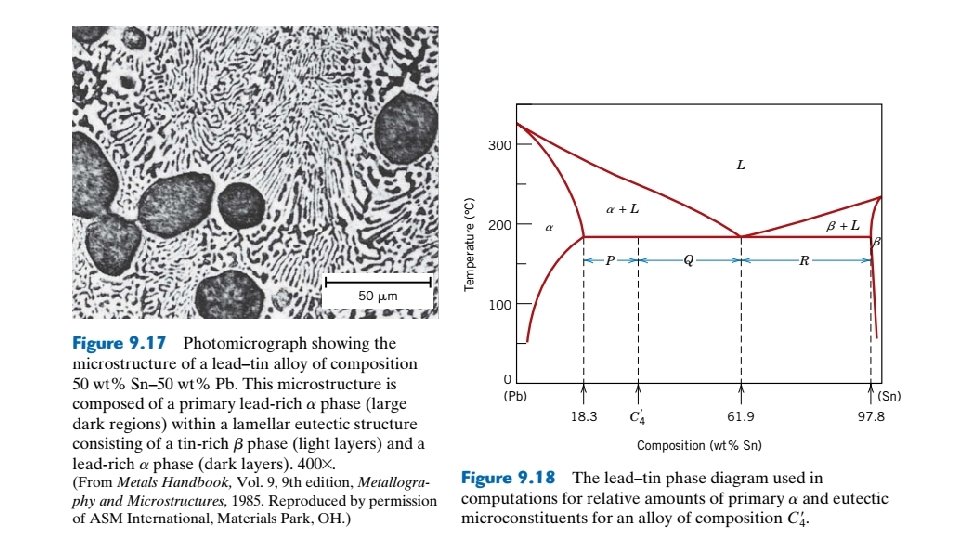
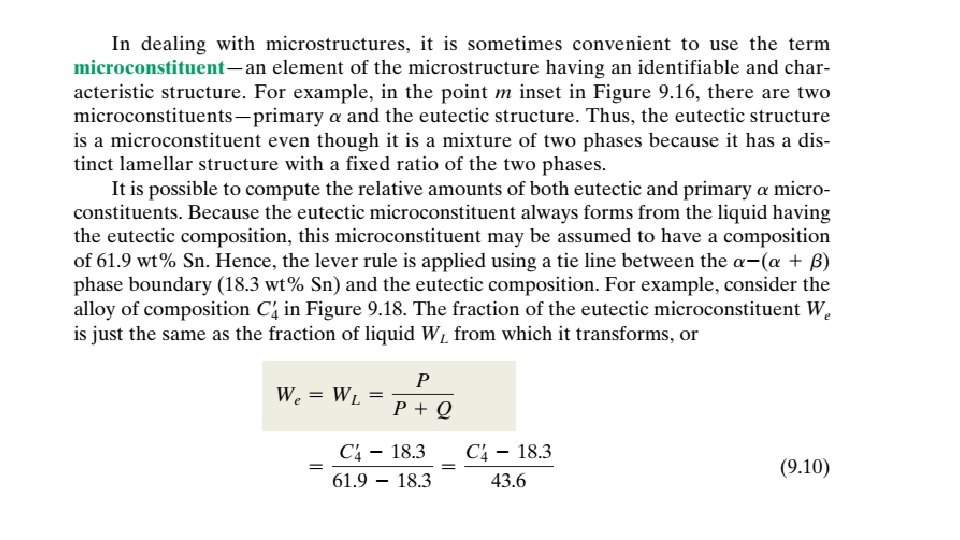
Figure 9. 12 Schematic representations of the equilibrium microstructures for a lead–tin alloy of composition C 2 as it is cooled from the liquidphase region.

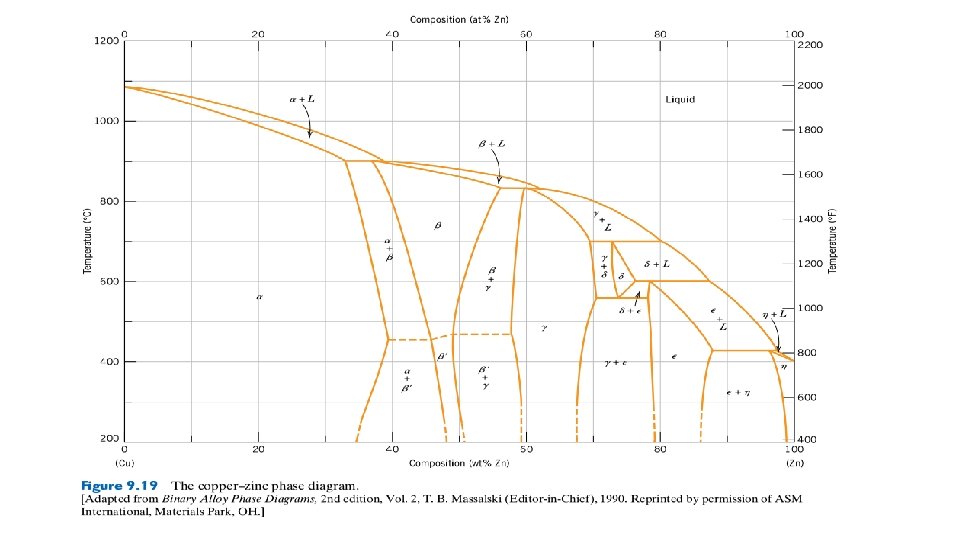
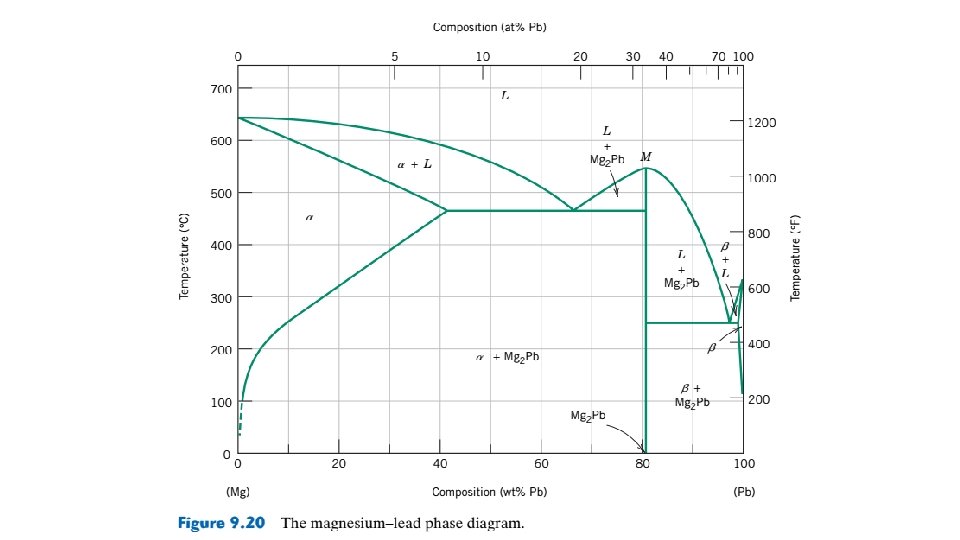
9. 13 EQUILIBRIUM DIAGRAMS HAVING INTERMEDIATE PHASES OR COMPOUNDS
- Slides: 42