Lecture 07 Hemoglobin Hematocrit RBC Indices Keohane EM

Lecture 07 Hemoglobin, Hematocrit, RBC Indices Keohane EM, Smith LJ, Walenga JM Rodak Hematology 5 th Ed, 2016, Chapter 14 Elaine M. Keohane, Ph. D, MLS keohanem@umdnj. edu University of Medicine and Dentistry of New Jersey School of Health Related Professions and Kyung Jin Cho, Ph. D chokj@korea. ac. kr Korea University, College of Health Sciences Apr 19 , 2019 1

Hemoglobin Determination Cyanmet. Hb method 2

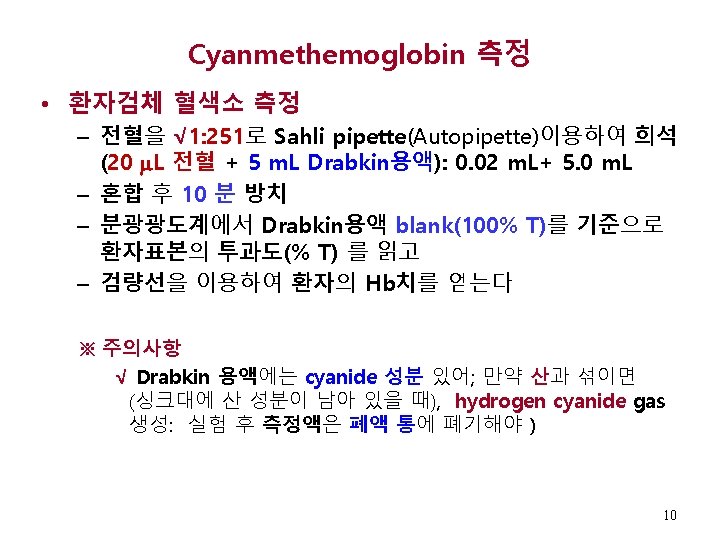
Cyanmethemoglobin 측정법 • EDTA처리 정맥혈액 또는 헤파린처리모세관혈액 Drabkin 용액은 RBC용해하여 Hb 방출 √ Drabkin solution: Na. HCO 3, K 3 Fe(CN)6, KCN √ Ferrous (Fe 2+) Hb Potassium ferricyanide (K 3 Fe(CN)6) Met. Hb (Fe 3+) Potassium cyanide (KCN) Met. Hb (Fe 3+) √ Cyanmethemoglobin (540 nm에서 비색) • Cyanmet. Hb의 흡광도는 Hb농도에 그대로 비례 함 3

Cyanmethemoglobin 측정법 - 계속 Spectronic 20 D+ https: //www. youtube. com/watch? v=jm. Zomiz. SPxw 4

Cyanmethemoglobin 측정법 - 계속 Spectronic 20 부위설명 1. Sample compartment 2. Digital readout 3. Mode indicators 4. Mode selection 5. Decrease 6. Increase 7. Print 8. Wavelength control 9. Transmittance/Absorbance control (100%T/0 A) 10. Power switch/Zero (0%T) Control 11. Filter lever 5
 (2) (3) (4) (5) Turn on")
Cyanmethemoglobin 측정법 - 계속 Spectronic 20 캘리브레이션 (1) (2) (3) (4) (5) Turn on – 15 분 warm up Wave length 설정 Filter 위치 선택 0%T(투과도) 세팅 0%T 또는 A(흡광도)로 모드 설정 (6) Blank 큐벳 넣고 (7) 100% T or 0 A로 조정 (8) Sample 큐벳 넣고 (9) %T(투과도) 또는 A(흡광도) 수치를 읽는다 https: //www. youtube. com/watch? v=jm. Zomiz. SPxw 6
 준비 표준검량선 준비요령 (예): 20 g/d. L 표준액")
Cyanmethemoglobin 측정법 - 계속 표준검량선(Standard Curve) 준비 표준검량선 준비요령 (예): 20 g/d. L 표준액 이용 시 √ Cyanmet. Hb표준액: 기지농도(20) g/d. L Hb Eq. 표준액. √ 아래 도표대로, Cyanmet. Hb표준액과 Drabkin sol 이용하여 5단계 농도(blank, 5 g/d. L, 10 g/d. L, 15 g/d. L, 20 g/d. L) tube 준비 Drabkin sol으로 희석한 후의 각 표준 Hb농도(g/d. L) Tube #1 Tube #2 Tube #3 Tube #4 Tube #5 0 g/d. L (Blank) 5 g/d. L 10 g/d. L 15 g/d. L 20 g/d. L (1: 4 dilution) (1: 2 dilution) (3: 4 dilution) (Undiluted) Hb 20 g/L Eq. Cyanmet Hb 표준액 0 m. L 1. 5 m. L 3 m. L 4. 5 m. L 6 m. L Drabkin solution 6 m. L 4. 5 m. L 3 m. L 1. 5 m. L 0 m. L 7
 Keohane")
Cyanmethemoglobin 측정법 - 계속 Semilog Paper for Hb Standardization Hemoglobin concentration (g/d. L) Keohane EM et al. , Rodak Hematology 5 th Ed. , p 193
 blank : 5")
Cyanmethemoglobin 측정법 - 계속 표준검량선 - Drabkin sol blank (100% T) blank : 5 g/d. L: 10 g/d. L: 15 g/d. L: 20 g/d. L: 100 % T 72. 9% T 53. 2% T 39. 1% T 28. 7% T % Transmittance 를 기준으로 각 표준액에서의 투과도(%T) 값을 읽어 기록 • Tr(%) read in each tubes - Semilog paper에 X-축의 각 표준액 농도에서의 해당 %T값 들을, Blank 각각 Y-축에 표시한 후, (Drabkin sol) 검량선 완성 0 Hemoglobin Concentration (g/d. L) Fig 14 -5: : Rodak, Fritsma, Keohane: Hematology: Clinical Principles and Applications , Elsevier items and derived items © 2012, 2007, 2003 by Saunders, an imprint of Elsevier, Inc p. 178 9
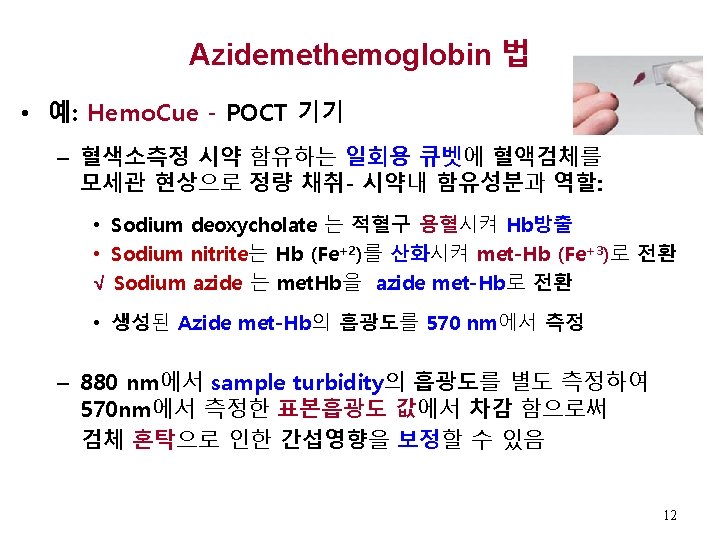

Hemo. Cue Hb 201+ System https: //www. youtube. com/watch? v=a 6 lw. JG 8 U 5 k. A Fig. 14 -19. Rodak Hematology, Keohane ME. Et al. , 5 th Ed. 2016, p 205 13

√ Hemoglobin의 참고범위 • Males: 13. 5 -18. 0 g/d. L 135 -180 g/L • Females: 12. 0 -15. 0 g/d. L 120 -150 g/L • Newborns: 16. 5 -21. 5 g/d. L 165 -215 g/L 15
 √ 일정량의 전혈 중 적혈구가 차지하는 용적율(%) Plasma")
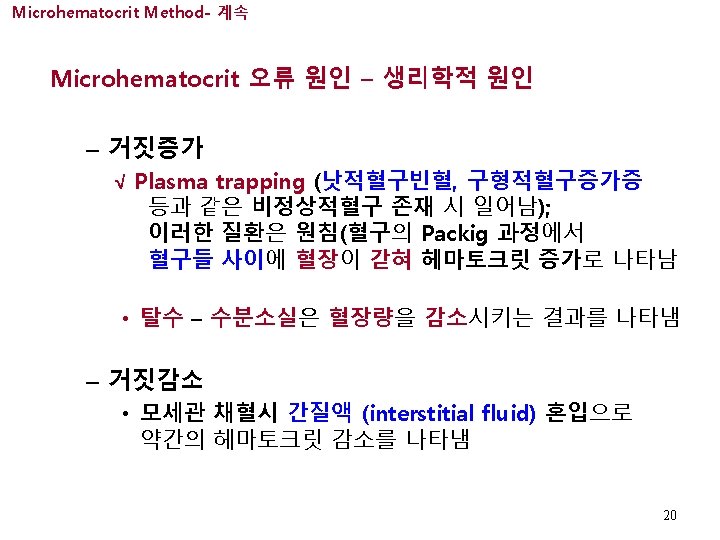
Microhematocrit Method Hct (PCV-Packed Cell Volume) √ 일정량의 전혈 중 적혈구가 차지하는 용적율(%) Plasma Whole Blood Buffy Coat (Mononuclear √ RBC layer Cells, Plts) only Fig. 14 -8 Rodak Hematology, Keohane ME. Et al. , 5 th Ed. 2016, p 195 16

Microhematocrit Method- 계속 • 항응고제: EDTA or heparin • 측정방법: • 폴리에틸렌 모세관에 혈액검체를 채우고 • 한쪽 끝을 점토로 봉입하고, • 10, 000 -15, 000 g(√ 11, 000 rpm) 에서 5분 원침. 적혈구를 최대한 packing 하는 원침시간은 검사실에 따라 최적시간으로 결정 • Microhematocrit reader plate를 이용하여 Hct 결과치를 읽는다 (buffy coat는 불포함) • 두 개 표본 이용하여 측정하며, • 두 개의 결과치에서 1% 이내로 일치해야 Fig 14 -7: Rodak, Fritsma, Keohane: Hematology: Clinical Principles and Applications, Elsevier items and derived items © 2012, 2007, 2003 by Saunders, an imprint of Elsevier, Inc p. 179 17

Microhematocrit Method- 계속 Microhematocrit Reader Fig 14 -6: Rodak, Fritsma, Keohane: Hematology: Clinical Principles and Applications, Elsevier items and derived items © 2012, 2007, 2003 by Saunders, an imprint of Elsevier, Inc p. 179 18

Microhematocrit Method- 계속 Microhematocrit 참고범위 √ 참고범위 • Male 0. 40 -0. 54 L/L 40 -54% • Female 0. 35 -0. 49 L/L 35 -49% • Newborns 0. 48 -0. 68 L/L 48 -68% 19

√ Rule of Three • When RBCs are normocytic and normochromic: √ Hb = RBC x 3, Hct = (Hb x 3) ± 3 Example 1: Hb is 10 g/d. L and the Hct is 29%; [10(Hb) x 3] + 3 = 30 + 3 (Hct%) You expect the Hct to be between 27% and 33% The Hct is 29% so the Hb and Hct correlate Example 2: Hb is 11 g/d. L and the Hct is 40%; [11 (Hb) x 3] + 3 = 33 + 3 You expect the Hct to be between 30% and 36% if Hct is 40%, so the Hb and Hct do not correlate 22

RBC INDICES: MCV, MCHC 23
 MCV (평균적혈구용적): 적혈구용적의 평균치 √ MCV = Hematocrit (%) x 10 RBC")
RBC Indices(적혈구지수) MCV (평균적혈구용적): 적혈구용적의 평균치 √ MCV = Hematocrit (%) x 10 RBC (x 1012/L) 해석: √ 80 -100 f. L • < 80 f. L • > 100 f. L • < 50 or > 150 f. L Normocytic Microcytic Macrocytic Error f. L = femtoliter = 10– 15 L 24

적혈구지수와 혈액도말상 RBC모양의 상관성 MCV: Normocytic: 80 -100 f. L RBCs are normal in size (6 -8 m) Microcytic: < 80 f. L RBCs are smaller (< 6 m) Macrocytic: > 100 f. L RBCs are larger (> 8 m)
: 적혈구 한 개가 갖고 있는 평균혈색소 량 √")
RBC Indices – Cont’d MCH (평균적혈구혈색소량): 적혈구 한 개가 갖고 있는 평균혈색소 량 √ MCH = 해석: √ 26 -32 pg Hemoglobin (g/d. L) X 10 RBC (x 1012/L) Normal pg = picogram = 10– 12 g 26
: 적혈구 한 개내 들어있는 평균혈색소농축도 √ MCHC =")
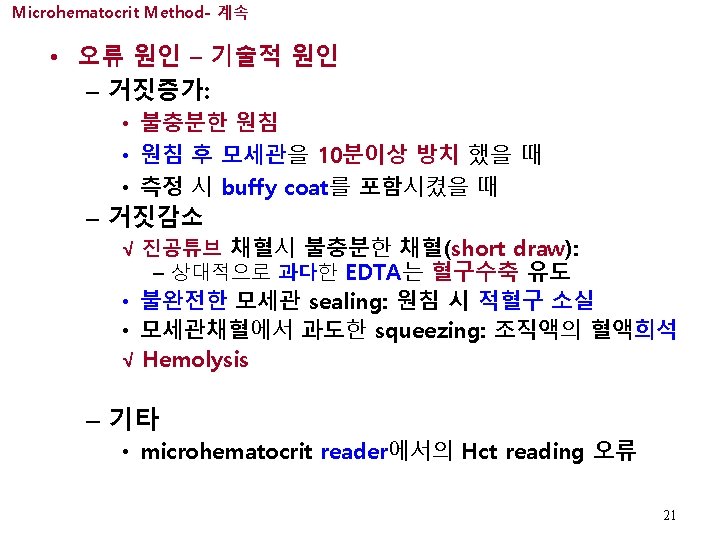
RBC Indices – Cont’d MCHC (평균적혈구혈색소농축도): 적혈구 한 개내 들어있는 평균혈색소농축도 √ MCHC = Hemoglobin (g/d. L) X 100 Hematocrit (%) 해석: √ 32 -36 g/d. L (%) Normochromic • < 30 g/d. L Hypochromic • 36 -38 g/d. L Spherocytic √ > 38 g/d. L 불가능 27

Correlation of Indices to RBC Appearance on Blood Smear – Cont’d √ Normocytic, Normochromic MCV and MCHC = Normal Macrocytic MCV = Increased Microcytic, Hypochromic MCV and MCHC = Decreased 29

Correlation of Indices to RBC Appearance on Blood Smear – Cont’d Spherocyte MCHC = 36 -38 g/d. L 30

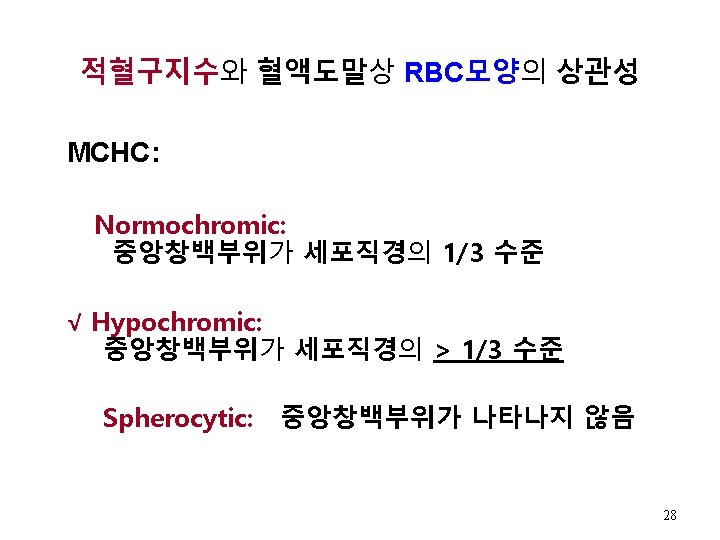
적혈구지수 계산 - Example √ 어떤 환자의 CBC결과 중 다음과 같은 data를 얻었다. 환자결과: RBC count of 4. 0 x 1012/L(x 106/μL), Hb of 12 g/d. L, Hct of 36%. 이 환자의 MCV, MCHC는? MCV = 36 x 10 = 90 f. L 4 MCH = 12 x 10 = 30 pg 4 MCHC = 12 x 100 = 33. 3 g/d. L 36 31
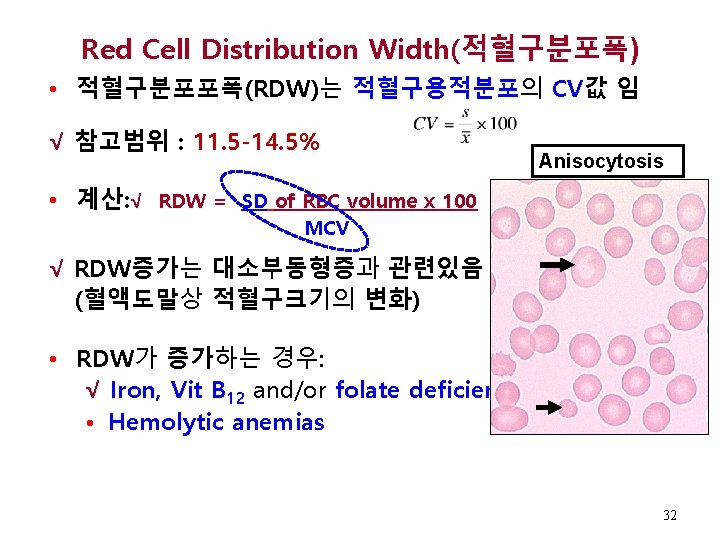

Red Cell Distribution Width and RBC Histogram MCV # cells Normal variation in size 70 f. L 90 f. L 110 f. L Distribution of RBC volume between 80 and 100 f. L 33

RDW and RBC Histogram Normal MCV # cells Normal RDW 70 f. L 90 f. L 110 f. L # cells Normal MCV Increased RDW 70 f. L 90 f. L 110 f. L 34

RDW and RBC Histogram Decreased MCV Increased MCV # cells Normal RDW 70 f. L # cells 90 f. L 110 f. L 70 f. L 90 f. L 110 f. L Increased Decreased MCV Increased RDW 70 f. L 90 f. L 110 f. L 35
- Slides: 35