Lecture 01 Overview of the Problem of Fracture

Lecture #01 Overview of the Problem of Fracture and Fatigue in Structures Prof. Dr. Adel Abd El-Mageed

1. 1 Historical Background ALTHOUGHTHE TOTAL number of structures that have failed by brittle fracture is low, brittle fractures have occurred and do occur in structures. The following limited historical review illustrates the fact that brittle fractures can occur in all types of engineering structures such as tanks, pressure vessels, ships, bridges, airplanes, and buildings. Brittle fracture is a type of failure in structural materials that usually occurs without prior plastic deformation and at extremely high speeds (as high as 7000 ft/s in steels). The fracture is usually characterized by a flat cleavage fracture surface with little or no shear lips, as shown in Figure 1. 1, and at average stress levels below those of general yielding. Brittle fractures are not as common as fatigue, yielding, or buckling failures, but when they do occur, they may be more costly in terms of human life and/or property damage. Shank and Parker have reviewed many structural failures, beginning in the late 1800 s when members of the British Iron and Steel Institute reported the mysterious cracking of steel in a brittle manner. In 1886, a 250 -ft-high standpipe in Gravesend, Long Island, failed by brittle fracture during its hydrostatic acceptance test. During this same period, other brittle failures of riveted structures such as gas holders, water tanks, and oil tanks were reported even though the materials used in these structures had met all existing tensile and ductility requirements.

One of the most famous tank failures was that of the Boston molasses tank, which failed in January 1919 while it contained 2, 300, 000 gal of molasses. Twelve persons drowned in molasses or died of injuries, 40 others were injured, and several horses drowned. Houses were damaged, and a portion of the Boston Elevated Railway structure was knocked over. An extensive lawsuit followed, and many well-known engineers and scientists were called to testify. After years the court-appointed auditor handed of testimony, down the decision that the tank failed by overstress. In commenting on the conflicting technical testimony, the auditor stated in his decision, "amid this swirl of polemical scientific waters, it is not strange that the auditor has at times felt that the only rock to which he could safely cling was the obvious fact that at least one half of the scientists must be wrong. . " His statement fairly well summarized the state of knowledge among FIG. 1. 1 Photograph of typical brittleengineers regarding the phenomenon of brittle fracture surface. fracture. At times, it seems that his statement is still true today.

Prior to World War II, several welded vierendeel truss bridges in Europe failed shortly after being put into service. All the bridges were lightly loaded, the temperatures were low, the failures were sudden, and the fractures were brittle. Results of a thorough investigation Indicated that most failures were initiated in welds and that many welds were defective (discontinuities were present). The Charpy V-notch impact test results showed that most steels were brittle at the service temperature. However, in spite of these and other brittle failures, it was not until the large number of World War II ship failures that the problem of brittle fracture was fully appreciated by the engineering profession. Of the approximately 5000 merchant ships built during World War II, more than 1000 had developed cracks of considerable size by 1946. Between 1942 and 1952, more than 200 ships had sustained fractures classified as serious, and at least 9 T-2 tankers and 7 Liberty ships had broken completely in two as a result of brittle fractures. The majority of fractures in the Liberty ships started at square hatch corners or square cutouts at the top of the sheer strake. Design changes Involving rounding and strengthening of the hatch corners, removing square cutouts In the shear strake, and adding riveted crack arresters in various locations led to immediate reductions in the incidence of failures.

The brittle fracture of the 584 -ft-long Tank Barge I. O. S. 3301 in 1972, in which the 1 -year-old vessel suddenly broke almost completely in half while in port with calm seas (Figure 1. 2), shows that this type of failure continues to be a problem. In this particular failure, the material had very good notch toughness as measured by one method of testing (Charpy V-notch) and marginal toughness as measured by another more severe method of testing (dynamic tear). However, the primary cause of failure was established to be an unusually high loading stress caused by improper ballasting at a highly constrained welded detail. FIG. 1. 2 Photograph of I. O. S. 3301 barge failure.

On December 15, 1967, this bridge collapsed without warning, resulting in the loss of 46 lives. Photographs of an identical eyebar suspension bridge before the collapse and of the Point Pleasant Bridge after the collapse are shown in Figures 1. 3 and 1. 4, respectively. An extensive investigation of the collapse was conducted by the National Transportation Safety Board (NTSB) ], and its conclusion was "that the cause of the bridge collapse was the cleavage fracture in the lower limb of the eye of eyebar 330. " Because the failure was unique in several ways, numerous investigations of the failure were conducted. Extensive use of fracture mechanics was made by Bennett and Mindlin in their metallurgical investigation of the Point Pleasant Bridge fracture. They concluded that: 1. "The fracture in the lower limb of the eye of eyebar 330 was caused by the growth of a flaw to a critical size for fracture under normal working stress. 2. The initial flaw was due to stress-corrosion cracking from the surface of the hole in the eye. There is some evidence that hydrogen sulfide was the reagent responsible for the stresscorrosion cracking. The final report indicates that the initial flaw was due to fatigue, stresscorrosion cracking, and/or corrosion fatigue.

FIG. 1. 3 Photograph of St. Mary's Bridge similar to the Point Pleasant Bridge. FIG. 1. 4 Photograph of Point Pleasant Bridge after collapse. 3. The composition and heat treatment of the eyebar produced a steel with very low fracture toughness at the failure temperature. 4. The fracture resulted from a combination of factors; in the absence of any of these, it probably would not have occurred: (a) the high hardness of the steel which rendered it susceptible to stress-corrosion cracking; (b) the close spacing of the components in the joint which made it impossible to apply paint to the most highly stressed region of the eye, yet provided a crevice in this region where water could collect; (c) the high design load of the eyebar chain, which resulted in a local stress at the inside of the eye greater than the yield strength of the steel;
 the low fracture toughness of the steel which permitted the initiation of complete")
(d) the low fracture toughness of the steel which permitted the initiation of complete fracture from the slowly propagating stress-corrosion crack when it had reached a depth of only 0. 12 in. (3. 0 mm) [Figure 1. 5]. Fracture mechanics has shown that because of the interrelation among materials, design, fabrication, and loading, brittle fractures cannot be eliminated in structures merely by using materials with improved notch toughness. The designer still has the fundamental responsibility for the overall safety and reliability of his or her structure. It is the objective of this book to describe the fracture, fatigue, and stress-corrosion behavior of structural materials and to show FIG. 1. 5 Photograph showing how fracture mechanics can be used in design to prevent origin of failure in Point brittle fractures and fatigue failures of engineering Structures. Pleasant Bridge. Furthermore, as existing structures reach their design life, there is considerable pressure to extend the life of these structures. Fracture mechanics can be used to establish the fitness-for-service or life extension of these structures on a rational technical basis.

As will be described, the science of fracture mechanics can be used to describe quantitatively the tradeoffs among stress, material fracture toughness, and flaw size so that the designer can determine the relative importance of each during the design process. However, fracture mechanics also can be used during fitness-for-service or life-extension evaluations. 1. 2 D u c t i l e vs. Brittle B e h a v i o r Brittle fractures occur with little or no elongation or reduction in area and with very little energy absorption. Brittle fracture is a type of failure that usually occurs without prior plastic deformation and at extremely high speeds [as fast as 2000 m / s in steels]. Schematic examples of the stress-strain behavior for ductile and brittle types of failure are presented in Figure 1. 6. Most structural materials exhibit considerable strain (deformation) before reaching the tensile or ultimate strength, (Figure 1. 6 a). In contrast, brittle materials exhibit almost no deformation before failure (Figure 1. 6 b). However, under conditions of low temperature, rapid loading and/or high constraint (e. g. , when the principal stresses are essentially equal), even ductile materials may not exhibit any deformation before fracture. In these cases, the stress-strain curve of a normally ductile material resembles that shown in Figure 1. 6 b. Obviously, ductile behavior is much more desirable than brittle behavior because of the energy absorption and deformation that occurs before failure.

Ductile failures normally are characterized by large shear lips and considerable deformation (Figure 1. 7 a). In contrast, brittle fractures are usually characterized by a flat cleavage fracture surface with little or no ductility (Figure 1. 7 b and Figure 1. 1) and often at average stress levels below those of general yielding. Brittle fractures are not so common as yielding, buckling, or fatigue failures, but when they do occur they may be more costly in terms of human life and property damage. Figure 1. 2 shows a ship that failed because of a brittle fracture. This ship was subjected to above normal loads (yet the nominal stress was below yielding) in the presence of a severe stress concentration. The stress concentration increased the local constraint and restricted yielding, resulting in principal stresses that were essentially equal. Thus, the local stress reached the tensile strength of the steel with little or no yielding, and brittle fracture occurred. Once the brittle fracture was initiated, the loading condition was such that the fracture propagated completely around the ship in less than 1 s. The steel in this ship had very good ductility and notch toughness (e. g. , CVN impact value of 55 ft-lb at the service temperature), indicating that brittle fractures can be caused by severe loading and high constraint, not just by materials with low notch toughness.
 ductile material;")
FIG. 1. 6 Comparison of curves for ductile and brittle materials: (a) ductile material; (b) brittle material, FIG. 1. 7 Ductile and brittle fracture surfaces.

1. 3 N o t c h T o u g h n e s s Because it is very difficult to fabricate large welded structures without introducing some type of notch, flaw, discontinuity, or stress concentration, the design engineer must be aware of the effect of notches and constraint on material behavior. Thus, in addition to the material properties such as yield strength, modulus of elasticity, and tensile strength, there is another very important material property, namely notch toughness, that may be related to the behavior of a structure. Notch toughness is defined as the ability of a material to absorb energy in the presence of a sharp notch, often when subjected to an impact load. Notch toughness is usually measured as the amount of energy (joules) required to fracture a particular notch-toughness specimen at a particular temperature and loading rate. Notch toughness is measured with a variety of test specimens. One of the most widely used is the Charpy V-notch (CVN) impact specimen. A test machine with a pendulum is used to impact the specimens at various temperatures. The absorbed energy required to fracture the specimen is plotted as a function of temperature. Typical CVN results for common structural materials are shown in Figure 1. 8, which shows the transition from brittle to ductile behavior under conditions of impact loading. The CVN impact values shown at the lower left of Figure 1. 8 are representative of low levels of notch toughness or brittle behavior, while the values at higher temperatures (upper right) are representative

FIG. 1. 8 Charpy V-notch impact energy versus temperature behavior for selected structural materials

of ductile-type behavior. It should be noted that some materials (such as aluminum and very high-strength steels) do not exhibit a distinct transition behavior. Also, some materials have low notch toughness at all temperatures, whereas some materials have a high level of notch toughness at all temperatures. The change in absorbed energy, ductility (lateral expansion or contraction at the root of the notch), and fracture appearance (as measured by percent shear on the fracture surface) for a structural steel is shown in Figure 1. 9. At +140 F completely ductile behavior is observed. At -200 F completely brittle behavior is observed. The region between these two extremes is called the transition region. Note that the transition region is different for the two different loading rates, slow and impact. This effect of loading rates has a very significant influence on the fracture behavior of structures as described later. Various "transition temperatures" are often established as an indication of the notch toughness of a structural material. For example, the 15 ft-lb impact transition temperature for the steel shown in Figure 1. 9 a is about 30 F. The 20 - mil lateral expansion transition temperature is about 30 F. Also, the 50% impact fracture-appearance transition temperature for this steel is about 30 F as shown in Figure 1. 9 c. Obviously, these transition temperatures need not occur at the same temperature and will vary from material to material, depending on the particular notch-toughness characteristics of each material. One traditional method used to prevent brittle fracture in a member has been to specify that it can be used only above some particular transition

temperature such as the 15 ft-lb impact transition temperature. FIG. 1. 9 Charpy V-notch energy absorption, lateral expansion, and fibrous fracture for impact and slow-bend test of standard CVN specimens for a lows trength structural steel.
 test is another ASTM test method used to predict behavior")
The NDT (nil-ductility temperature) test is another ASTM test method used to predict behavior of structural steels. Below the NDT temperature, the steel is considered to be brittle under conditions of impact loading. At slow or intermediate loading rates, the steel can still exhibit satisfactory notch toughness levels at lower temperatures as shown in Figure 1. 9. All these notchtoughness tests generally have one thing in common, however, and that is to produce fracture in steels under carefully controlled laboratory conditions. It is hoped that the results of the tests can be correlated with service performance to establish levels of performance for various materials being considered for specific applications. In fact, the results of the foregoing notch toughness tests have been extremely useful in many structural applications. However, even if correlations are developed for existing structures, they do not necessarily hold for all designs, new operating conditions, or new materials because the results, which are expressed in terms of energy, fracture appearance, or deformation, cannot always be translated into structural design and engineering parameters such as stress and flaw size. Thus, a much better way to analyze fracture toughness behavior is to use the science of fracture mechanics. Fracture mechanics is a method of characterizing the fracture behavior in structural parameters that can be used directly by the engineer, namely, stress and flaw size. Fracture mechanics is based on a stress analysis and thus does not depend on the use of extensive service experience to translate laboratory results into practical design information.

1. 4 Introduction to Fracture M e c h a n i c s Fracture mechanics is a method of characterizing the fracture behavior of sharply notched structural members (cracked or flawed) in terms that can be used directly by the engineer. Fracture mechanics is based on a stress analysis in the vicinity of a notch or crack. It does not, therefore, depend on the use of extensive service experience to translate laboratory results into practical design information nas long as the engineer can obtain or determine: 1. The fracture toughness of the material, using fracture-mechanics tests or correlations with notch toughness tests such as the CVN impact test. 2. The nominal stress on the structural member being analyzed. 3. Flaw size and geometry of the structural member being analyzed. Many large, complex structures such as bridges, ships, buildings, aircraft, and pressure vessels can have crack-like imperfections, sharp notches, or discontinuities of various kinds. Using fracture mechanics, an engineer can quantitatively establish allowable stress levels and inspection requirements to design against the occurrence of fractures in such structures. In addition, fracture mechanics may be used to analyze the growth of small cracks to critical size by fatigue loading or by stress corrosion cracking. Therefore, fracture-mechanics testing and analysis techniques have several advantages over traditional notch toughness test methods and offer the designer a method of quantitative design to prevent fracture in structures. In addition,

mechanics can be used to evaluate the fitness-for-service, or life extension, of existing structures. 1. 4. 1 Driving Force, KI 1. 4. 2 R e s i s t a n c e Force, Kc

FIG. 1. 10 KI values for different crack geometries.

FIG. 1. 11 Effect of temperature and strain rate on fracture toughness of a 50 -ksi yield strength structural steel.

1. 5 Fracture. Mechanics. Design
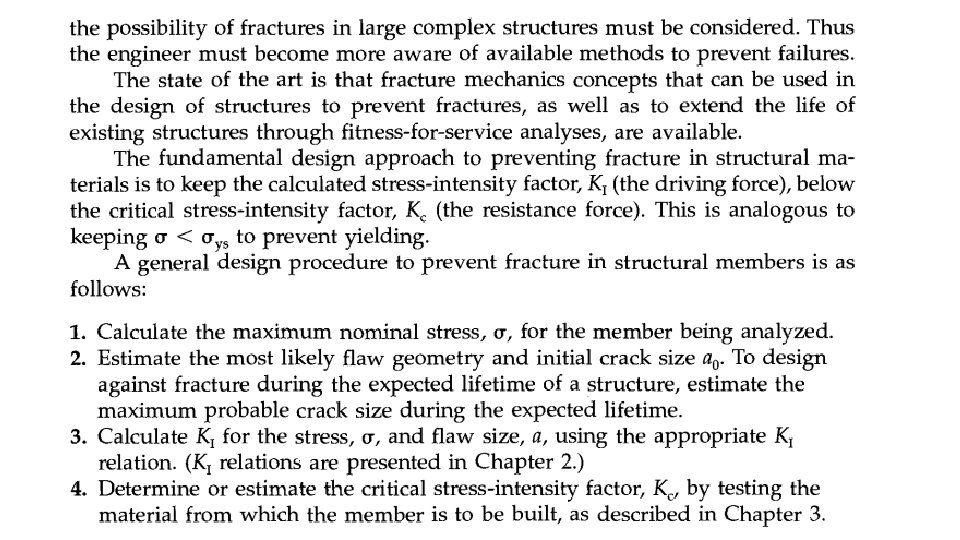
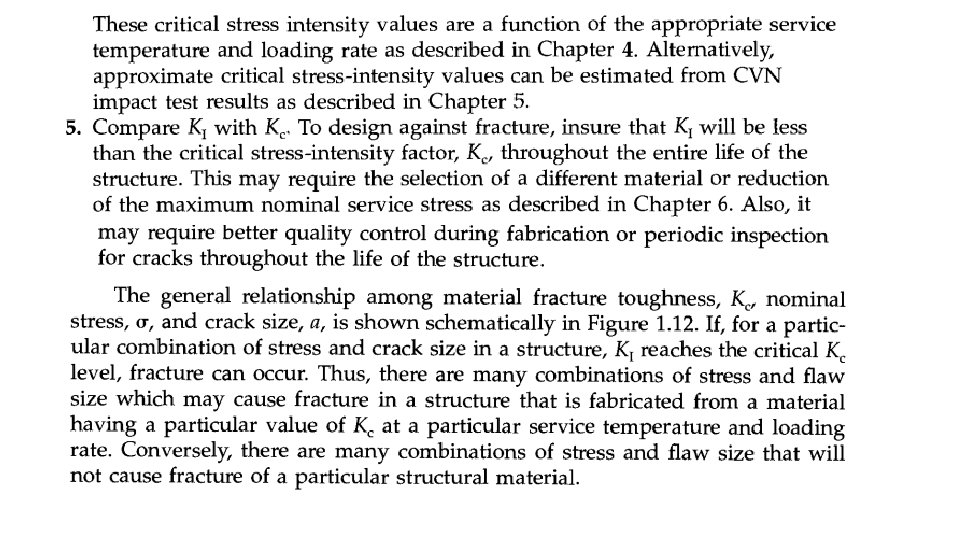
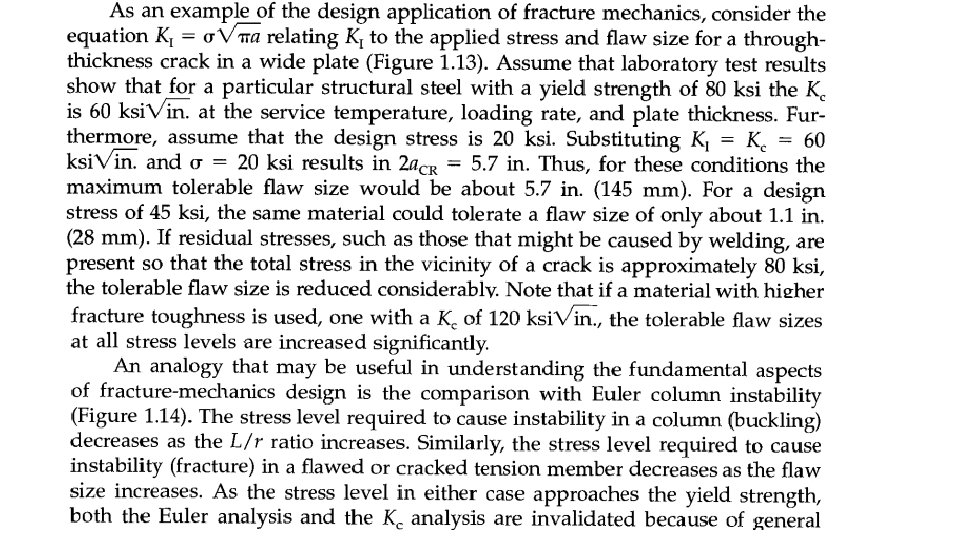

FIG. 1. 12 Schematic relation between stress, flaw size, and material toughness. FIG. 1. 13 S t r e s s - f l a w size relation for a t h r o u g h - t h i c k n e s s c r a c k in materials with K c = 60 and K c =.

1. 6 Fatigue and Stress-Corrosion Crack Growth FIG. 1. 14 Analogy between column instability and crack instability: (a) Column instability (b) Crack instability
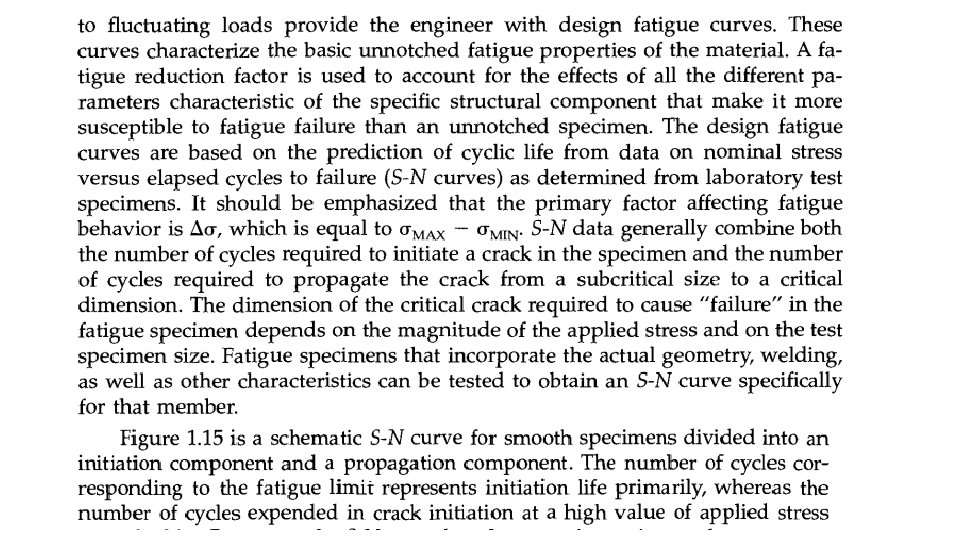

FIG. 1. 15 Schematic S-N curve divided into "initiation" and "propagation" components.

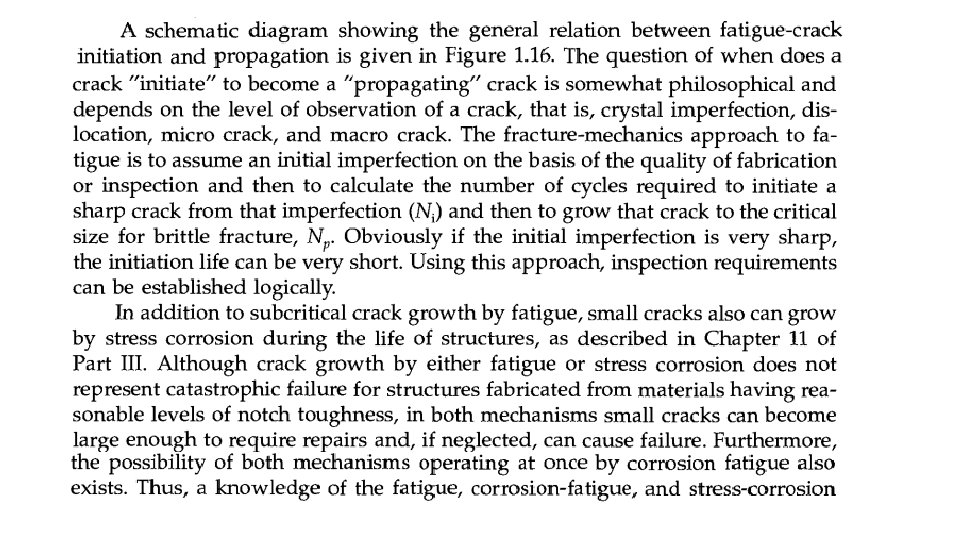
FIG. 1. 16 Schematic showing relation between "initiation" life and "propagation" life.

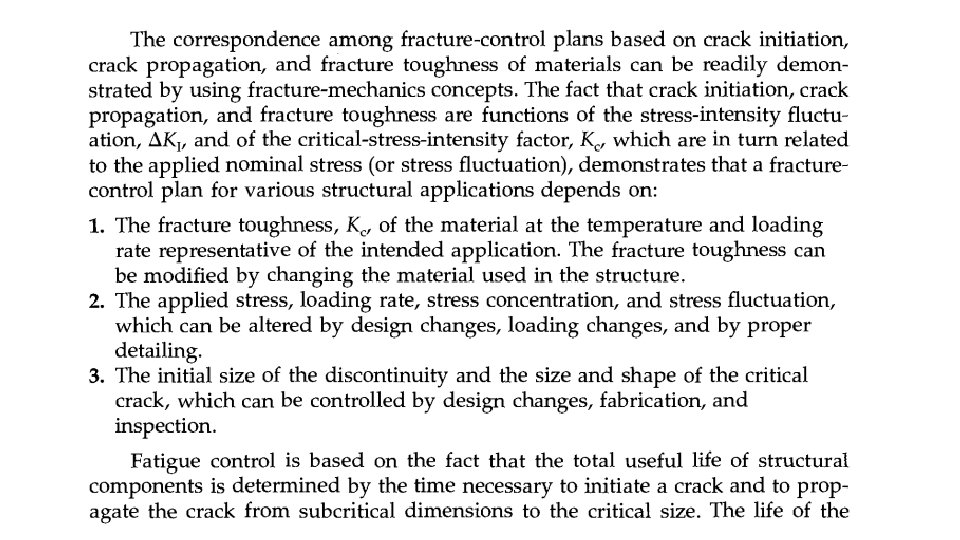
1. 7 Fracture and Fatigue Control

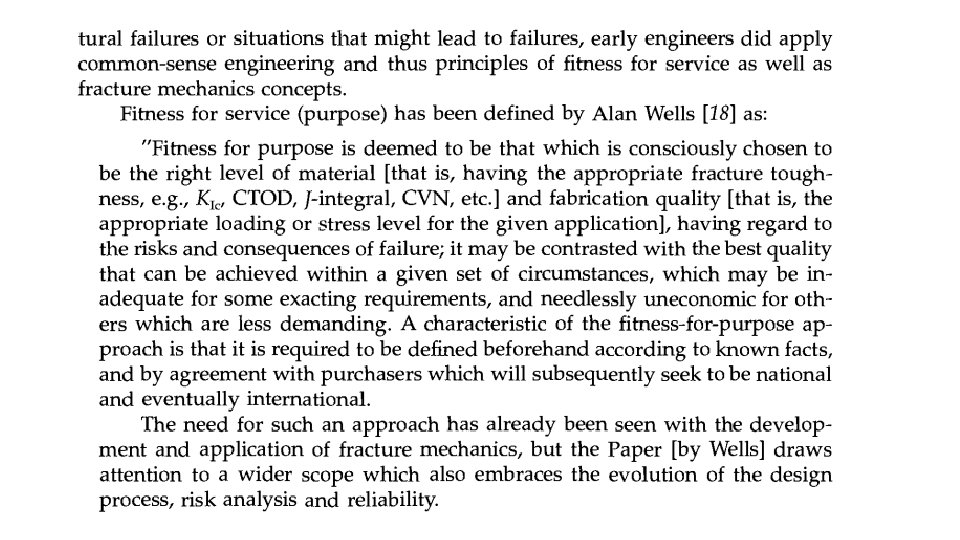
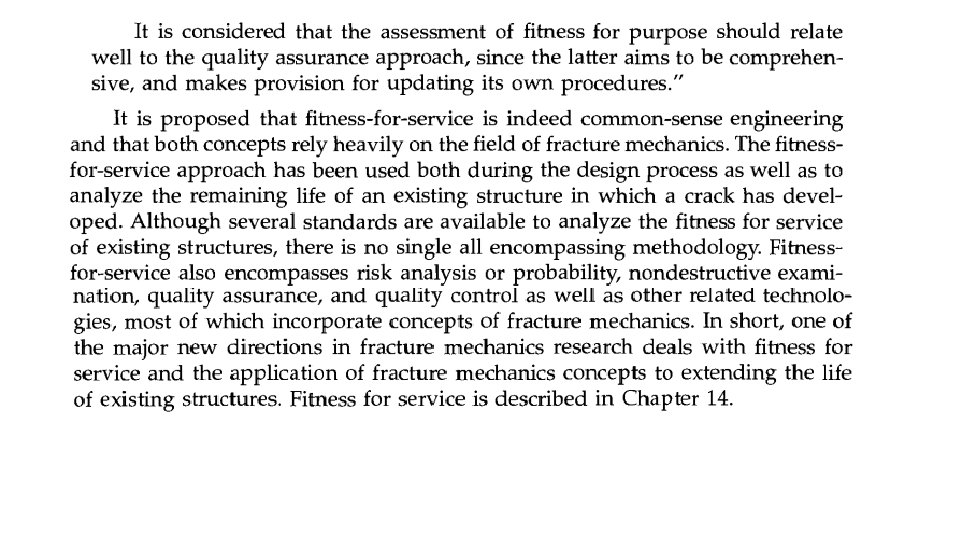
1. 8 Fracture Criteria 1. 9 Fitness for Service
- Slides: 38