Learning To Predict rare events in event sequences


 events within")


- Slides: 32
Learning To Predict rare events in event sequences By Gary M Weiss and Haym Hirsh Presented by Veena Raja Rathna
Contents • • • Aim & Introduction to the problem Basic problem Formulation Definitions & Evaluation metrics Learning methods Example & Results Time. Weaver • Reference
AIM Introduction to the problem • To predict rare events from sequences of events which contain non numerical features • An event sequence is a time stamped observations described by a fixed set of features • Why • Predicting events with categorical data is an important real world problem • Not Suited to be solved by existing statistical and machine learning methods
Background • Classical time series - Predict next ‘n’ successive observations from a history of past observations • Statistical techniques not applicable to event prediction because they require numerical features do not support predicting a specific ‘event’ within window of time.
Examples • Telecommunication equipment failure • Predicting Fraudulent credit card transactions • Start of Transcription in DNA sequences
Basic Problem Formulation • Definitions • Event- Et: is a time stamped observation which occurs at time ‘t’ and is described by a set of feature value pairs. • Event Sequence- S: is a time ordered sequence of events. S=Et 1, Et 2, …. Etn • Domain Object- D: events are associated with D which is a generator of events
Definitions • Target Event Xt : is the event to be predicted and is specified by a set of feature value pairs. • Warning Time W: is the lead time necessary for a prediction to be useful • Monitoring Time M: determines the maximum amount of time prior to target event for which a prediction is considered correct.
Problem now reduces to • Learning a prediction procedure P that correctly predicts the target events. • P is a function that maps an event sequence to a boolean prediction value. • P: Et 1, Et 2, Et 3, …Etn-->{+, -} • A target event is predicted if at least one prediction is made within its prediction period • A prediction is correct if it falls within the prediction period of some target event
Evaluation Measures for Event Prediction • Recall = #Target Events Predicted /Total target events It is the percentage of target events correctly predicted • Simple Precision = TP/TP+FP TP - true predictions FP - false Predictions Simple precision is the percentage of predictions that are correct
Evaluation Metrics • Normalized precision = #Target Events Predicted/#Target Events Predicted +FP Replaces # of correct predictions with target events correctly predicted • Reduced Predictions = #Target Events predicted/# Target Events Predicted+Discounted FP • A prediction is active for a period equal to its monitoring time
Basic Learning Method • Identify prediction patterns : The space of PP is searched to identify a set ‘C’ of candidate PP. Each pattern c C should do well at predicting a subset of target events. • Generate prediction rules : An ordered list of PP is generated from C. Prediction rules are then formed by creating a disjunction of the top n PP, thereby creating solutions with different precision/recall values. • PP is a sequence of events connected by ordering primitives that define sequential or temporal constraints between consecutive events
Ordering primitives are • Let A B C D represent individual events • ‘Wildcard’ “*” matches any number of events so the PP A*D matches ABCD • ‘next’ “. ” matches no events so the PP A. B. C only matches ABC • ‘unordered’ “|” allows events to occur in any order and is commutative so that the PP A|B|C will match , amongst others, CBA
Example • “|” has the highest precedence so the pattern “A. B*C|D|E” matches A followed by B, followed sometime later by a C, D and E in any order. • Each feature in an event is permitted to take on the “? ” value that matches any feature value. • PP also has an integer valued pattern duration
Learning Method • A PP matches an event sequence if • 1) events within the PP matches events within an event sequences • 2) ordering constraints in the PP are obeyed • 3) events involved in the match occur within the pattern duration • This language enables flexible and noise tolerant prediction rules to be constructed, such as • if 3(or more) A events & 4( or more B events occur within an hour, then predict the target event.
GA for identifying PP • Use GA to identify a diverse set of PP. • Each individual in the GA’s population represents part of a complete solution and should perform well at classifying a subset of the target events. • GA used is steady state GA where only a few individuals are modified each ‘iteration’.
Basic steps in GA • • 1. Initialize population 2. while stopping criteria not met 3. select 2 individuals from the population 4. apply mutation operator to both individuals with Pm; else apply crossover operator 5. evaluate the 2 newly formed individuals 6. Replace 2 existing individuals with the new ones • 7. done
Selection and Replacement Strategy • GA’s selection and replacement strategy must balance two opposing criteria • 1. They must focus the search in the most profitable areas of the search space. • 2. Maintain a diverse population to avoid premature convergence and to ensure that the individuals in the population collectively cover most of the target events.
Selection & Replacement Strategy • Fitness of the PP is based on both its precision and recall and is given by fitness = (( * )+1)precision recall ------------------- ( * )precision+recall • To encourage diversity we use a strategy called sharing that rewards individuals based on how different they are from other individuals in the population
Selection & Replacement Strategy • Individuals are selected proportional to their shared fitness = fitness/ count • count measures the degree of similarity of individual j to p individuals comprising the population count j= (1 -distance(j k))3 The similarity of 2 individuals is measured using a phenotypic distance metric that measures the distance based on the performance of the individual
Observations • The more similar an individual to the rest of the individuals in the population, smaller the distances & greater the count. • Replacement strategy also uses shared fitness. • Individuals are chosen for deletion inversely proportional to their shared fitness
Creating Prediction Rules • Greedy Algorithm shown is used to form a list of prediction rules S from a set of candidate patterns C • Precision, recall and prediction vector information computed in the first step for each PP are used. • Step 11 requires access to the training set and is the most time-intensive step
Algorithm • • • 1. C=patterns returned from the GA; S={}; 2. while C!=0 do 3. for c C do 4. if(increase_recall(S+c, S)<=THRESHOLD) 5. then C=C-c; 6. Elseeval=PF*(c. precision. S. precision)+increase_recall(S+c, S); 7. done 8. Best={c C, x C|c. eval>=x. eval} 9. S=S||best; C=C=best; 10. recompute S. precision on the training set; 11. done
Observations • Builds solution with increasing recall by heuristically selecting the best PP in C using eval function in line 6. • PF controls the importance of precision vs recall. PPs that do not increase the recall by at least THRESHOLD are discarded. • Both THRESHOLD AND PF affect the complexity of t he learned concept and can prevent overfitting of the data
Time. Weaver • This paper describes timeweaver a GA based ML system that predicts rare events • For AT & T , the specific task is to predict failure of 4 ESS h/w components from alarm messages. • Problem Formulation • Each 4 ESS generated alarm is an event with 3 features --device, severity , code • each 4 ESS is a domain object that generates an event sequence and the target event is any event with code set to ‘FAILURE’
Experiments • Training set 110, 000 alarms reported from 55 4 ESS switches. • Test set contained 40, 000 alarms from 20 different 4 ESS switches. This data included 1200 alarms which indicated equipment failure. • THRESHOLD was 1% and PF was 10 • Pattern 351: <TMSP, ? , MJ>*<? , ? MN> indicates that within 351 sec time period a major severity alarm on a TSMP device is followed by a major alarm and minor alarm
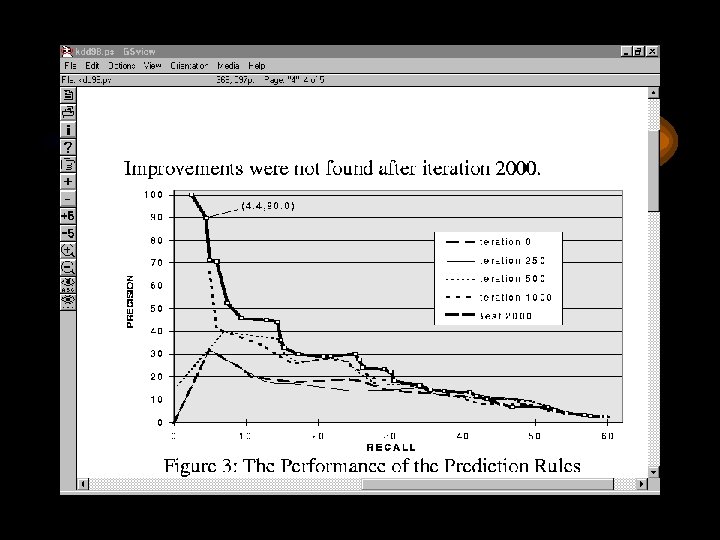
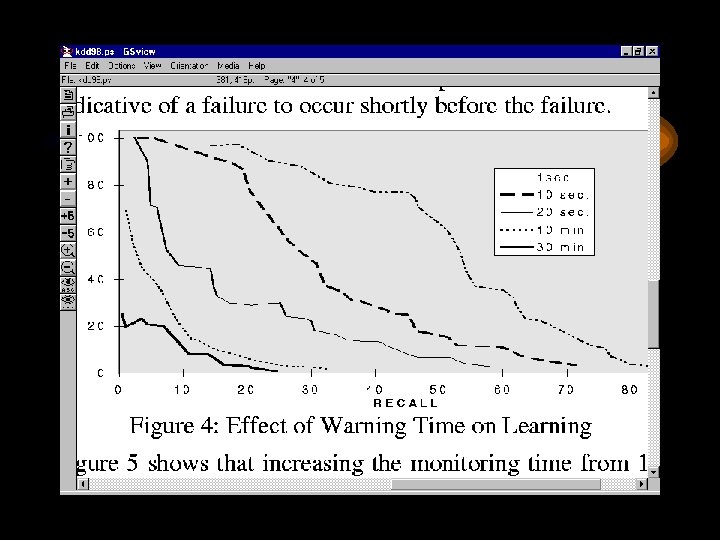
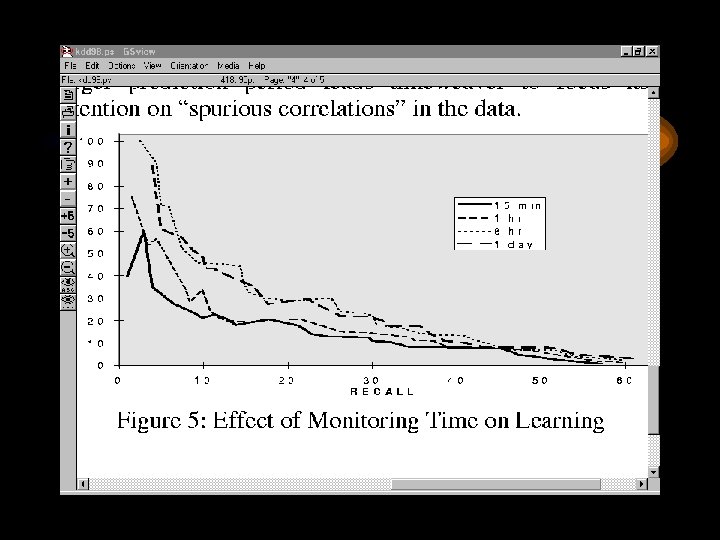
Results • Varying the warning time demonstrates that it is much easier to predict failures when short warning time is required. • Increasing the monitoring time significantly improves TW’s ability to predict failures. • Larger prediction period leads TW to focus its attention on ‘spurious correlations’ in data.
Comparision with other methods • Tw was compared to C 4. 5 rules and RIPPER - 2 rule induction systems and FOIL a system that learns logical definitions from relations. • Class distribution of the generated examples is skewed; prevented C 4. 5 rules and RIPPER from predicting any failure. • TW yields results with precision 3 -5 times higher for a given recall value than various thresholding strategies used by ANSWER system. Concept space is much more expressive.
Example • {100: a, b}, {104: c, c}, {105: d, a}, {108: c, c}, {110: a, d}, {111: crash, c}, {115: d, a}, {118: , c, c}, {119: a, d}, {124: a, b}! Format: Integer valued timestamp, colon, comma separated list of feature values. 2 feature values per event and each event can take on the values a, b, c or d. The first can also take on the value “crash”. The target event is any event with ‘crash’ as the first feature. Warning time is 2 secs and monitoring time is 8 secs. TW-GA training on this might produce PP: 4: |c, c|*|c, c|.
References • Learning to predict rare events in categorical time series data • http: //paul. rutgers. edu/~gweiss/thesis/timeweaver. html