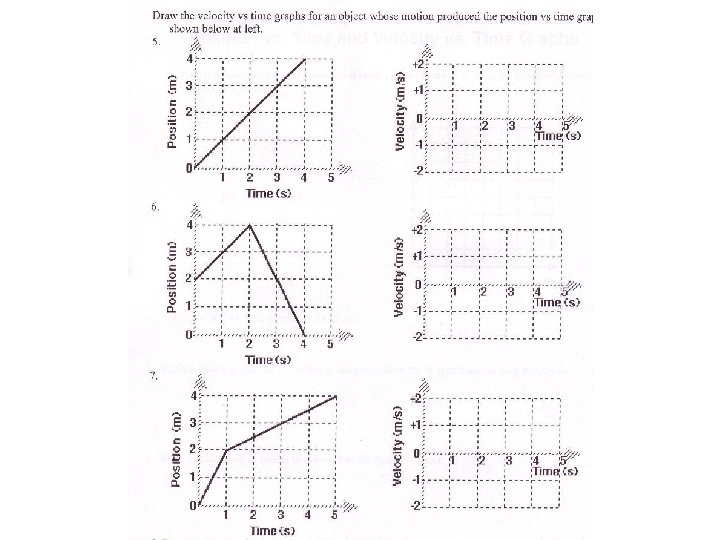
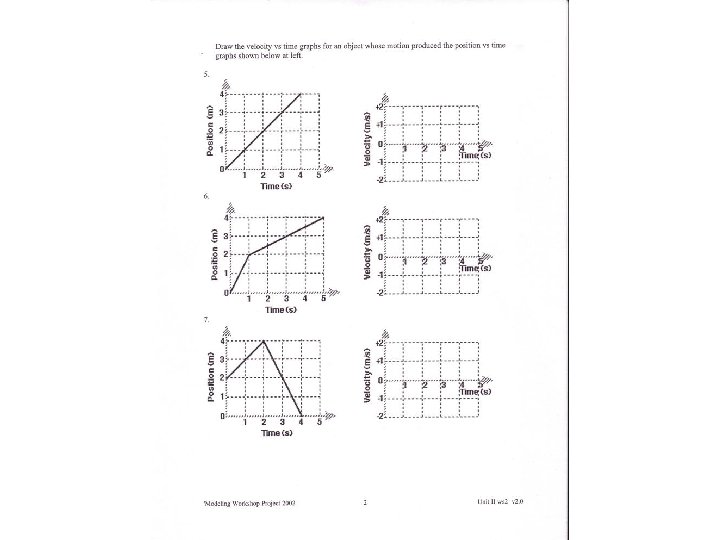
Learning Targets 2 1 Describe motion using displacement

Learning Targets 2 -1 • Describe motion using displacement, time, velocity, and frame of reference • Calculate displacement • Construct and interpret position-time graphs

Motion • Can be described in terms of displacement, time, and velocity • Can be described in words, equations, or graphs

Displacement • Length of the straight line drawn from your initial position to your final position • This is the change in position of object • SI units is meters (m) • Displacement DOES NOT equal distance traveled
 and direction (east / west) are called vectors")
Things with both magnitude (size) and direction (east / west) are called vectors

Displacement • Calculated: Δx=xf– xi Displacement = change in position= final position –initial position • It is a vector so it has both magnitude and direction
 • Negative (left and down) •")
Displacement • Can be positive (right and up) • Negative (left and down) • Known as convention – System that is chosen for convenience and consistency • If the object does not move, there is no displacement • If object returns to original starting point, there is no displacement

Distance • Needs no reference frame, it is the space between two objects • Distance has magnitude, but no direction, so it is called scalar

Coordinate system used to describe motion • Need a starting point, or a reference point that we can describe against • Reference point is zero point • What should be used as reference points? ?

• System can be on x or y axis (has negative and positive values) Position -the final separation between the object and the reference point • Direction is also needed for position • If the direction is right, east (+); and if left, west (-)

Velocity • Measure how fast something moves from one point to another • SI unit is meters per second m/s • Velocity has both magnitude and direction • Velocity and speed are not the same thing • Speed= distance / time – Has only magnitude

• 1. What is the displacement of the crosscountry team if they begin at the school, run 10 miles and finish back at the school? – 0 miles • 2. What is the distance and the displacement of the race car drivers in the Indy 500? – Distance = 500 miles – Displacement = 0 miles
 of Velocity • How fast something moves • Always positive")
Speed • Magnitude (size) of Velocity • How fast something moves • Always positive

Average Velocity • Is equal to the displacement divided by the time during which the displacement occurred • Vavg= displacement time interval • V= Δx= xf-xi Δt tf-ti

Problem Solving Strategies • When converting a velocity, convert one factor at a time • Called Factor Label Method • Ex. Convert 100. km/h to m/s • 100. km x 1000 m x 1 h = 27. 8 m/s 1 h 1 km 3600 s

Constant velocity • If the average velocity is the same for all intervals, then the object moves at a constant velocity • Constant Velocity V = x / t

Position Time Graphs • A graph that shows how position depends on time • Independent variable is the X – Time • Dependent variable on Y axis – Position

position Position vs time

Where was the object located at 2 seconds? position 5 m 4 m 3 m At 2 seconds the object is located 2 meters from the reference point 2 m 1 m 0 m 0 s 1 s 2 s time 3 s 4 s 5 s

Where is the object located at 15 seconds? At 15 seconds the object is located 3 meters from the reference point 5 m position 4 m 3 m 2 m 1 m 0 m 0 s 5 s 10 s time 15 s 20 s 25 s

What would a stopwatch read when the object is located 5 meters from the reference point? 5 m position 4 m It would read 3 seconds when the object was 5 meters from the reference point 3 m 2 m 1 m 0 m 0 s 1 s 2 s time 3 s 4 s 5 s


5 m Where is the object located at 3 seconds? position 4 m #1 3 m 2 m 1 m 0 m time 0 s 1 s 2 s 3 s 4 s 5 s

Where is the object located at 3 seconds? 5 m At 3 seconds the object is located 1 m from the reference point position 4 m #1 3 m 2 m 1 m 0 m 0 s 1 s 2 s time 3 s 4 s 5 s

Where is the object located at 40 seconds? 10 m position 8 m #2 6 m 4 m 2 m 0 m 0 s 10 s 20 s time 30 s 40 s 50 s

Where is the object located at 40 seconds? 10 m position 8 m #2 6 m 4 m At 40 seconds the object is located 6 m from the reference point 2 m 0 m 0 s 10 s 20 s time 30 s 40 s 50 s

At what time was the object located 50 meters away? 50 m position 40 m #3 30 m 20 m 10 m 0 m 0 s 0. 5 s 1. 0 s time 1. 5 s 2. 0 s 2. 5 s

At what time was the object located 50 meters away? 50 m position 40 m When the object was 50 meters away, it was 1. 5 s. #3 30 m 20 m 10 m 0 s 0. 5 s 1. 0 s time 1. 5 s 2. 0 s 2. 5 s

At what time was the object located 10 meters away? 50 m position 40 m #4 30 m 20 m 10 m 0 m 0 s 1 s 2 s time 3 s 4 s 5 s

At what time was the object located 10 meters away? 50 m position 40 m #4 30 m 20 m When the object was 10 meters away from the origin, it was 0 s. 10 m 0 m 0 s 1 s 2 s time 3 s 4 s 5 s

At what time was the object located 10 meters away? 25 m position 20 m #5 15 m 10 m 5 m 0 m 0 s 10 s 20 s time 30 s 40 s 50 s

At what time was the object located 10 meters away? 25 m the object was 10 meters away between 0 to 50 s 20 m position #5 15 m 10 m 5 m 0 m 0 s 10 s 20 s time 30 s 40 s 50 s

• Why, on some graphs, did the line not start on the coordinates of 0, 0? 8 m 6 m 4 m 2 m 0 m 0 s 10 s 20 s 30 s 40 s 50 s

Position-Time Graphs • Each type of motion has a characteristic shape on a P-T graph. – Constant speed – Zero speed (at rest) – Accelerating (speeding up) – Decelerating (slowing down)
 Constant speed in positive direction. pos. (m) • Constant speed")
Position-Time Graphs time (s) Constant speed in positive direction. pos. (m) • Constant speed is represented by a straight segment on the P-T graph. time (s) Constant speed in negative direction.
 • Object at rest time (s) A horizontal segment means")
Position-Time Graphs pos. (m) • Object at rest time (s) A horizontal segment means the object is at rest.
 Speeding up in positive direction. pos. (m) • Curved segments")
Position-Time Graphs time (s) Speeding up in positive direction. pos. (m) • Curved segments on the P-T graph mean the object’s speed is changing. time (s) Speeding up in negative direction.
 Traveling in positive direction, but slowing down. pos. (m) •")
Position-Time Graphs time (s) Traveling in positive direction, but slowing down. pos. (m) • Curved segments on the P-T graph mean the object’s speed is changing. time (s) Traveling in negative direction, but slowing down.

Position vs time graphs Of an object at rest

Describe what the object is doing at 1 second, 2 seconds, 3 seconds, etc. ? position 5 m 4 m At 1 seconds the object is located 4 meters from the origin 3 m 2 m 1 m 0 m 0 s 1 s 2 s time 3 s 4 s 5 s

Describe what the object is doing at 1 second, 2 seconds, 3 seconds etc. ? position 5 m From 0 to 5 seconds the object is located 4 meters from the origin 4 m 3 m 2 m 1 m 0 m 0 s 1 s 2 s time 3 s 4 s 5 s

• If an object is staying in the same position for a time interval than its… • • at rest. stopped. not moving. still. • Represented by a horizontal line on a position vs time graph

 When and where is the object at rest? position 10 m 8 m")
1) When and where is the object at rest? position 10 m 8 m 6 m 4 m 2 m 0 m 0 s 1 s 2 s time 3 s 4 s 5 s
 When and where is the object at rest? position 10 m From 2")
1) When and where is the object at rest? position 10 m From 2 to 4 seconds the object is located 6 meters from the origin 8 m 6 m 4 m 2 m 0 m 0 s 1 s 2 s time 3 s 4 s 5 s
 When and where is the object not moving? position 5 m 4 m")
2) When and where is the object not moving? position 5 m 4 m 3 m 2 m 1 m 0 m 0 s 2 s 4 s time 6 s 8 s 10 s
 When and where is the object still? +3 m position +2 m +1")
3) When and where is the object still? +3 m position +2 m +1 m 0 m -1 m -2 m 0 s 5 s 10 s time 15 s 20 s 25 s
 When and where is the object still? +3 m From 15 to 25")
3) When and where is the object still? +3 m From 15 to 25 seconds the object is located -1 meters from the origin position +2 m +1 m 0 m -1 m -2 m 0 s 5 s 10 s time 15 s 20 s 25 s

Position-Time Graphs • The following P-T graph corresponds to an object moving back and forth along a straight path. Can you describe its movement based on the graph? position (m) N S time (s)

• As t becomes smaller, the average velocity becomes closer and closer to the instantaneous velocity at that point

Instantaneous Velocity • The velocity at that exact moment in time • To determine we would draw a straight line that is tangent to the curve at that point, the slope of that tangent then, is the instantaneous velocity

2 -2 ACCELERATION

2 -2 Learning Targets • Define Acceleration • Interpret velocity-time graphs • Apply kinematic equations to calculate distance, time, or velocity under constant acceleration
 ΔT ( tf-ti) Velocity units = m/s Time")
Average Acceleration A= ΔV = (vf-vi) ΔT ( tf-ti) Velocity units = m/s Time units= s Acceleration units= m/s 2 • P. 47

Average Acceleration • A ratio between the change in velocity and the change in time • If the number is large, then the change is great • Acceleration has magnitude and direction • SI units = m/s 2

Velocity and Acceleration p. 49 Vi a Motion + + Speeding up - - Speeding up + - Slowing down - + Slowing down - or+ 0 Constant velocity 0 - or + Speeding up from rest 0 0 Remaining at rest

Velocity can be interpreted graphically • Velocity can be found from position-time graph • Slope of the line x/ t (position-time graph) is equal to the average velocity

Position-Time Graphs • The slope of a P-T graph is equal to the object’s velocity in that segment. slope = 50 position (m) change in y 40 30 slope = change in x (30 m – 10 m) 20 10 slope = 10 20 time (s) 30 (30 s – 0 s) (20 m) (30 s) 40 slope = 0. 67 m/s

Tangent Lines x t On a position vs. time graph: SLOPE VELOCITY SLOPE SPEED Positive Steep Fast Negative Gentle Slow Zero Flat Zero
 graph shows an object’s velocity as a")
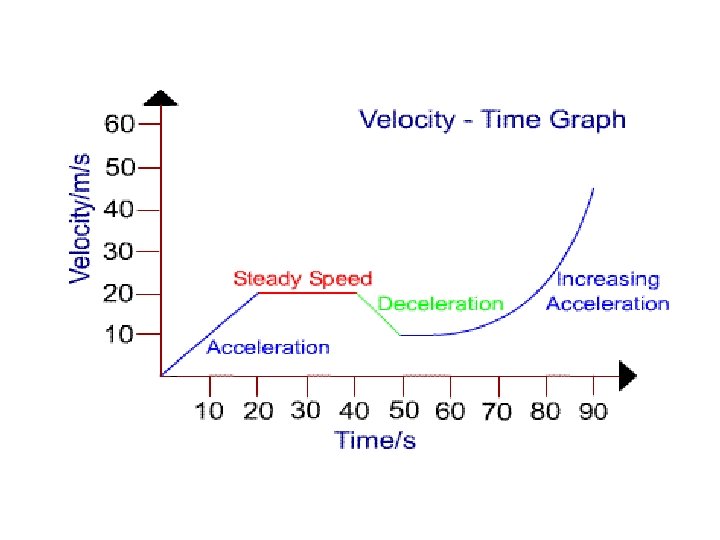
Velocity VS. Time Graph A velocity-time (V-T) graph shows an object’s velocity as a function of time The slope of the velocity versus time graph is the acceleration. This only works if the acceleration is Constant! The area under the velocity versus time graph is the displacement.

P-T graph to Velocity Time Graphs • A tool that can be used to describe motion with either constant or changing velocity • A constant velocity from a position time graph, becomes a horizontal line on the velocity time graph

Velocity-Time Graphs • A horizontal line on the V-T graph means constant velocity. (No acceleration) velocity (m/s) N S time (s) Object is moving at a constant velocity North.

Velocity-Time Graphs • A horizontal line on the V-T graph means constant velocity. (No acceleration) velocity (m/s) N S time (s) Object is moving at a constant velocity South.
")
Velocity-Time Graphs • If an object isn’t moving, its velocity is zero. velocity (m/s) N S Object is at rest time (s)

Velocity-Time Graphs – Positive slope = positive constant acceleration • Not necessarily speeding up! – If v is positive also, object is speeding up. – If v is negative, object is slowing down.
 S time (s) Positive")
Velocity-Time Graphs • V-T graph has positive slope. velocity (m/s) S time (s) Positive velocity and positive acceleration: object is speeding up! velocity (m/s) N N S time (s) Negative velocity and positive acceleration: object is slowing down.

Velocity-Time Graphs – Negative slope = negative constant acceleration. • Not necessarily slowing down! – If v is positive, the object is slowing down. – If v is negative also, the object is speeding up.
 S time (s) Positive")
Velocity-Time Graphs • V-T graph has negative slope. velocity (m/s) S time (s) Positive velocity and negative acceleration: object is slowing down, velocity (m/s) N N S time (s) Negative velocity and negative acceleration: object is speeding up! (in negative direction)

Explain how someone can have position, but negative velocity. • Driving west • https: //www. physicsclassroom. com/Physics. Interactives/1 -D-Kinematics/Name-That. Motion/Name-That-Motion-Interactive • Ticker tape

Motion with constant Acceleration • As velocity increases the object travels a greater distance during a set time interval • Because the acceleration is constant the velocity increases by the same amount during the time interval • Because the velocity increases by the same amount in each interval the displacement for each time interval increases by the same amount

• If acceleration is constant, then Vavg= Vi + Vf and Vavg = Δx 2 Δt then Vi + Vf = Δx 2 Δt Then Δx= ½ (Vi + Vf) Δt Displacement = ½ (initial v + final v) (time interval)

• Final velocity depends on initial velocity, acceleration and time • If we want to calculate displacement but do not know Vf how to we do it? • If we know Vi, Aavg, Δt then we can calculate Vf and use this to calculate Δx a= Δ V =Vf - Vi = Vf - Vi Δt tf -ti Δt aΔt = Vf-Vi Velocity with constant acceleration • Vf= aΔt + Vi

• If we want to know displacement with constant acceleration and we are not given Vf the n we can substitute the earlier equation into the equation for Δx Δx= ½ (Vi + Vf) Δt Δx= ½ (Vi +aΔt + Vi) Δt Δx= ½ [2 Vi Δt +a (Δt)2] Δx= Vi Δt +½a (Δt)2 Displacement with constant acceleration

• Time can be found from displacement and velocities • Why: to find Vf of an accelerated object without knowing how long it has been accelerating • How: start with the equation for displacement Δx= ½ (Vi + Vf) Δt Solve for Δt Δt = 2Δx V i + Vf •

• Substitute the earlier equation for Δt into the equation for Vf Vf= Vi + aΔt Vf= Vi + a 2Δx V i + Vf This is not helpful, since Vf is on both sides of the equation

• Solve for Vf Vf= Vi + a 2Δx V i + Vf Vf-Vi = a (2Δx) Vi + Vf (Vf-Vi )(Vf+Vi )= a (2Δx) (Vf 2 - Vi 2) = a (2Δx) Vf 2= Vi 2 + 2 aΔx Final velocity after any displacement
 Δt Form without Vi")
p. 56 Form with Vi Δx= ½ (Vi + Vf) Δt Form without Vi Δx= ½ ( Vf) Δt Vf= aΔt + Vi Vf= aΔt Δx= Vi Δt +½a (Δt)2 Δx= ½a (Δt)2 Vf 2= Vi 2 + 2 aΔx Vf 2= 2 aΔx

2 -3 FALLING OBJECTS

2 -3 Learning Targets • Relate the motion of a free falling body to constant acceleration • Calculate displacement, time, and velocity during the motion of a falling object

• Freefall- motion of an object falling with a constant acceleration without air resistance • g • a=-g= -9. 81 m/s 2

Throw ball upward • As soon as the ball is released the acceleration is -9. 81 m/s 2 • Acceleration is constant at any point • Velocity is 0 m/s at the peak

• In absence of air resistance all objects dropped will fall with the same constant acceleration

Velocity Anything goes up + Anything falling - Accelerat Results ion Slows down Speeds up

V-T graph thrown object
 Δt Form without Vi Δy= ½")
Form with Vi Δy= ½ (Vi + Vf) Δt Form without Vi Δy= ½ ( Vf) Δt Vf= aΔt + Vi Vf= aΔt Δy= Vi Δt +½a (Δt)2 Vf 2= Vi 2 + 2 aΔy Δy= ½a (Δt)2 Vf 2= 2 aΔy

• The time for the Demon Drop to freely fall is 1. 5 s. What is the velocity at the end of this time? How far does it fall? • Vf= aΔt + Vi Vf = (-9. 81 m/s 2) (1. 5 s) + 0 m/s Vf= -15 m/s Δy= Vi Δt +½a (Δt)2 Δy= (0 m/s)(1. 5 s) +½(-9. 81 m/s 2) (1. 5)2 • Δy= 11 m

• A tennis ball is thrown straight up with an initial velocity of + 22. 5 m/s. It is caught at the same distance above ground from which it was thrown. How high does the ball rise? • Vf 2= Vi 2 + 2 aΔy • 0 m/s= (22. 5 m/s)2 + 2(-9. 81 m/s 2)Δy • Final velocity is 0 because ball is at top of arch in flight • Δy = + 25. 8 m

• How long does the ball remain in the air if not caught and allowed to fall to the ground? • Vf= aΔt + Vi • 0 m/s = (-9. 81 m/s 2) t + 22. 5 m/s • t= 2. 30 s • This is for half the trip so total time is 4. 60 s.

Chapter 2 Review • P. 73 • #1, 4 -8, 10, 12 -14, 16, 18, 20, 21, 23, 24, 26, 30, 31
- Slides: 97