Learning Tableau Chapter 3 Advanced Visualizations Topics Comparing

Learning Tableau: Chapter 3 Advanced Visualizations

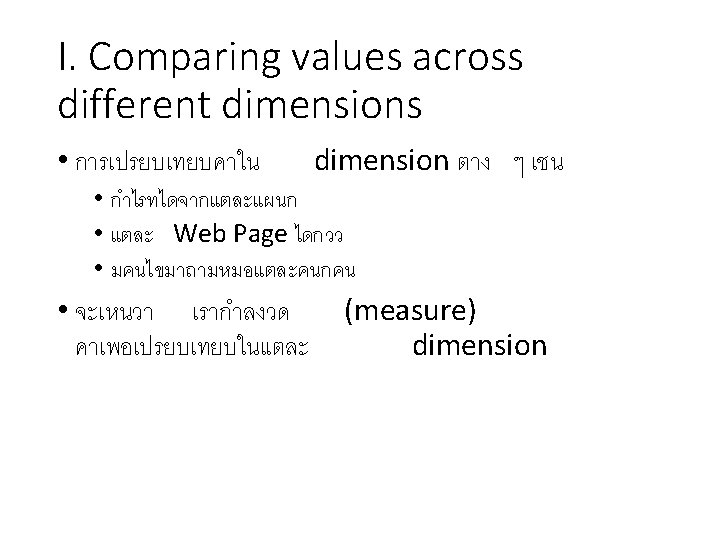
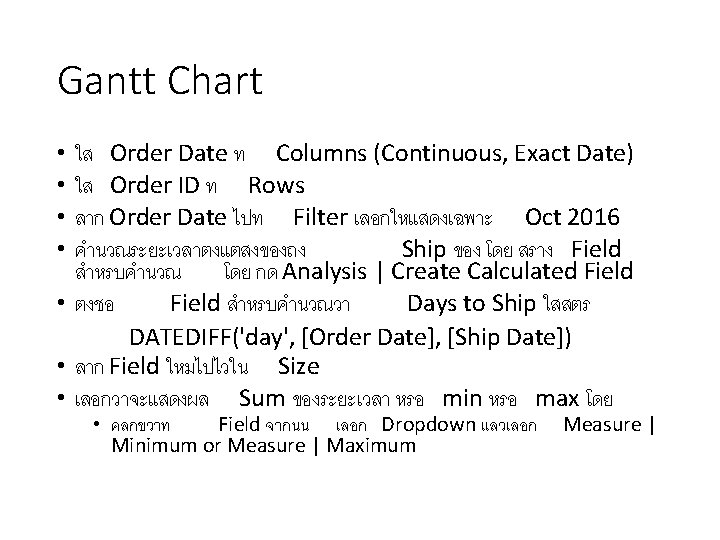
Topics • Comparing values across different dimensions • Visualizing dates and times • Relating parts of the data to the whole • Visualizing distributions • Visualizing multiple axes to compare different measures
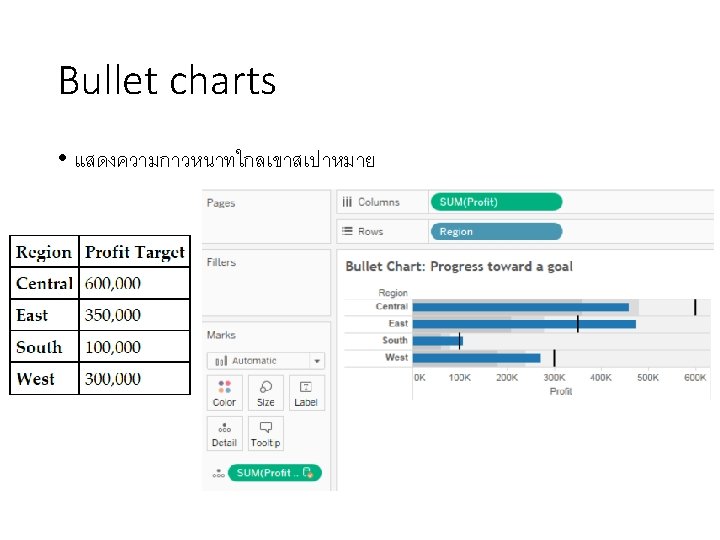

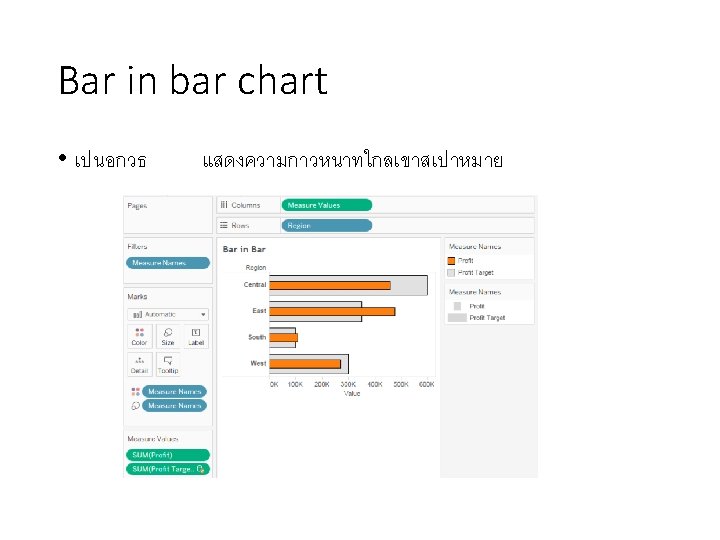
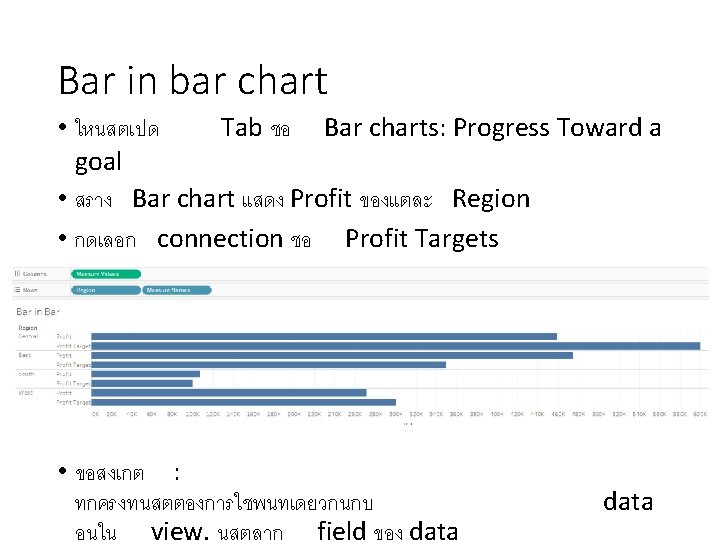
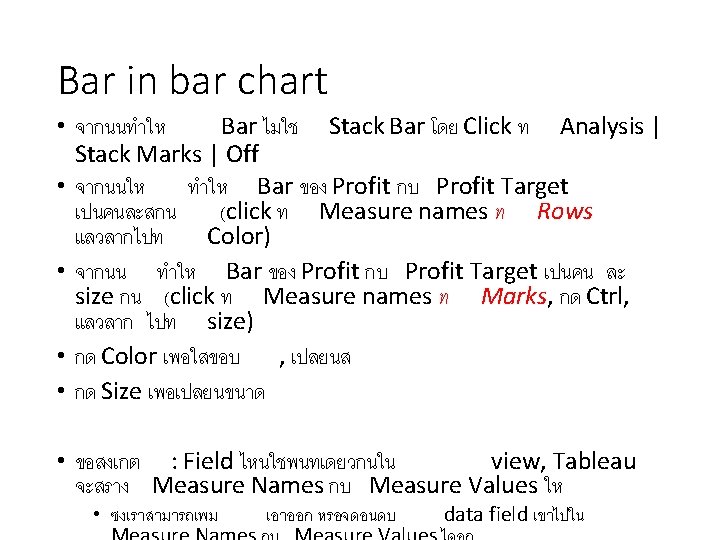
Bullet charts • ใหนสตเปด Tab ชอ Bar charts: Progress Toward a goal • สราง Bar chart แสดง Profit ของแตละ Region • กดเลอก connection ชอ Profit Targets • กดเลอก data field ชอ Profit Target • กดเลอก Show Me • กดเลอกแสดง Bullet graphs • Notice: field ชอ Region ถกใชใน data blend เพอเชอม 2 data source ไวดวยกน

Create Group & Highlight • สราง Group ดกด Ctrl เลอก , Click ขวาสราง กลม • Highlight Group ดโยนมนเขาไปใน Color • ใส Label โดย Click ทแตละ bar และ กด Mark label | Always show • Format Label โดย ไปกด dropdown ท Sales ใน Column shelf, จากนน เลอก Format
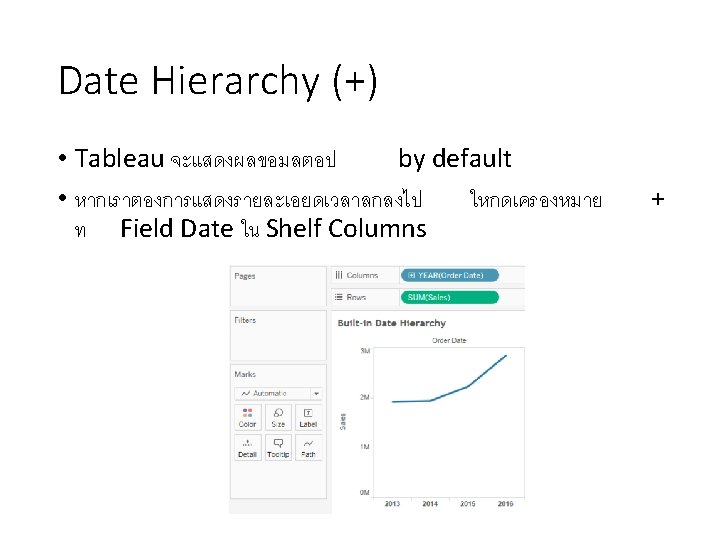

Date Hierarchy • Dates : Year -> Quarter -> Month -> Day • Times : Hour -> Minute -> Second November X, 19 YY ถกตความแค 19 YY November 8, 1980 2: 01 am ถกตความตางจาก pm November, November 8, 1980 3: 08
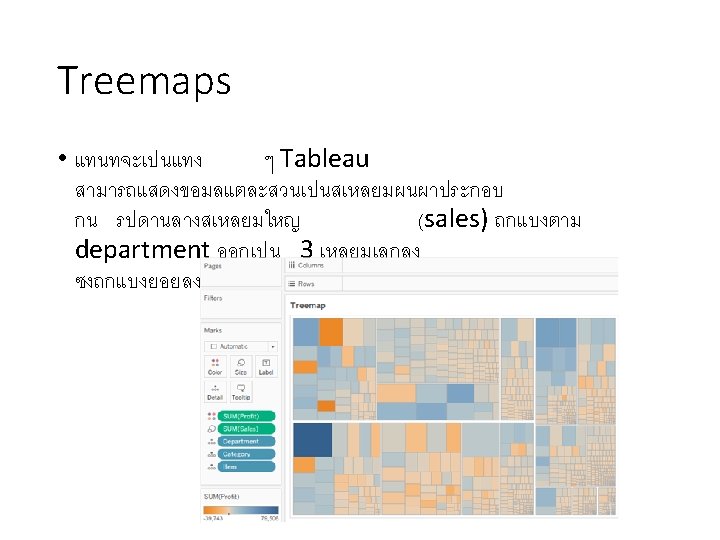

Pie charts

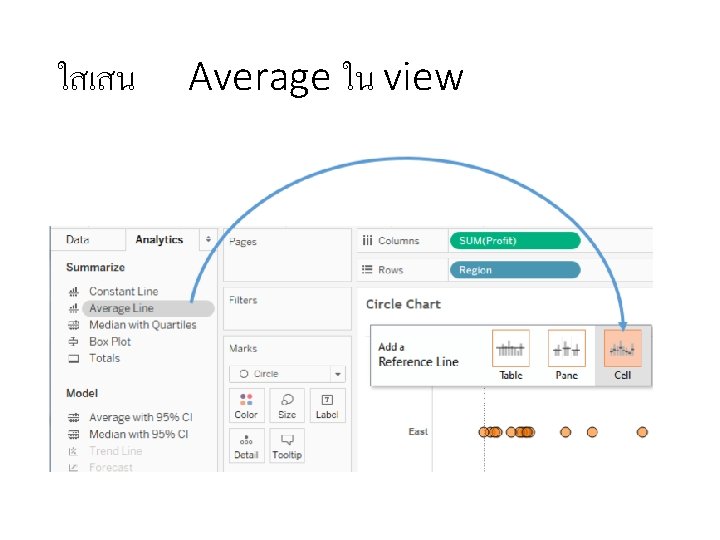
Circle charts

ทำใหโปรงเพอใหมองเหนงายขน • click on the Color shelf and add some transparency and a border to each circle.

Box and Whisker Plots • use the Analytics tab on the left sidebar and drag Box Plot to the view.

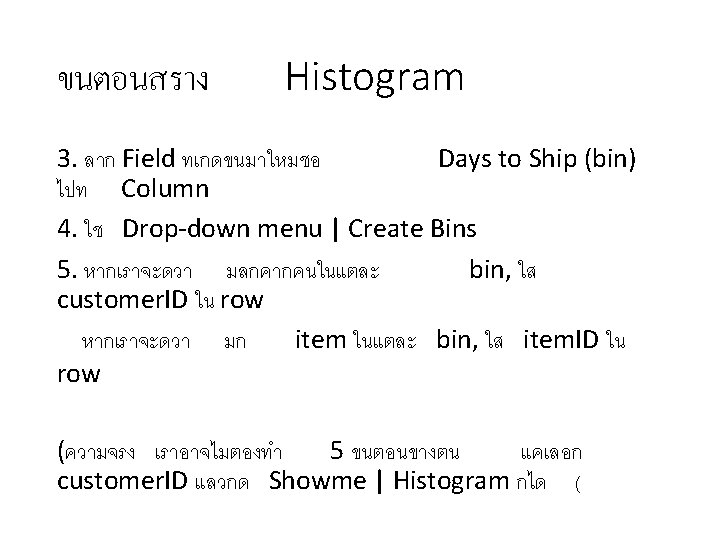
Histograms


Scatterplot

Dual axis use the drop-down menu on the second and select Dual Axis.

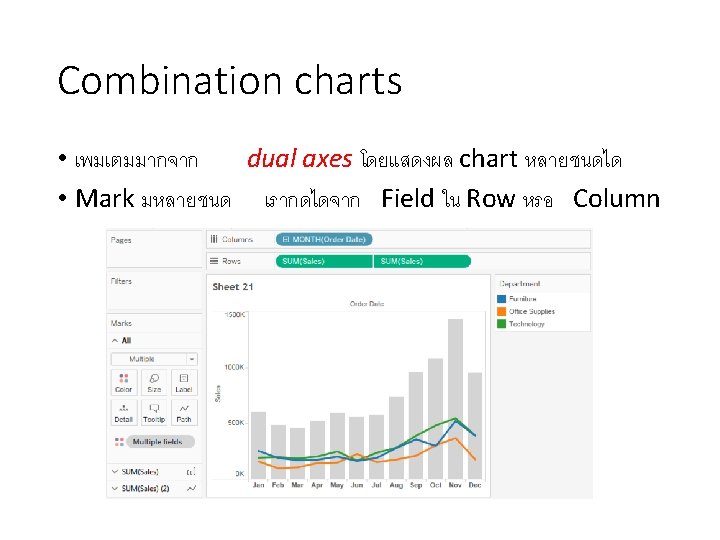
Combination charts
- Slides: 40