Learning Outcomes 1 You will be able to

Learning Outcomes: 1. You will be able to understand describe why and how maps are drawn to a particular scale. 2. You will be able to identify a 4 figure grid reference on an ordinance survey map 3. You will be able to identify a 6 figure grid reference on an ordinance survey map

Ordinance Survey Maps

Scale • All maps are drawn to a particular Scale. • Scale is the ratio between a distance shown on a map and the actual distance on the ground. • For example, 2 cm on a map may represent 1 km in reality.


Where can I find the Scale of my Map? • Every map must have a scale. On the maps we use the scale is shown on the back in 3 ways. • 1. Representative Fraction – The scale is written as a ratio such as 1: 50, 000. • 2. Linear Scale – The scale is shown on a line that is divided into km and miles. • 3. Statement of scale – The scale is stated, such as 2 centimetres to 1 kilometre.

Where can I find the Scale of my Map?
 • The maps we use most often")
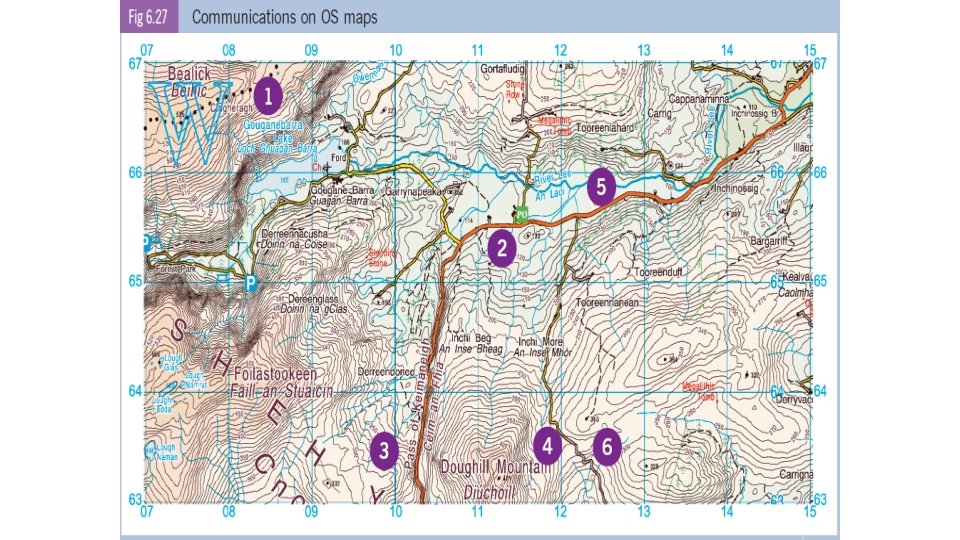
The OS Discovery Series (1: 50, 000) • The maps we use most often in class are drawn to a scale of 1: 50, 000. (1 cm represents 50, 000 centimetres/500 metres). • On these maps, 2 cm represents 1 km. • Each little square box on your map represents 1 km sq.


The National Grid

4 Figure Grid References • To give a 4 figure grid reference complete the following 3 steps. 1. Firstly, write the Letter from your map. 2. Write the number of the line going from left to right on your map. 3. Write the number of the line going from top to bottom on your map. Your answer should look like this G 54 19

4 Figure Grid References

6 Figure Grid References

6 Figure Grid References
- Slides: 14