
Learning objectives Get out your map and spirals
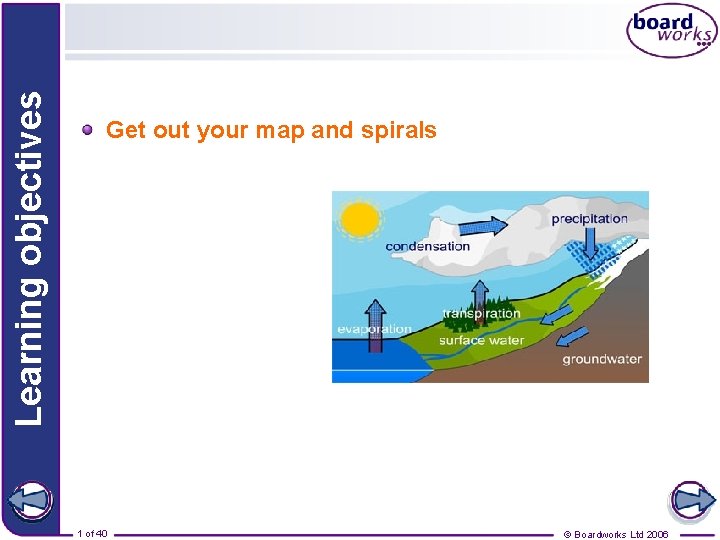
Learning objectives Get out your map and spirals 1 of 40 © Boardworks Ltd 2006
Introduction to Weather and Climate These icons indicate that teacher’s notes or useful web addresses are available in the Notes Page. This icon indicates the slide contains activities created in Flash. These activities are not editable. For more detailed instructions, see the Getting Started presentation. 2 of 33 40 © Boardworks Ltd 2006
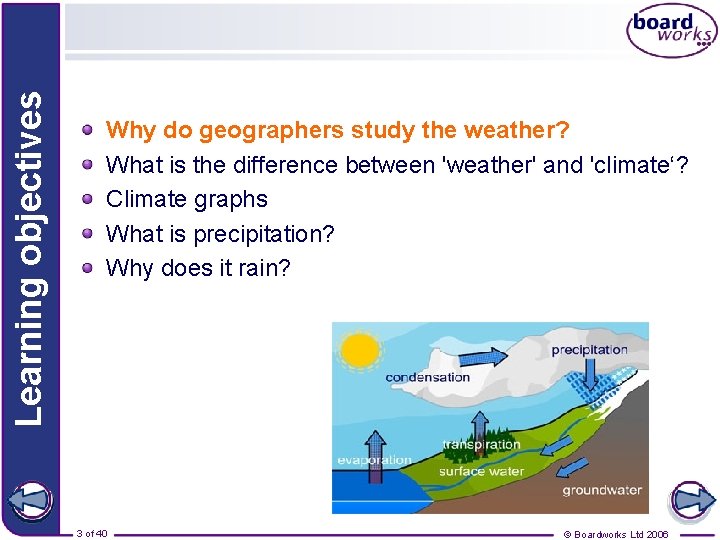
Learning objectives Why do geographers study the weather? What is the difference between 'weather' and 'climate‘? Climate graphs What is precipitation? Why does it rain? 3 of 40 © Boardworks Ltd 2006
Why do geographers study the weather? The weather has an impact on many of the things that we do! Can you explain how the weather affects these people? 4 of 40 © Boardworks Ltd 2006
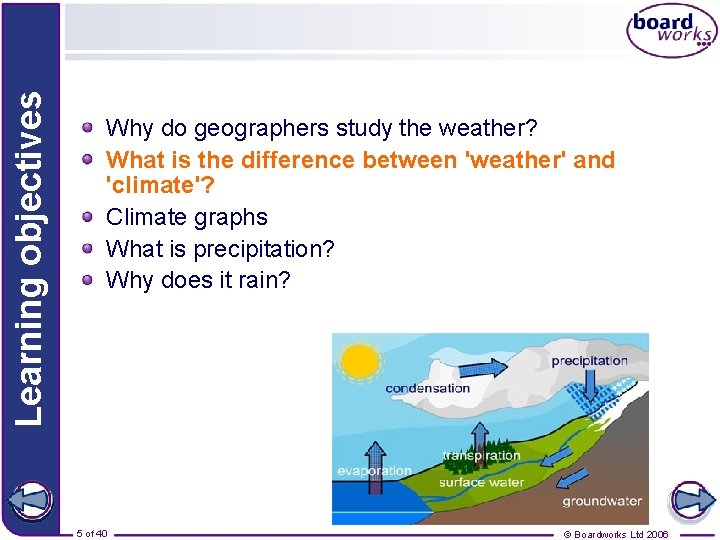
Learning objectives Why do geographers study the weather? What is the difference between 'weather' and 'climate'? Climate graphs What is precipitation? Why does it rain? 5 of 40 © Boardworks Ltd 2006
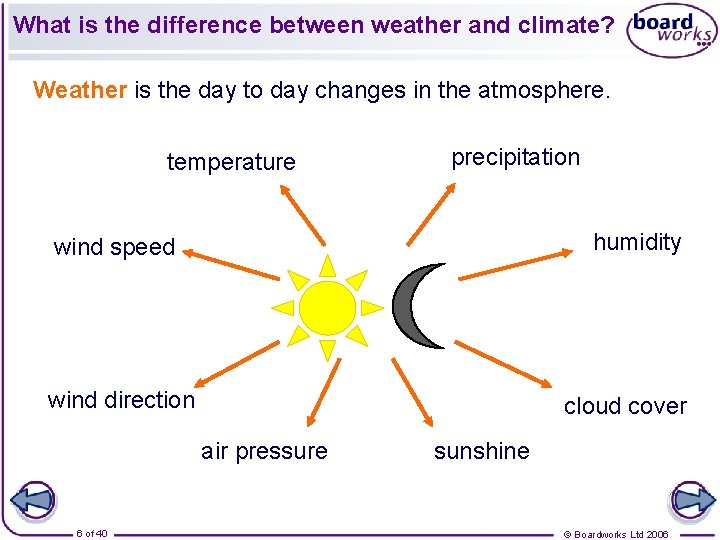
What is the difference between weather and climate? Weather is the day to day changes in the atmosphere. temperature precipitation humidity wind speed wind direction cloud cover air pressure 6 of 40 sunshine © Boardworks Ltd 2006
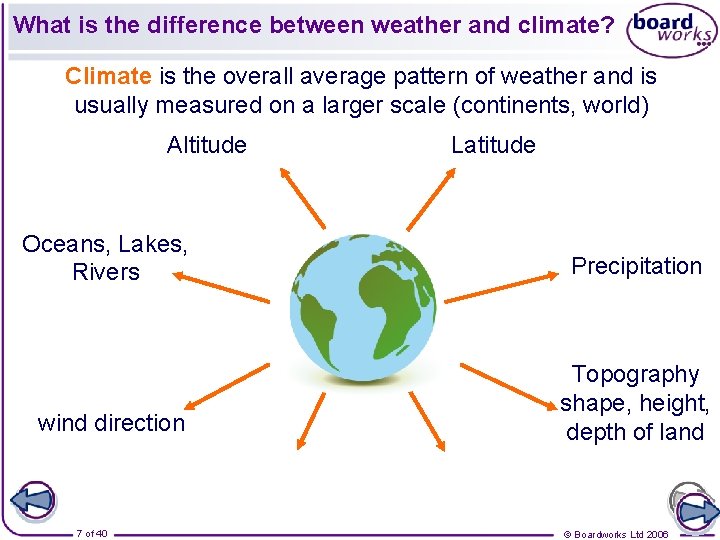
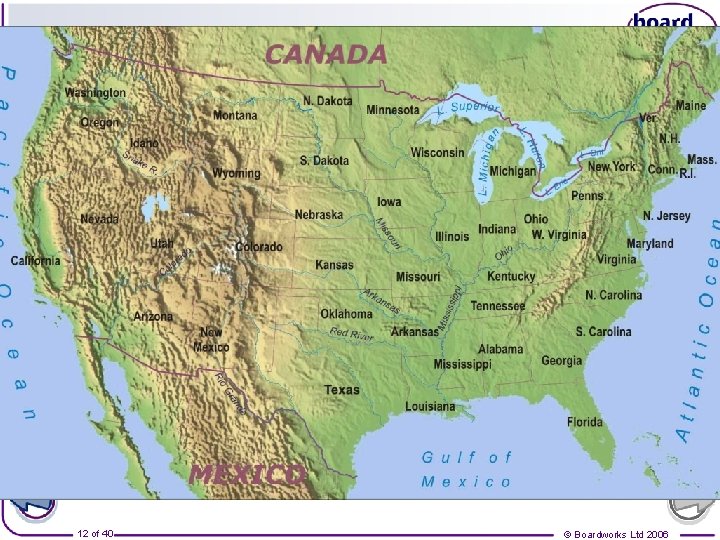
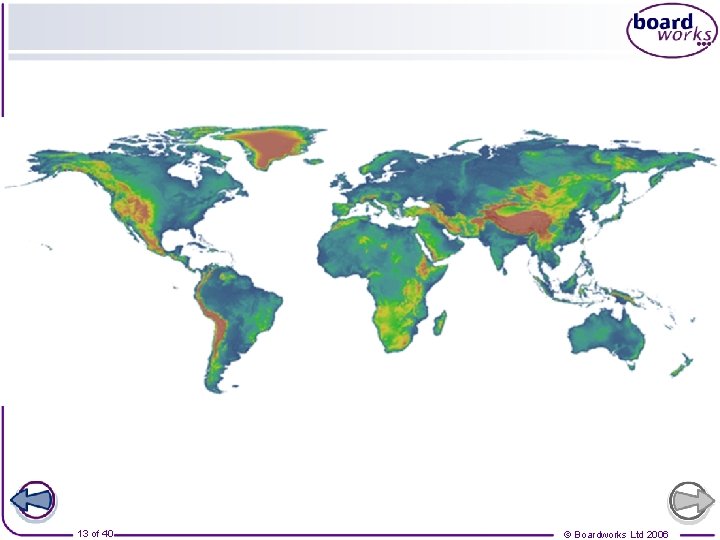
What is the difference between weather and climate? Climate is the overall average pattern of weather and is usually measured on a larger scale (continents, world) Altitude Latitude Oceans, Lakes, Rivers Precipitation wind direction Topography shape, height, depth of land 7 of 40 © Boardworks Ltd 2006
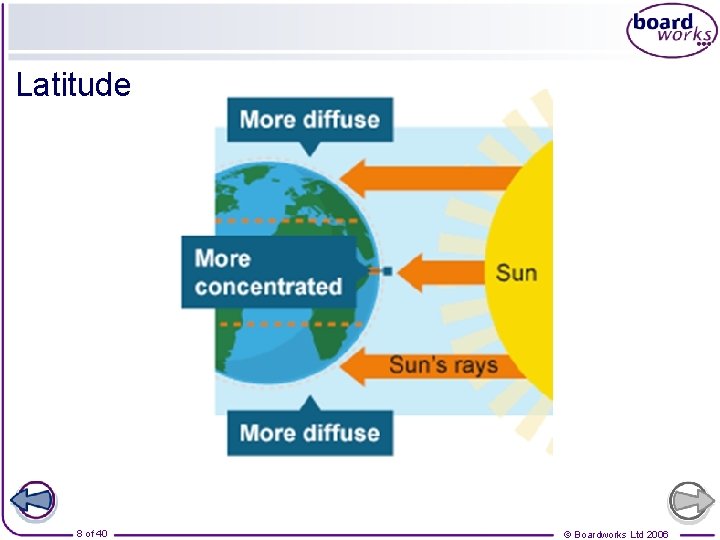
Latitude 8 of 40 © Boardworks Ltd 2006
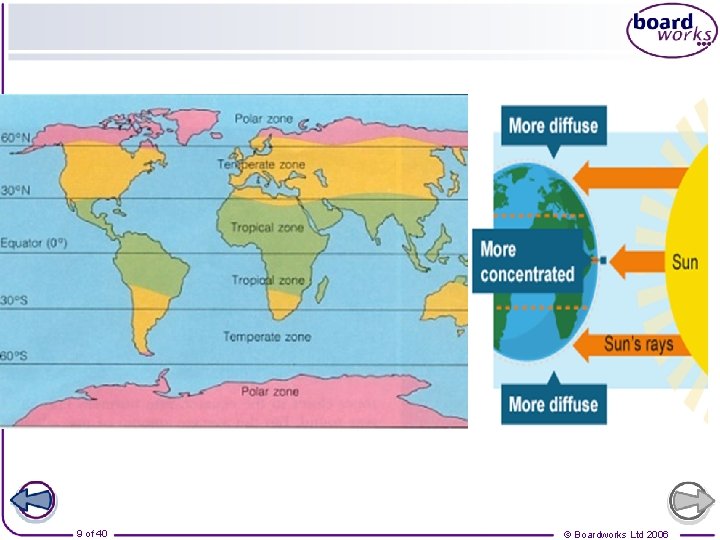
9 of 40 © Boardworks Ltd 2006
What is the difference between weather and climate? Climate is the overall pattern of weather, usually based on an average over 30 years. Click on the buttons to find out about these types of climate. 10 of 40 © Boardworks Ltd 2006
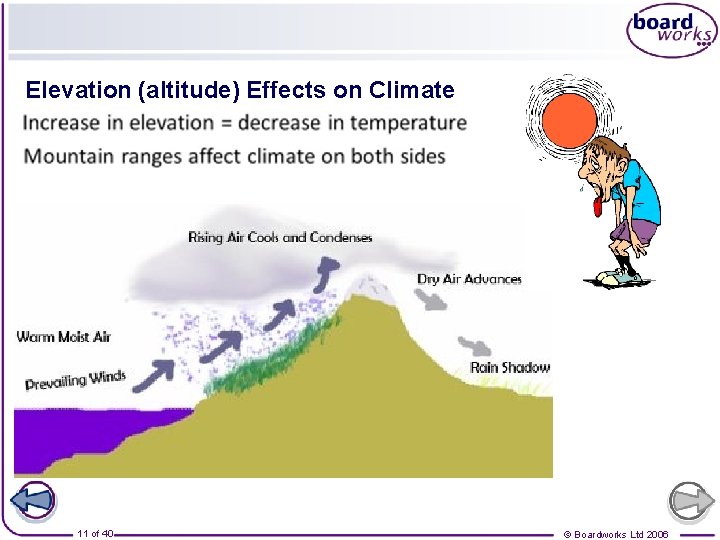
Elevation (altitude) Effects on Climate 11 of 40 © Boardworks Ltd 2006
12 of 40 © Boardworks Ltd 2006
13 of 40 © Boardworks Ltd 2006
Learning objectives Why do geographers study the weather? What is the difference between 'weather' and 'climate'? Climate graphs What is precipitation? Why does it rain? 14 of 40 © Boardworks Ltd 2006

Temperature and Rainfall effects Climate graphs are a way of showing how temperature and precipitation vary throughout the year for a particular place. 15 of 40 © Boardworks Ltd 2006
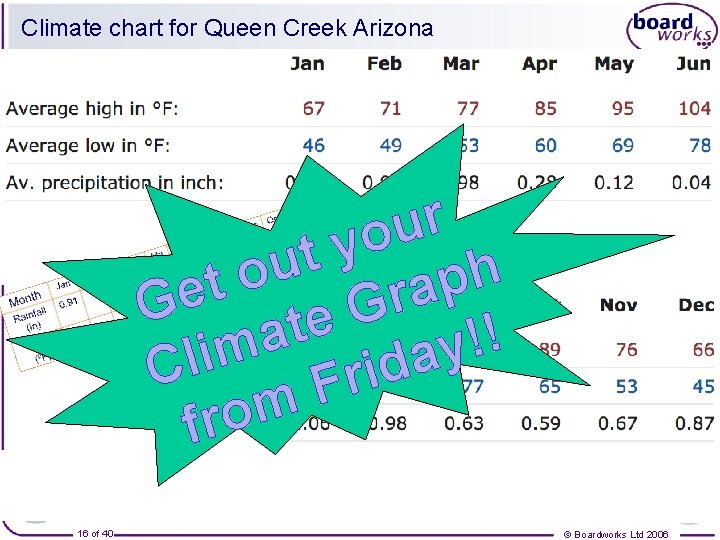
Climate chart for Queen Creek Arizona r u o y t u h o p t a r Ge G e t ! a ! y m i a l d C i r F m o fr 16 of 40 © Boardworks Ltd 2006
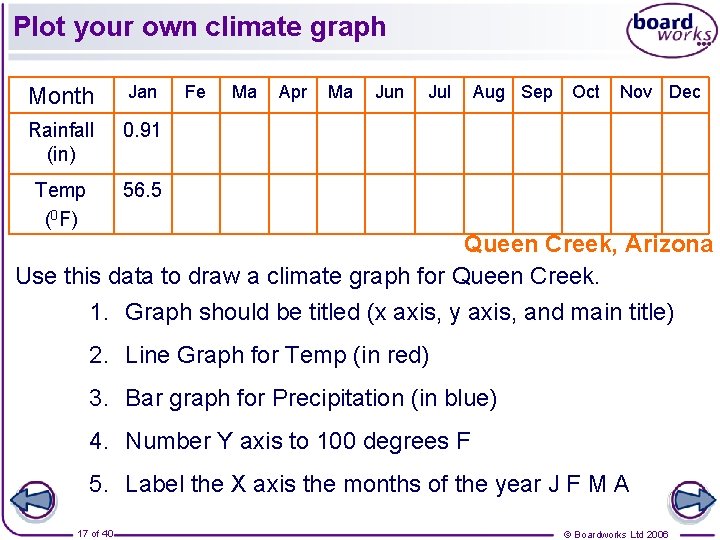
Plot your own climate graph Month Jan Rainfall (in) 0. 91 Temp (0 F) 56. 5 Fe Ma Apr Ma Jun Jul Aug Sep Oct Nov Dec Queen Creek, Arizona Use this data to draw a climate graph for Queen Creek. 1. Graph should be titled (x axis, y axis, and main title) 2. Line Graph for Temp (in red) 3. Bar graph for Precipitation (in blue) 4. Number Y axis to 100 degrees F 5. Label the X axis the months of the year J F M A 17 of 40 © Boardworks Ltd 2006
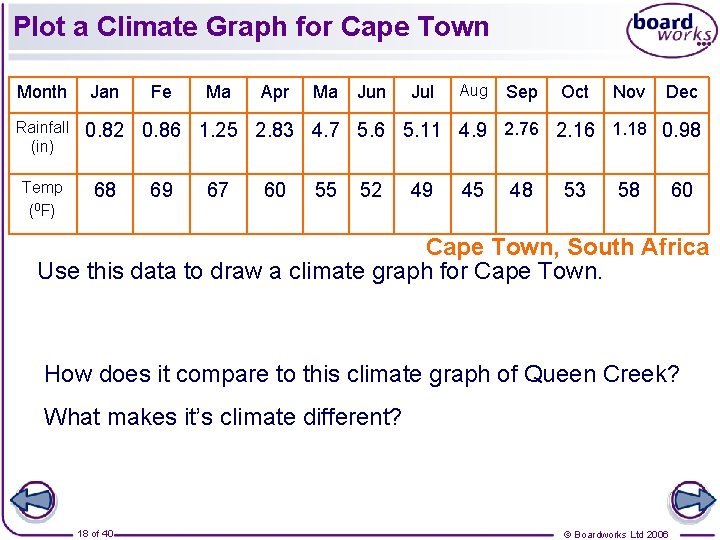
Plot a Climate Graph for Cape Town Month Rainfall (in) Temp (0 F) Jan Fe Ma Apr Ma Jun Jul Aug Sep Oct Nov Dec 0. 82 0. 86 1. 25 2. 83 4. 7 5. 6 5. 11 4. 9 2. 76 2. 16 1. 18 0. 98 68 69 67 60 55 52 49 45 48 53 58 60 Cape Town, South Africa Use this data to draw a climate graph for Cape Town. How does it compare to this climate graph of Queen Creek? What makes it’s climate different? 18 of 40 © Boardworks Ltd 2006
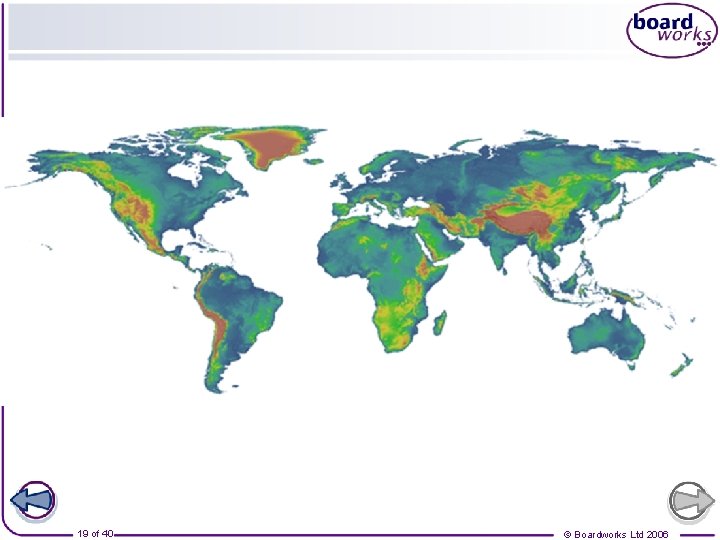
19 of 40 © Boardworks Ltd 2006
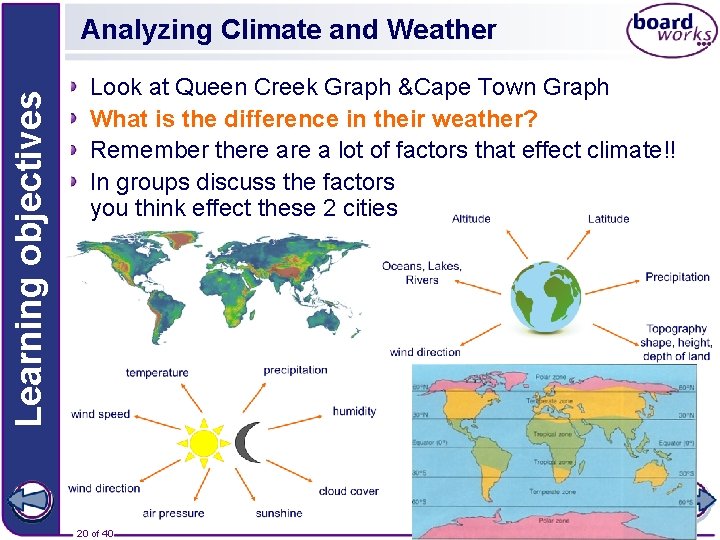
Learning objectives Analyzing Climate and Weather Look at Queen Creek Graph &Cape Town Graph What is the difference in their weather? Remember there a lot of factors that effect climate!! In groups discuss the factors you think effect these 2 cities 20 of 40 © Boardworks Ltd 2006
Learning objectives Why do geographers study the weather? What is the difference between 'weather' and 'climate‘? Climate graphs What is precipitation? Why does it rain? 21 of 40 © Boardworks Ltd 2006
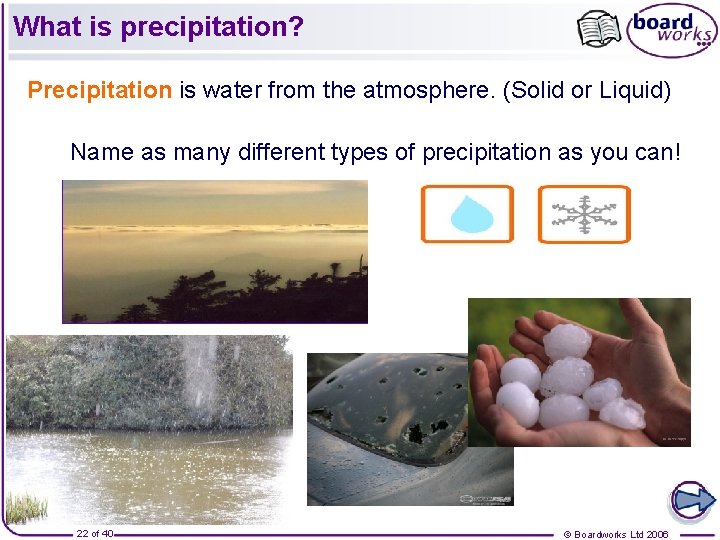
What is precipitation? Precipitation is water from the atmosphere. (Solid or Liquid) Name as many different types of precipitation as you can! 22 of 40 © Boardworks Ltd 2006
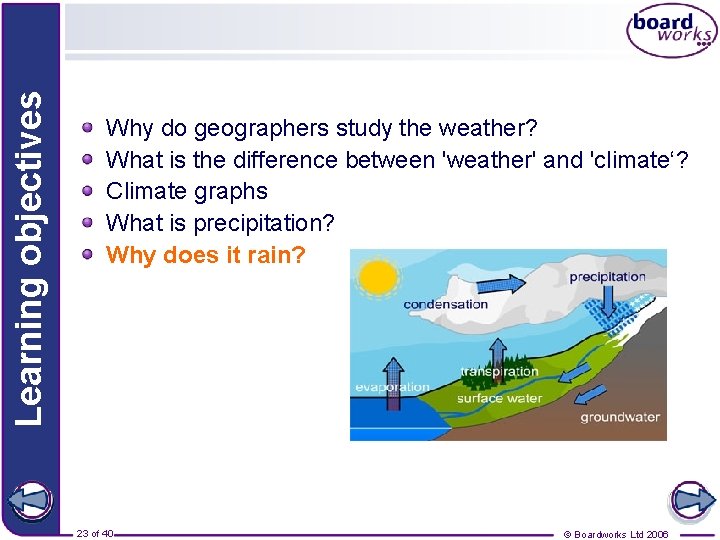
Learning objectives Why do geographers study the weather? What is the difference between 'weather' and 'climate‘? Climate graphs What is precipitation? Why does it rain? 23 of 40 © Boardworks Ltd 2006
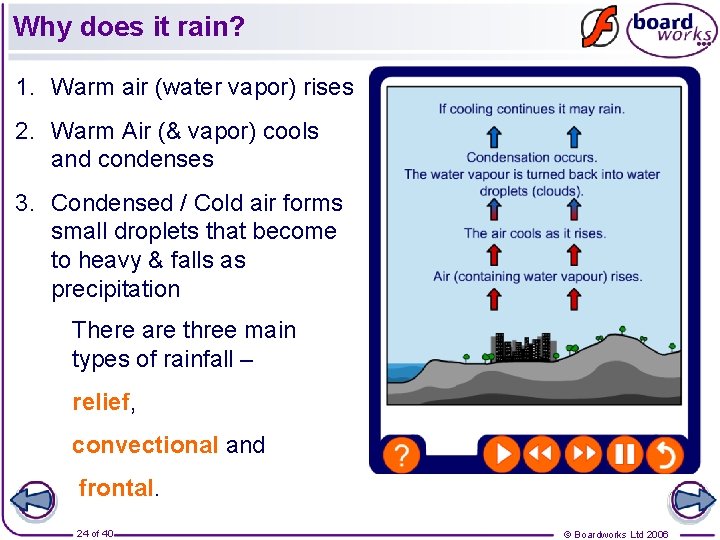
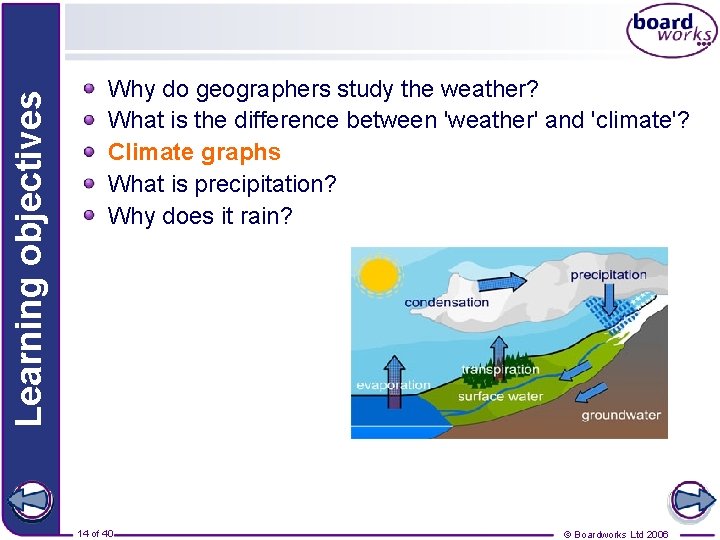
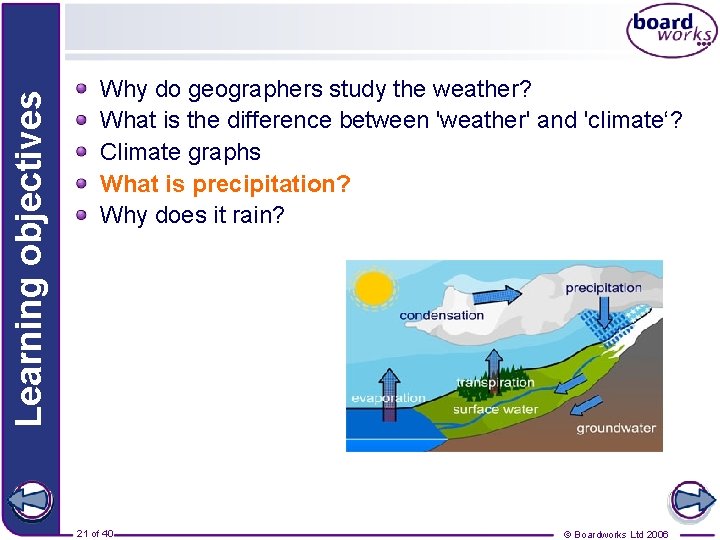
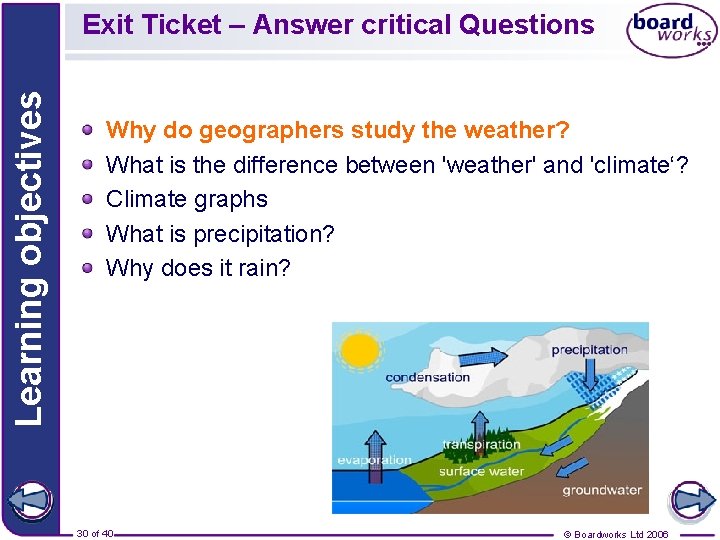
Why does it rain? 1. Warm air (water vapor) rises 2. Warm Air (& vapor) cools and condenses 3. Condensed / Cold air forms small droplets that become to heavy & falls as precipitation There are three main types of rainfall – relief, convectional and frontal. 24 of 40 © Boardworks Ltd 2006
Relief rain 25 of 40 © Boardworks Ltd 2006
Relief rain 26 of 40 © Boardworks Ltd 2006
Convectional rain 27 of 40 © Boardworks Ltd 2006
Convectional rain 28 of 40 © Boardworks Ltd 2006
Frontal rain 29 of 40 © Boardworks Ltd 2006
Learning objectives Exit Ticket – Answer critical Questions Why do geographers study the weather? What is the difference between 'weather' and 'climate‘? Climate graphs What is precipitation? Why does it rain? 30 of 40 © Boardworks Ltd 2006
Key Ideas Geographers study the weather because weather conditions have an impact on people’s daily lives and their activities. Weather is the day to day changes in the atmosphere. Climate is the overall average pattern of weather Precipitation is water from the atmosphere. It can be in solid or liquid form. It rains because when warm air rise, with water vapour, it expands, condenses, & cools. The cooling forms clouds & mini water droplets that eventually become to heavy &fall back to the earth. There are three main types of rainfall – relief, convectional and frontal. In all three situations, rainfall occurs because air is forced to rise. 31 of 40 © Boardworks Ltd 2006
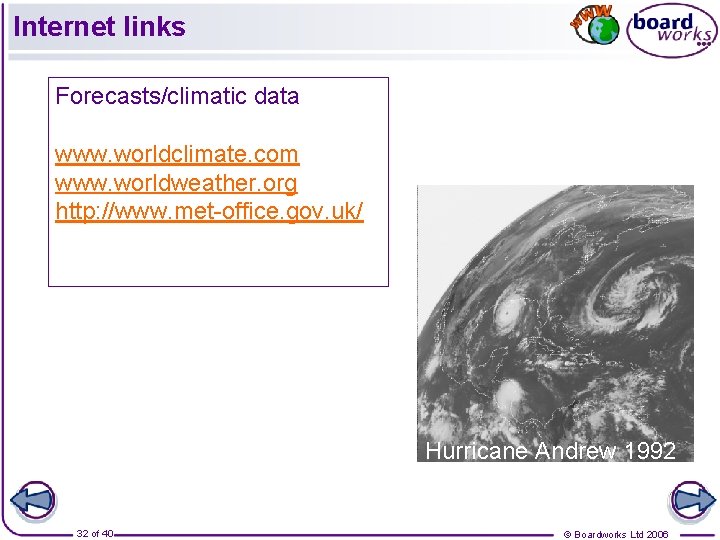
Internet links Forecasts/climatic data www. worldclimate. com www. worldweather. org http: //www. met-office. gov. uk/ Hurricane Andrew 1992 32 of 40 © Boardworks Ltd 2006
Weather and Climate Bingo! 33 of 40 © Boardworks Ltd 2006
Key Ideas Geographers study the weather because it has an impact on people’s daily lives and the activities that they do. Weather is the day to day changes in the atmosphere. Climate is the overall pattern of weather, usually based on an average over 30 years. The British Isles has a temperate climate. This means that it is not too hot, not too cold, not too dry and not too wet! Water is neither created nor destroyed. It is cycled round over again. This recycling of water is called the water cycle. Precipitation is water from the atmosphere. It can be in solid or liquid form. There are three main types of rainfall – relief, convectional and frontal. In all three situations, rainfall occurs because air is forced to rise. 34 of 40 © Boardworks Ltd 2006
- Slides: 34