Learning Intention To understand what a biome is

Learning Intention • To understand what a biome is • To be able to give examples of biomes

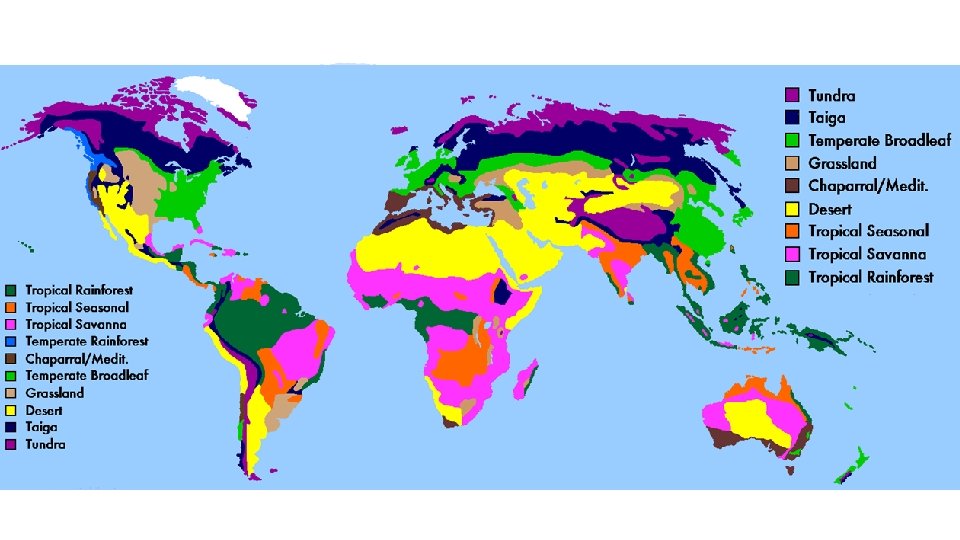
What is a biome? • The world is divided into biomes • Each biome determined by the CLIMATE and the PLANTS and ANIMALS living and growing there.

THINK Why is the climate important for determining the animals and plants?

Can these survive in the Sahara desert?
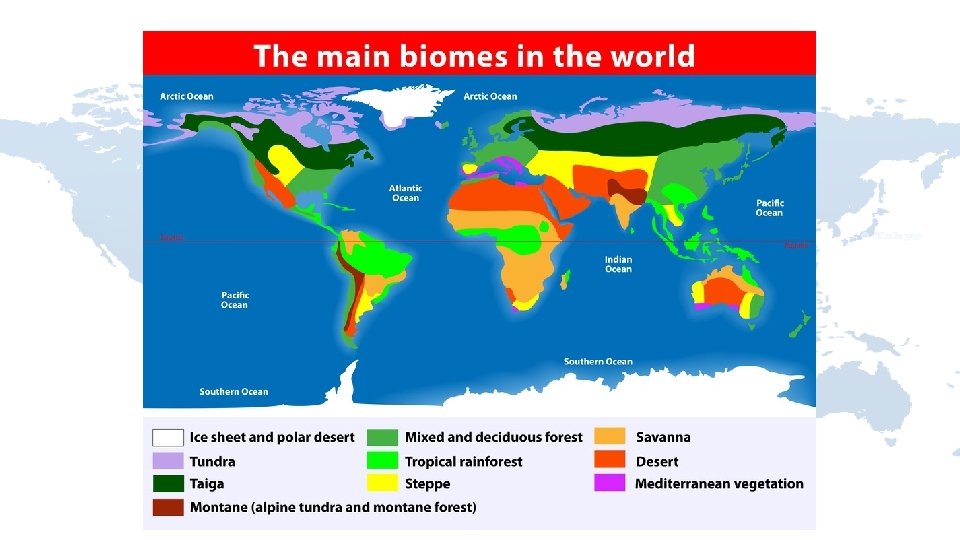

Task Use the table on page 151 and make notes in your jotters about the 4 biomes which have been given

Task Use the information sheets provided and make a poster which has a drawings and descriptions of your chosen biome on.

Learning Intention • To learn about ecosystems, habitats, populations, species • To discuss biotic and abiotic factors

Ecological Vocabulary ECOSYSTEM A natural biological unit composed of a collection of both living and nonliving components. Eg: An ocean

Ecological Vocabulary Biodiversity The number and abundance of different species.

Ecological Vocabulary Species A group of organisms that produce fertile young when they reproduce
 living in an ecosystem")
Ecological Vocabulary Community All the animals and plants (different species) living in an ecosystem

Ecological Vocabulary Habitat The place where organisms live Eg: A sea anemone

Ecological Vocabulary Niche The role of an organism within its community in an ecosystem

Recap: Biomes • Different ECOLOGICAL areas- distinct characteristics • Called Biomes. • Each biome has: -communities of animals (fauna) - plants (flora) • Fauna and flora have ADAPTED to survive in biome

Biomes & Abiotic Factors • Biomes are different based on nonliving factors • ABIOTIC factors • p. H, Light intensity, oxygen concentration, moisture levels, rainfall, temperature

Abiotic Factors: p. H and Temperature • Affects type of plants that grow • Can affect fish/aquatic animals

Abiotic Factors: p. H and Acid Rain • Damages plants/trees • Makes soil Acidic • Devastating effect on aquatic animals

Abiotic Factors: Temperature and thermal pollution • Electric power stations use river water as coolant • Water returned warmer • Increase temp, decrease oxygen • Decrease of fish
 Abiotic Factors: non living factors which affects ecosystems Examples include: Temperature,")
Abiotic Factors (copy) Abiotic Factors: non living factors which affects ecosystems Examples include: Temperature, rainfall, p. H and light intensity

Biomes: Biotic Factors • Other LIVING factors affect distribution of Biomes • BIOTIC FACTORS- direct result of living things • Amount of food, number of predators, competition, disease

Biotic Factors: Food availability • Producers/ consumers • Herbivore, Omnivore, Carnivore • Barnacle geese summer vs winter
 resources • Animals:")
Biotic Factors: Competition • Between organisms who both use same (limited) resources • Animals: - food, water, habitat -Red Squirrel Vs Grey squirrel • Plants: - light, water, space -Redwood trees

Biotic Factors: Disease • Viruses, bacteria, fungi • Parasitism • Organisms weak- unable to feed/reproduce/ survive • More susceptible to attack
 Biotic Factors: Living factors which affect ecosystems Examples Include: Availability of")
Biotic Factors (copy) Biotic Factors: Living factors which affect ecosystems Examples Include: Availability of food, Competition and disease
")
Biotic Factors: Grazing • Affects species diversity in grassland • Grassland- rich variety (normally) - some types vigorous, some delicate • Unselective grazers (rabbits) • Low grazing- dominant plants not held in check • Increase- resources for smaller, delicate plants • High- diversity decreases
 • Grazing is a biotic factor which affects biodiversity. • If a")
Grazing (copy) • Grazing is a biotic factor which affects biodiversity. • If a particular area is under-grazed, the biodiversity is decreased because dominant plants smother the less dominant plants which stops them from growing; this results in fewer plant species. • If an area is over-grazed, the biodiversity is also reduced because all plants are being grazed; some may be wiped out therefore reducing diversity. • If an area is moderately grazed, this can increase the biodiversity because dominant plants are kept in check by grazers thus allowing more delicate plants to flourish.

Biotic Factors: Predation • Affects predator and prey • Predator = carnivore, Prey = herbivore/smaller carnivore • Balance between both predator and prey
 • Predation is a biotic factor which can also affect the biodiversity.")
Predation (copy) • Predation is a biotic factor which can also affect the biodiversity. • Predators can be responsible for keeping populations of prey in check, and thus allow an increase in biodiversity. • If predators are reduced or removed, the prey then increase in numbers and so this can lead to over-grazing and a reduction in the number of plant species. • There is a fine balance between numbers of predators and prey. • As the number of prey increase, so does the number of predators as they have more food to eat. This results in a reduction in prey numbers. • As number of prey fall so does the number of predators as their food supply is limited.

Textbook Questions • Page 156, questions 1 -3
 abiotic factors b) Biotic factors")
Lesson Starter 1. What is the meaning of a) abiotic factors b) Biotic factors and give examples of each. 2. Describe the effect of grazing at a) low level b) high level c) very high level on biodiversity. 3. Describe the relationship between predators and prey

Learning Intention • To learn about food chains • To learn about food webs • To understand the effect on food webs if one link is removed

Energy • All organisms require energy. • This energy comes, initially, from the sun. • It is trapped by green plants by photosynthesis. • This energy is then passed from organism to organism along the food chain.

Food Chains • Food chains show which organisms eat other organisms Grass Rabbit Fox • The arrows show the transfer of energy from one organism to the next.

Food Chains • Producers - organisms which can make their own energy from carbon dioxide and water using sunlight for energy (plants) • Primary consumer - organisms which eat producers (herbivores) • Secondary consumers - organisms which eat primary consumers (carnivores) • Tertiary consumers - organisms which eat secondary consumers (carnivores)
 Primary Consumer (Herbivore) Eagle Tertiary")
Food Chains Grass Producer Rabbit Fox Secondary Consumer (Carnivore) Primary Consumer (Herbivore) Eagle Tertiary Consumer (Carnivore)
")
Trophic Levels • Each level= trophic level • Start with producer (first trophic level)
 • All organisms require energy to survive. The energy comes from")
Food Chains (copy) • All organisms require energy to survive. The energy comes from the sun and is trapped by green plants during photosynthesis. The energy is the passed on along a food chain. • All food chains begin with a producer (green plant). Primary consumers eat producers. Secondary consumers eat the primary consumers. Tertiary consumers eat the secondary consumers and so on. • Each level of the food chain is called a trophic level

Task 1. Write down 3 examples of food chains with at least 4 trophic levels. 2. Label the producer, primary consumer, secondary consumer and tertiary consumer 3. Label which animals are herbivores and which are carnivores

Energy in Food chains • Each time an organism is eaten, energy passes along the food chain. • The arrows indicate the direction of the energy flow. • This passing of energy is represented by arrows: Grass Rabbit Fox Eagle • 90% of energy is lost, each level gains only 10% from previous

Energy loss in Food chains The lost energy is lost as: –Heat –Movement –Undigested materials.
 • The arrows in a food chain represent")
Energy loss in Food Chains (copy) • The arrows in a food chain represent the passing of energy. • Each trophic level gains only 10% of energy from the previous trophic level. • Energy is lost in food chains as: Heat, Movement and in Undigested Materials. Grass Rabbit 100, 000 kj 10, 000 kj Fox 1, 000 kj Eagle 100 kj
 2. Corn Locust (250, 000")
Task- Copy and Complete 1. Sunflower (170, 00 kj) 2. Corn Locust (250, 000 kj) 3. Grass (1, 000 kj) Snail Insect Lizard Mouse Barn Owl Snake Eagle Cougar

Food Webs Combination of food chains= FOOD WEB 1. What producers are present in the food web? 2. How many different food chains are interlinked?
")
Food web (copy)

1. What are the producers? 2. How many food chains can you find? 3. Which animal(s) are OMNIVORES?

1. What will happen to the number of clown fish if the sharks become vegetarian? 2. What effect will this have on the number of zooplankton? 3. What will happen to the Blue Regal fish if a disease wipes out the small invertebrates.
 Hawks are removed b) Grasshoppers")
Food webs What happens to the ecosystem when: a) Hawks are removed b) Grasshoppers are removed c) Mice are removed
 • The balance in a food web is disturbed if one")
Food Webs (copy) • The balance in a food web is disturbed if one species is removed. • The fewer links there are in the food chain, the more severe the consequence. • More links in a food chain means the consequence isn’t as severe. • Removing links from food webs results in competition for food between animals of the same species (intraspecific competition) and animals of different species (interspecific competition)

Glossary Words • • • Predation Grazing Producer Consumer Herbivore Omnivore Carnivore Interspecific Competition Intraspecific Competition

Lesson Starter

Learning Intention

Pyramids of numbers • Food chains give feeding RELATIONSHIPS but no numbers • In food chains, number of organisms should decrease with each trophic level • Producer= highest

Pyramids of numbers • Each level represents total population of organism • Numbers decrease as energy is lost
 • Food chains give us the feeding relationships between the")
Pyramids of numbers (copy) • Food chains give us the feeding relationships between the different organisms, but they don’t provide any information about numbers. • Each level represents the total population of each organism in the food chain. • As we travel further is the food chain, numbers decrease as energy is lost.

Irregular Pyramids
 • Sometimes the pyramid of numbers doesn't look like a pyramid")
Irregular Pyramids (copy) • Sometimes the pyramid of numbers doesn't look like a pyramid at all. This could happen if the producer is a large plant such as a tree, or if one of the animals is very small. Eg. An oak tree is very large so many insects can feed on it or Fleas are very small and lots of them can feed on a Fox.

Pyramid Of Biomass • Pyramids of numbers- not best way to represent feeding relationships • Pyramid of BIOMASS • Each level of food chain represented by MASS
 Pyramids of BIOMASS are used to give a better representation")
Pyramid Of Biomass (copy) Pyramids of BIOMASS are used to give a better representation of feeding relationships. Each level of the food chain represents the MASS of the organism.

Pyramid of Energy • Most reliable- feeding relationships • Measured as kilojoules per square metre per 2 year (k. J/m /year). • Energy lost at each stage: - pyramid formed must be true.
 • The most reliable way of showing feeding relationships is")
Pyramid of Energy (copy) • The most reliable way of showing feeding relationships is to use a pyramid of energy. • It is measured as kilojoules per square metre per year (k. J/m 2/year). • Since energy is lost at each stage, the pyramid formed must be true.
- Slides: 62