Learning Evaluation Analysis Platform Overview LEAP Problem Statement

Learning, Evaluation & Analysis Platform Overview

LEAP Problem Statement 3 problems: ▫ Unstandardized databases complicated data usage ▫ Deliverables, documents and dashboards uneven across projects ▫ MERL pages not very “friendly”/useful ▫ Capisc not sufficient for project needs Since 2013, LEAP!

LEAP conceptual framework

International Development – Time allocation WHAT DONORS WANT VALUE PRE-LEAP TIME SPENT OBTAIN & CLEAN DATA ORGANIZE AND STORE DATA CALCULATE REQUIRED DATA OBTAIN CALCULATE REQUIRED & CLEAN DATA OBTAIN & CLEAN DATA ORGANIZE AND STORE DATA EXPLORE & LEARN CALCULATE REQUIRED DATA EXPLORE & LEARN

Need to change how to invest time Annual Survey CALCULATE REQUIRED DATA ORGANIZE AND STORE DATA CALCULATE EXPLO RE & LEARN REQUIRED DATA EXPLO RE & LEARN CALCULATE REQUIRED DATA OBTAIN & CLEAN DATA Annual Survey ORGANIZE AND STORE DATA CALCULATE REQUIRED DATA EXPLORE & LEARN OBTAIN & CLEAN DATA CALCULATE REQUIRED DATA EXPLO RE & LEARN

What is the LEAP strategy? • People = 10 -day training + Remote support • Process = MERL Policy + Follow-up • Tools = Standard database + automated reports + Share. Point page
 • FACILITATES PROJECT MANAGEMENT ▫ Standardized project management")
Learning, Evaluation & Analysis Platform (LEAP) • FACILITATES PROJECT MANAGEMENT ▫ Standardized project management checks, facilitates adaptive management • AUTOMATES REPORTING REQUIREMENTS ▫ Automatically generated IPTT • EXPOSES DIGESTED DATA ▫ Adaptive management / data-driven leadership • EXPOSES RAW DATA ▫ Corporate and cross-Project analysis & project cross-pollination • PROVIDES STANDARDIZED ASSET MANAGEMENT ▫ Facilitates support, ensures audit compliance, insures against staff turnover

WITH NO RAW DATA MANAGEMENT SYSTEM I theorize that A B. Let me check Indicators PIRS PMELP To. C Etc… FAIL Oh well, at least I respected my PMELP WITH A WELL FUNCTIONING RAW DATA MANAGEMENT SYSTEM I theorize that A B. Let me check Indicators PIRS PMELP To. C Etc… FR LO ESH OK FAIL Huh… that’s interesting. I wonder if… THE ACTUAL DATA ANALYSIS WINS + LEARNING!!

Raw data mgmt. example Beneficiaries Trained Applied Tech Indicators: Bens Trained: - Actual = 5 - Target = 5 - Percent = 100% Applied Tech: - Actual = 3 - Target = 5 - Percent = 60% data is not a reporting obligation, it’s an opportunity Near roads Not-near roads Gender? Age Group? Near Market? Near water? Local politics?

FULL DETAILS RESPONSIBLE: PROJECT STAFF FAST & EASY checks RESPONSIBLE: REGIONAL STAFF


Global LEAP Leads International M&E Specialists • Follow-up support • System QC and monitoring International MIS Specialists • Project Startup • Follow-on trips (on request) • Remote tech support • Upgrades/improvements Niri Ramasinjatovo Senior Director MERL Jeremy Barnes Director S &T Silimane Ngoma Regional Director MERL Amit Kohli Director S&T + 27 Project experts!

Finding a project’s LEAP Site and description of LEAP Landing page

Finding a Project’s LEAP – AV Intranet https: //acdivoca. sharepoint. com/sites/Intranet

Finding a Project’s LEAP – Projects Select the country https: //acdivoca. sharepoint. com/sites/Intranet/projects

Finding a Project’s LEAP – Country Page Select the project

Finding a Project’s LEAP – Project Page Click Project LEAP

Project LEAP Landing Page

LEAP Landing Page – MIS Administrators Responsible for: • Project M&E Data Management • Visualization & Analytics • Ad Hoc Queries

LEAP Landing Page – Theory of Change

LEAP Landing Page – Dashboards

LEAP Landing Page – Learning & Impacts

LEAP Landing Page – Filing Cabinet

LEAP Landing Page – Database Summaries • Top-level view of all project data • Measurement according to current year’s time lapse

LEAP Landing Page – Database Updates • Flow of information arriving into the MIS • If activities are being implemented, data should be increasing • Flat lines are meaningful, but not always bad!

Indicator Tally & Bullet Chart

Indicator Tally – Navigation Click Live Indicator Tally

Indicator Tally – Automated IPTT Get Excel Copy Indicators and performance (target, actual, % achieved) by FY and Lo. P Note the date of calculation!

Indicator Tally – Automated IPTT Output achievement with time lapse How much is needed to be “current” Status 2 weeks ago Value added last 2 weeks

Indicator Tally – Interpretation Target achievement is not always linear, so slow movement not always a sign of bad performance! Examples: • Some activities may be planned for later in the year (slow for several months then a surge) • Situation on the ground halts activities

What do we need from project staff? • Upload ALL data • Work with us to ensure automated queries are correct • Use it!

M&E Deliverables • Follow-up on M&E Obligations • Hard: • Contractual Obligations (Annual Report, Database created, …) • Soft: • Intermediate goals for Hard deadlines • Action Point items: (DQA findings, MIS findings, …) Database here!

Project selector Soft/Hard Deadlines PY selector Milestone Timeline
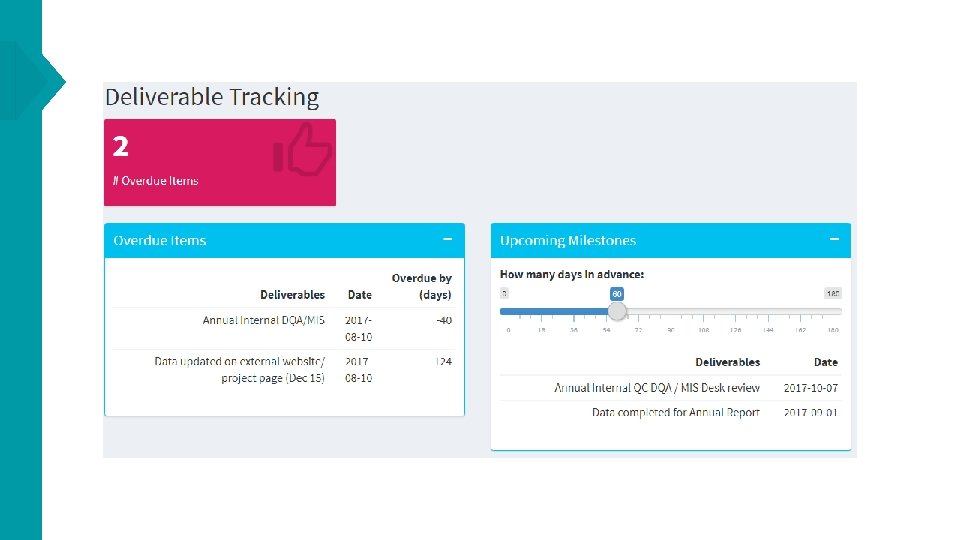

What do we need from project staff? • Upload all deliverables to Filing Cabinet • Ensure Due dates are correct • Ensure Milestones “apply” • Enter in when deliverables are “Inprogress” & “Finalized” • Use it!

Future initiatives

DISAGGREGATES IN AUTOMATED IPTT

Other Future initiatives • Quarterly Reports? • Power View Power BI • Simplified calcs for Project Staff

Data Stories & Power BI demo

LEAP Summary • People = Project staff & HQ staff • Process = Trainings, DQAs, Backend updater • Tools = Project databases – Raw data, LEAP Sites, Dashboards, automated reports OUR GOAL: Everything you need to make decisions on your M&E data -> Work planning, Adaptive Management, Proactive Adaptation

Small Group / Brainstorm How can your team use LEAP assets WEEKLY? Missing anything? For example:

Example 1, Data completeness report?

Example 2, Full-Year Views

Current LEAP Automatic Assets Data Uploads Auto-IPTT Indicator Summaries Indicator History? + Project dashboards! Indicator Performance Milestone & Action Point Tracker

Thanks!
- Slides: 45