Learning curves The learning curve Graphic illustration of


 in time needed is constant for every")

 For the nth unit: T n = T 1 * nb")


- Slides: 12
Learning curves
The learning curve • Graphic illustration of the productivity change as a function of repetition (or time). It is relatively stable in time, thus we can use it to predictions. • Theodore Paul Wright (1936)
Learning curve with no change in the task
On a log-log graph
Learning curve with innovations Idő
Based on empirical findings • Decrease (%) in time needed is constant for every duplication of the number of repetitions. It is typicaly between 10 -20%.
Example • Learning percentage: 80% • First performance time: 10 hrs • How much time it needs to finish the 2 nd, 4 th, 8 th and 16 th repetition? – 2 nd: 10*0, 8 = 8 – 4 th: 8*0, 8 = 6, 4 – 8 th: 6, 4*0, 8 = 5, 12 – 16 th: 5, 12*0, 8 = 4, 1
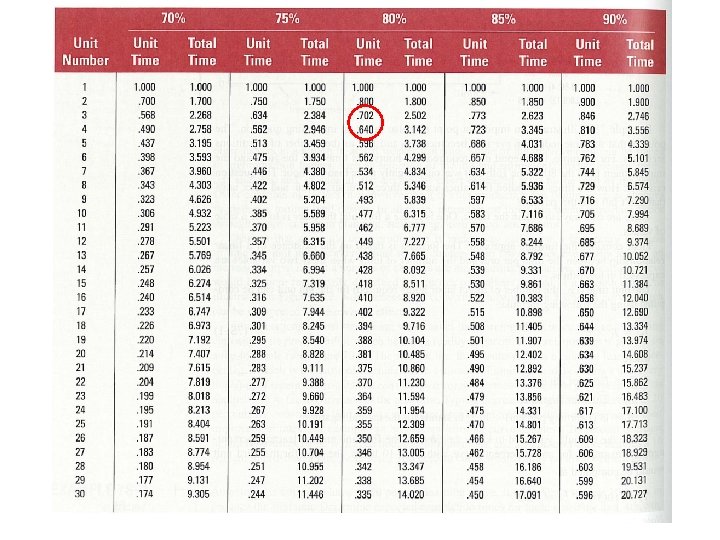
General formula 1) For the nth unit: T n = T 1 * nb b = learning percentage) / ln 2 For the 3 rd and 4 th unit: T 3 = 10*3(ln 0. 8/ln 2) = 7, 02 T 4 = 10*4(ln 0. 8/ln 2) = 6, 40 2) From table: Tn = T 1 * coefficient
Example 2 We want to produce 20 units. Learning percentage is 80. T 1 = 400 hrs. a) How much is the production time for the 20 th unit? b) What will be the cumulative production time? What is the average production time? • • T 20 = 400*20(ln 0. 8/ln 2) = 152. 48 • T 20 = 400*10. 485 = 4194 • 4194/20 = 209. 7
Mass production and learning curves
Evaluating employees