
Leapfrog Hospital Rewards Program Measures Scoring Presentation Objectives
Leapfrog Hospital Rewards Program: Measures & Scoring
Presentation Objectives 1. 2. 3. 4. Review 2008 Leapfrog Survey components Applying Survey components to LHRP Translating Survey results into LHRP scores Understanding LHRP scores
Program Parameters • Leapfrog Hospital Survey is the sole measure source • Reward efficiency (i. e. , intersection of quality and resource utilization) • Reward top performers and improvers • Scoring consistent with Leapfrog Hospital Survey public reporting • Flexibility in reward design

2008 LEAPFROG HOSPITAL SURVEY • • Computerized Physician Order Entry (CPOE) ICU Physician Staffing (IPS) Evidence-Based Hospital Referral (EBHR) Safe Practices Score (SPS) Common Acute Conditions (CAC) Hospital-Acquired Conditions (HAC) Other Policies & Public Reporting – Never Events – Transparency Indicator 4 LHRP Advisory Group: 2008 Survey 5/09/2008
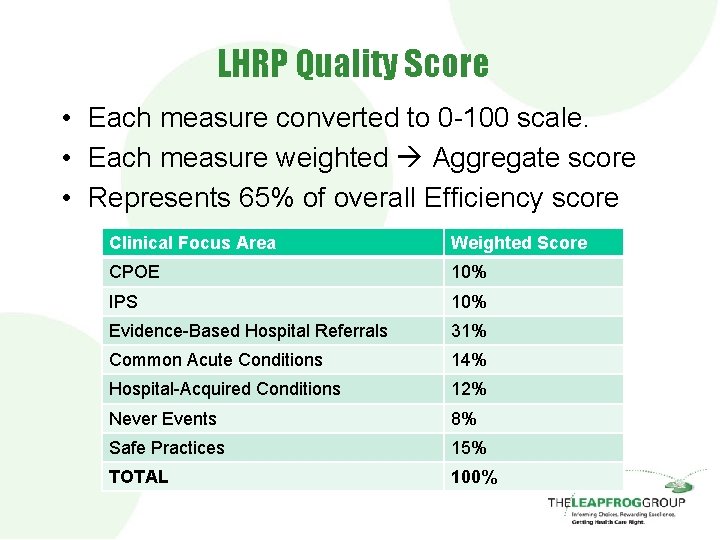
LHRP Quality Score • Each measure converted to 0 -100 scale. • Each measure weighted Aggregate score • Represents 65% of overall Efficiency score Clinical Focus Area Weighted Score CPOE 10% IPS 10% Evidence-Based Hospital Referrals 31% Common Acute Conditions 14% Hospital-Acquired Conditions 12% Never Events 8% Safe Practices 15% TOTAL 100%
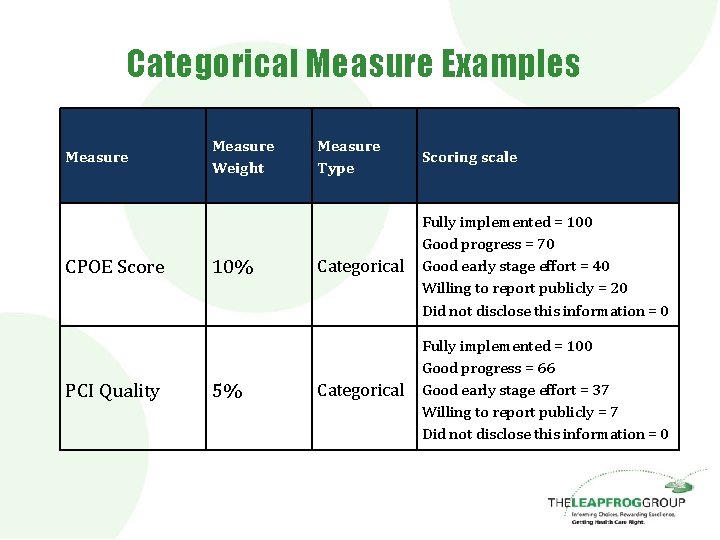
Categorical Measure Examples Measure CPOE Score PCI Quality Measure Weight 10% 5% Measure Type Scoring scale Categorical Fully implemented = 100 Good progress = 70 Good early stage effort = 40 Willing to report publicly = 20 Did not disclose this information = 0 Categorical Fully implemented = 100 Good progress = 66 Good early stage effort = 37 Willing to report publicly = 7 Did not disclose this information = 0
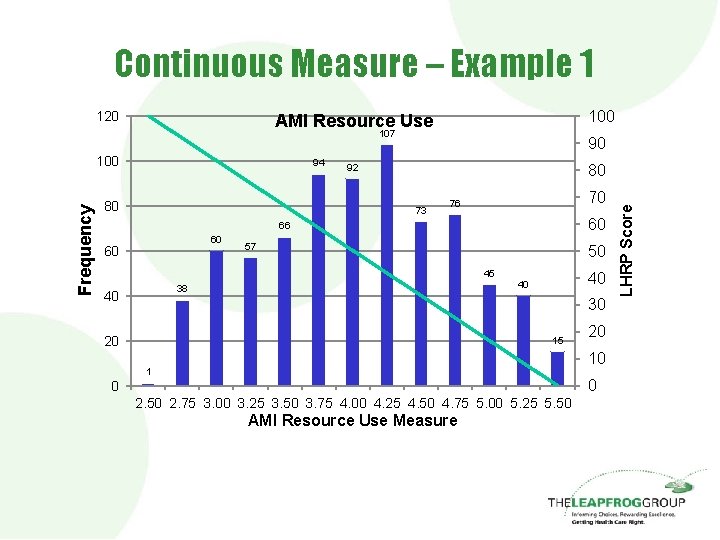
Continuous Measure – Example 1 100 AMI Resource Use 107 Frequency 100 94 80 90 80 92 73 70 76 60 60 57 50 45 40 40 40 38 30 20 15 20 10 1 0 0 2. 50 2. 75 3. 00 3. 25 3. 50 3. 75 4. 00 4. 25 4. 50 4. 75 5. 00 5. 25 5. 50 AMI Resource Use Measure LHRP Score 120
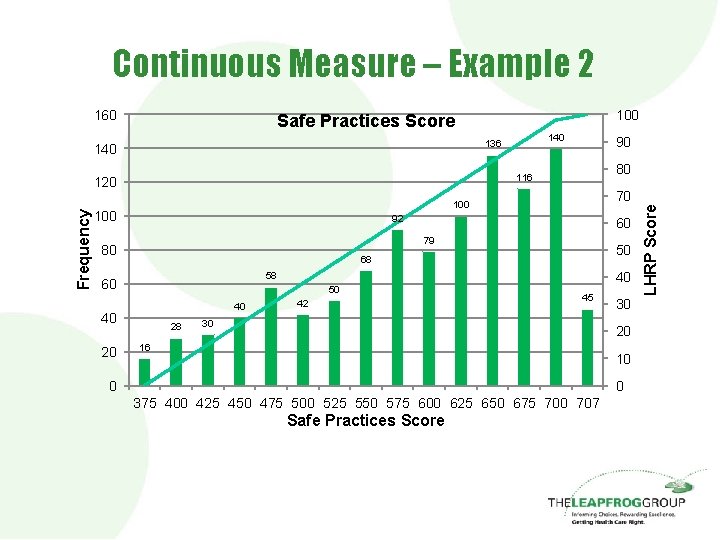
Continuous Measure – Example 2 90 80 116 120 Frequency 140 136 140 70 100 92 60 79 80 50 68 40 58 60 50 40 40 20 100 Safe Practices Score 28 42 45 30 30 20 16 10 0 0 375 400 425 450 475 500 525 550 575 600 625 650 675 700 707 Safe Practices Score LHRP Score 160
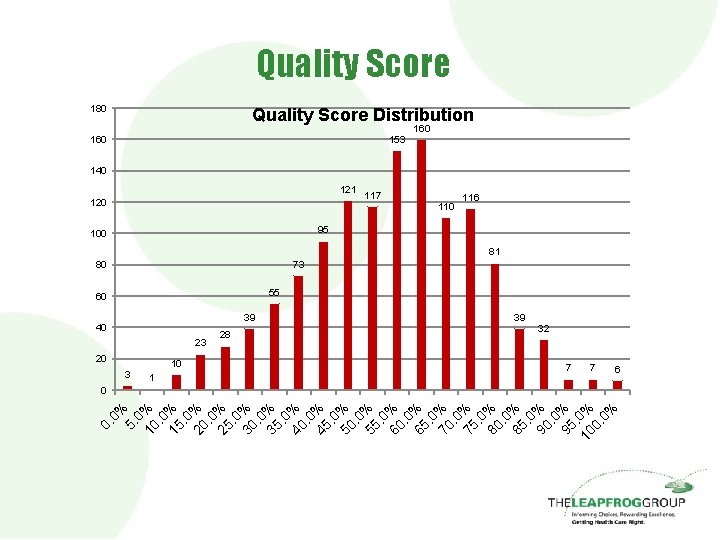
0. 0% 5. 0 10 %. 0 15 %. 0 20 %. 0 25 %. 0 30 %. 0 35 %. 0 40 %. 0 45 %. 0 50 %. 0 55 %. 0 60 %. 0 65 %. 0 70 %. 0 75 %. 0 80 %. 0 85 %. 0 90 %. 0 95 %. 10 0% 0. 0% Quality Score 180 Quality Score Distribution 160 153 120 121 100 80 60 40 39 23 20 3 10 1 28 117 160 140 116 95 73 81 55 39 32 7 7 0 6
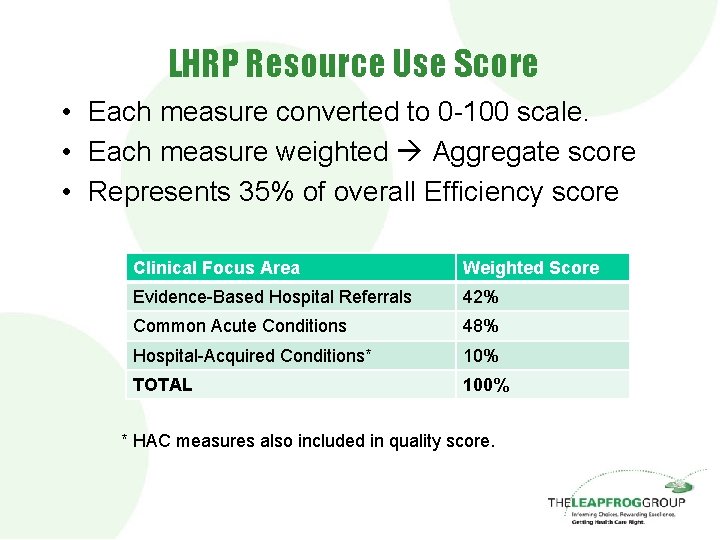
LHRP Resource Use Score • Each measure converted to 0 -100 scale. • Each measure weighted Aggregate score • Represents 35% of overall Efficiency score Clinical Focus Area Weighted Score Evidence-Based Hospital Referrals 42% Common Acute Conditions 48% Hospital-Acquired Conditions* 10% TOTAL 100% * HAC measures also included in quality score.
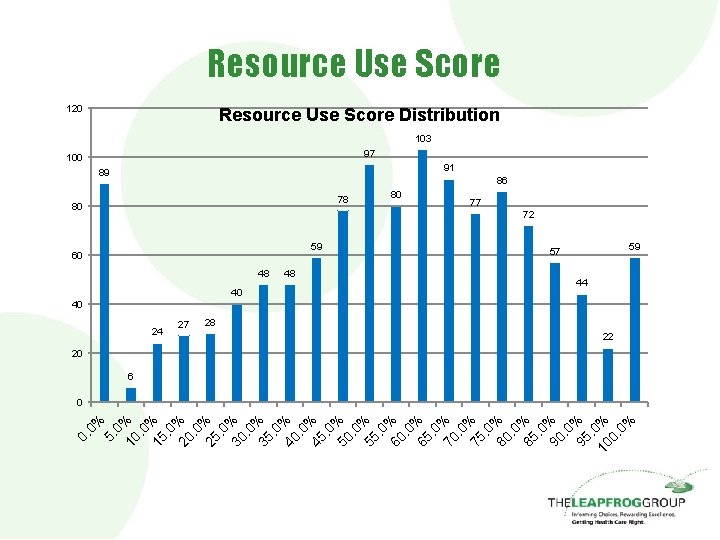
Resource Use Score 120 Resource Use Score Distribution 103 97 100 91 89 86 78 80 80 77 72 59 60 48 40 48 59 57 44 40 24 27 28 22 20 6 5. 0% 10. 0 % 15. 0 % 20. 0 % 25. 0 % 30. 0 % 35. 0 % 40. 0 % 45. 0 % 50. 0 % 55. 0 % 60. 0 % 65. 0 % 70. 0 % 75. 0 % 80. 0 % 85. 0 % 90. 0 % 95. 0 10 % 0. 0% 0
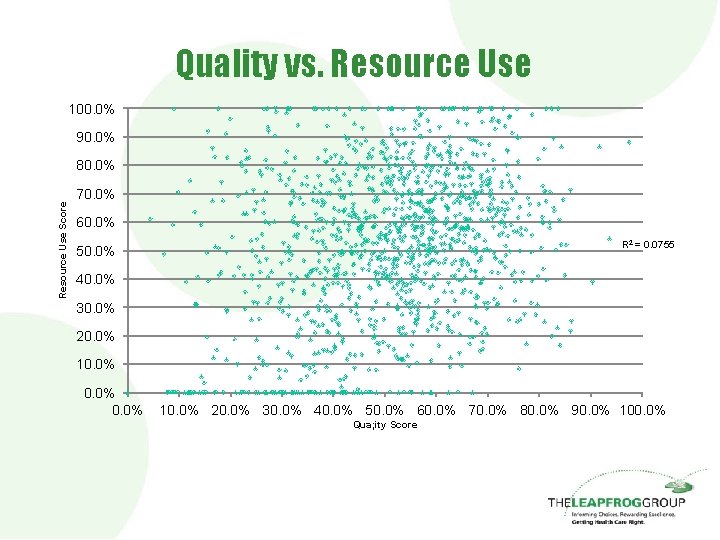
Quality vs. Resource Use 100. 0% 90. 0% Resource Use Score 80. 0% 70. 0% 60. 0% R 2 = 0. 0755 50. 0% 40. 0% 30. 0% 20. 0% 10. 0% 20. 0% 30. 0% 40. 0% 50. 0% 60. 0% 70. 0% 80. 0% 90. 0% 100. 0% Qua; ity Score
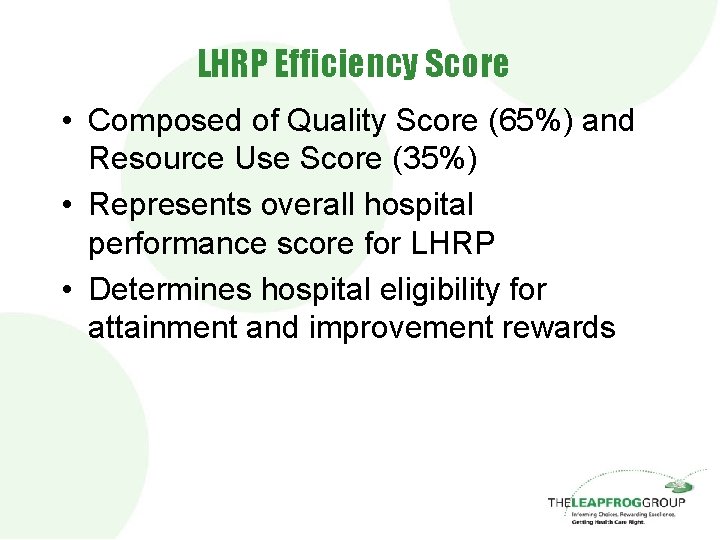
LHRP Efficiency Score • Composed of Quality Score (65%) and Resource Use Score (35%) • Represents overall hospital performance score for LHRP • Determines hospital eligibility for attainment and improvement rewards
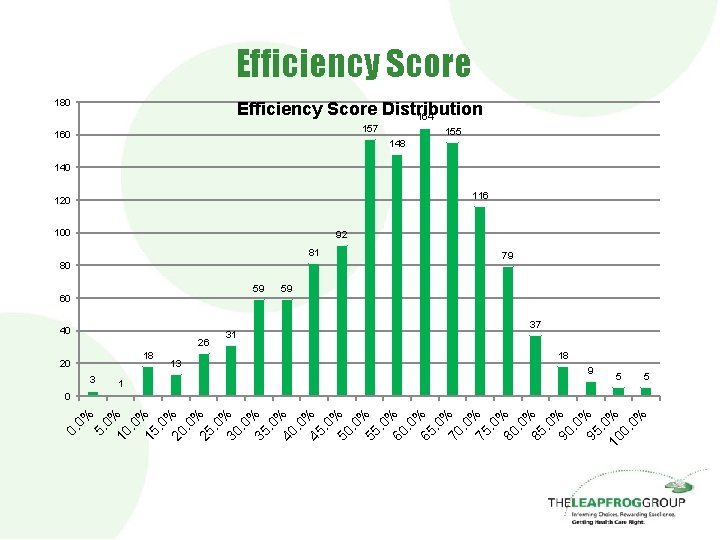
Efficiency Score 180 Efficiency Score Distribution 164 157 160 155 148 140 116 120 100 92 81 80 59 60 40 26 18 20 3 79 59 37 31 18 13 9 1 5 0% 45. 0 % 50. 0 % 55. 0 % 60. 0 % 65. 0 % 70. 0 % 75. 0 % 80. 0 % 85. 0 % 90. 0 % 95. 0 10 % 0. 0% 0% 40. 35. 0% 30. 0% 25. 0% 20. 0% 15. 0% 10. 0% 5. 0% 0 5
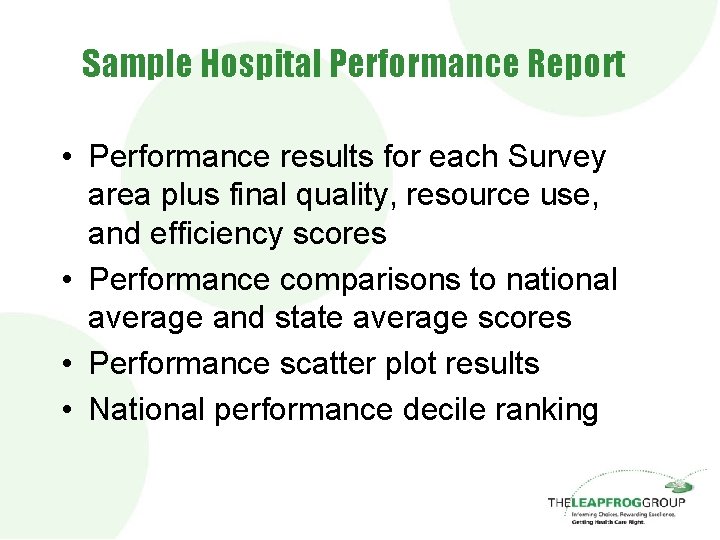
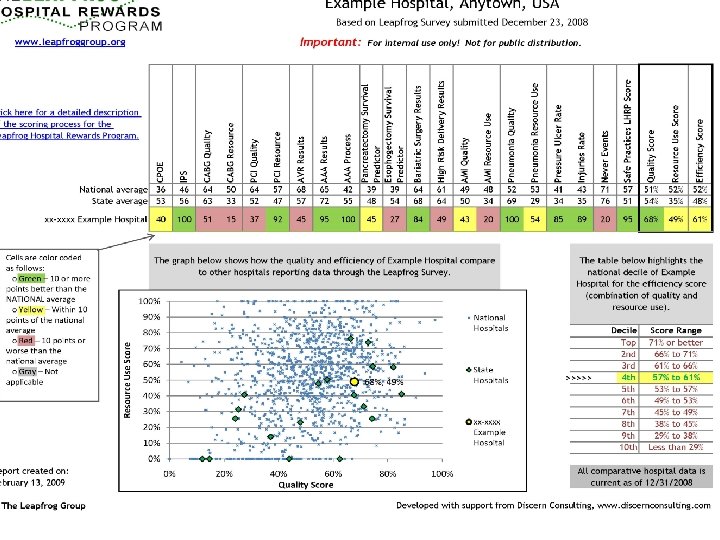
Sample Hospital Performance Report • Performance results for each Survey area plus final quality, resource use, and efficiency scores • Performance comparisons to national average and state average scores • Performance scatter plot results • National performance decile ranking

Contact Information Leah Binder, CEO LBinder@leapfroggroup. org (202)292 -6713 Guy D’Andrea Discern Consulting gdandrea@discernconsulting. com (410) 542 -4470
- Slides: 17