
Leander Schietgat Hendrik Blockeel Jan Struyf Katholieke Universiteit
Leander Schietgat Hendrik Blockeel Jan Struyf Katholieke Universiteit Leuven (Belgium) Amanda Clare University of Aberystwyth (Wales) Sašo Džeroski Jožef Stefan Institute Ljubljana (Slovenia) Hierarchical multilabel classification trees for gene function prediction Probabilistic Modeling and Machine Learning in Structural and Systems Biology Tuusula, Finland, 17 -18 June 2006
Overview n The application n n The machine learning context n PMSB n 2/21 hierarchical multilabel classification Decision trees for HMC n 2006 gene function prediction the algorithm: Clus-HMC n Experimental results n Conclusions
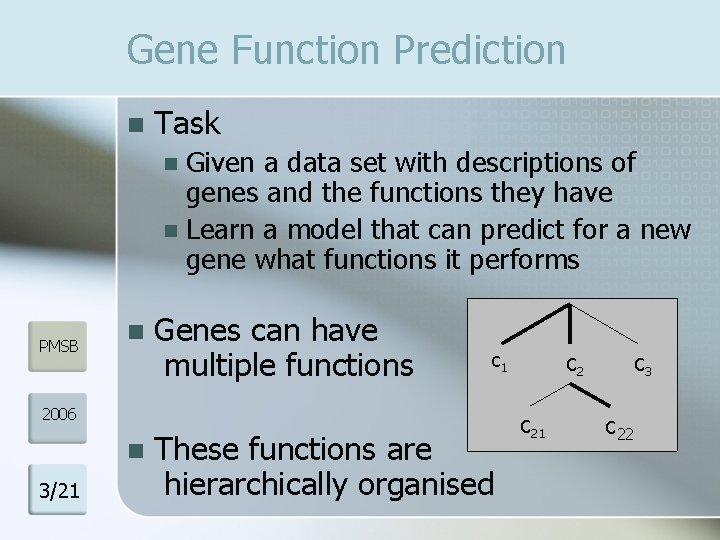
Gene Function Prediction n Task Given a data set with descriptions of genes and the functions they have n Learn a model that can predict for a new gene what functions it performs n PMSB n Genes can have multiple functions 2006 n 3/21 c 2 c 1 These functions are hierarchically organised c 21 c 3 c 22
Machine Learning n Classifier predicts for unseen instances the class to which they belong n learned with already classified training examples n PMSB 2006 4/21 n Different techniques decision trees n support vector machines n bayesian networks n… n
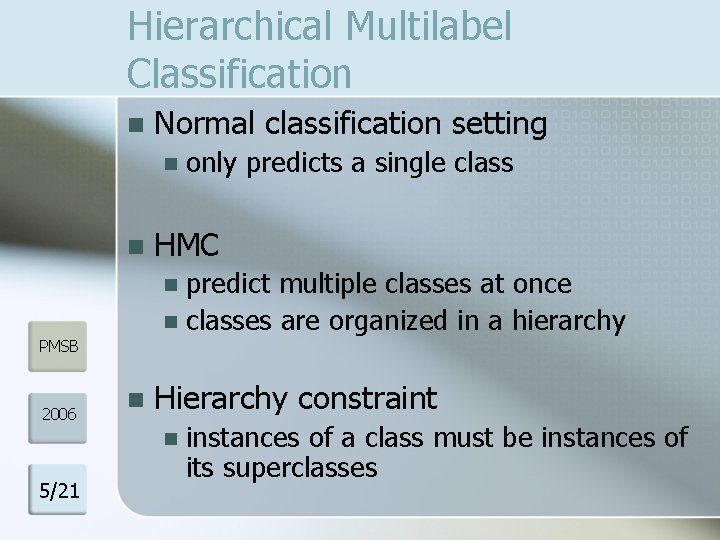
Hierarchical Multilabel Classification n Normal classification setting n n only predicts a single class HMC predict multiple classes at once n classes are organized in a hierarchy n PMSB 2006 n Hierarchy constraint n 5/21 instances of a class must be instances of its superclasses
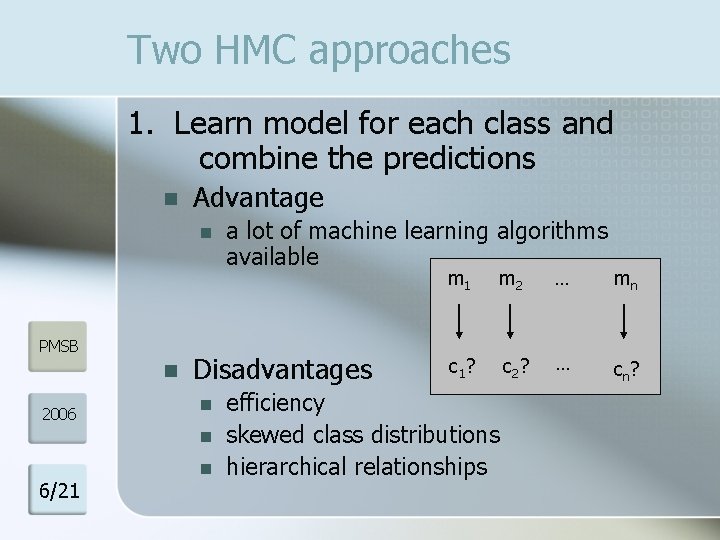
Two HMC approaches 1. Learn model for each class and combine the predictions n Advantage n PMSB n 2006 Disadvantages n n 6/21 a lot of machine learning algorithms available n m 1 m 2 … mn c 1 ? c 2 ? … cn ? efficiency skewed class distributions hierarchical relationships
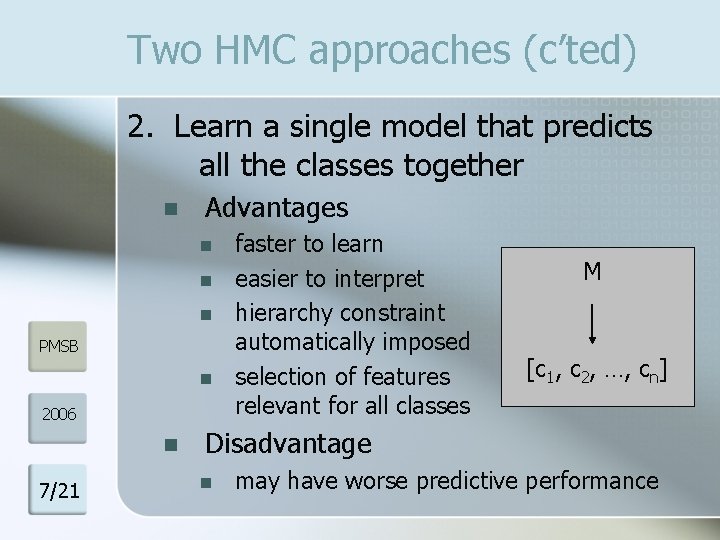
Two HMC approaches (c’ted) 2. Learn a single model that predicts all the classes together n Advantages n n n PMSB n 2006 n 7/21 faster to learn easier to interpret hierarchy constraint automatically imposed selection of features relevant for all classes M [c 1, c 2, …, cn] Disadvantage n may have worse predictive performance
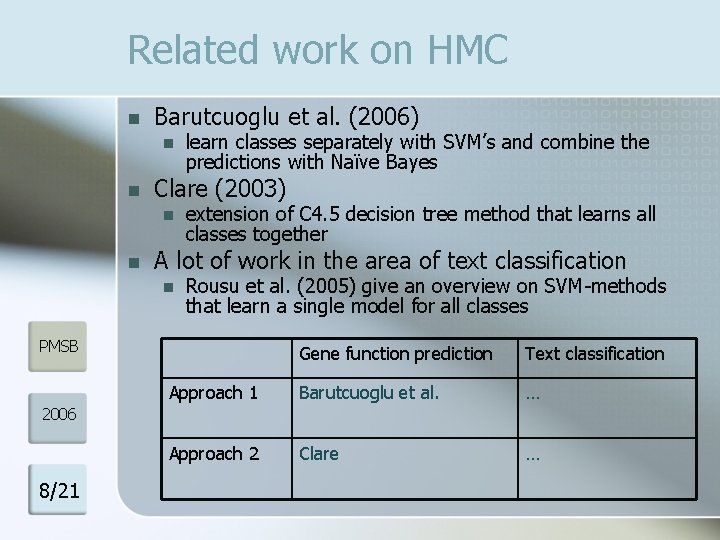
Related work on HMC n Barutcuoglu et al. (2006) n n Clare (2003) n n learn classes separately with SVM’s and combine the predictions with Naïve Bayes extension of C 4. 5 decision tree method that learns all classes together A lot of work in the area of text classification n Rousu et al. (2005) give an overview on SVM-methods that learn a single model for all classes PMSB Gene function prediction Text classification Approach 1 Barutcuoglu et al. … Approach 2 Clare … 2006 8/21
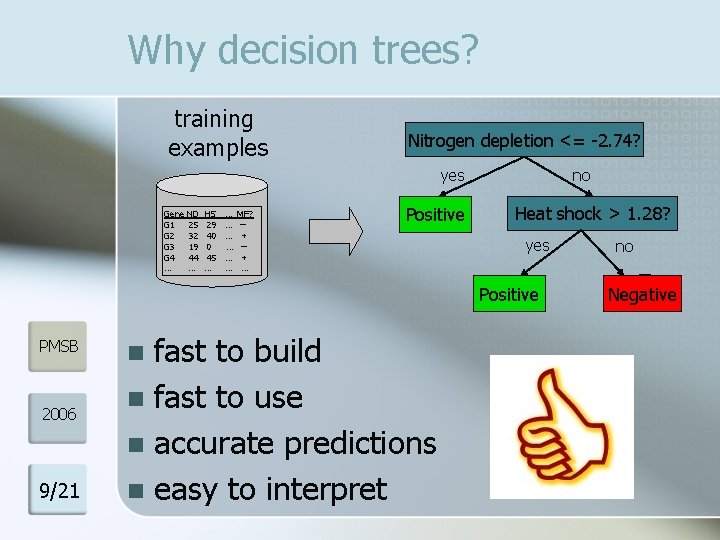
Why decision trees? training examples Nitrogen depletion <= -2. 74? yes Gene G 1 G 2 G 3 G 4 … PMSB 2006 9/21 ND 25 32 19 44 … HS 29 40 0 45 … … … … MF? + + … + Positive ++ fast to build n fast to use n accurate predictions n easy to interpret n no Heat shock > 1. 28? yes ++ + Positive + no + Negative
Decision trees for HMC n The Clus system n n n created by Jan Struyf propositional DT learner, implemented in Java uses ideas of: n n PMSB 2006 10/21 n C 4. 5 [Quinlan 93] and CART [Breiman 84] Predictive Clustering Trees [Blockeel 98] Heuristic for HMC n look for test that minimizes the intra-cluster variance (= generalisation of CART)
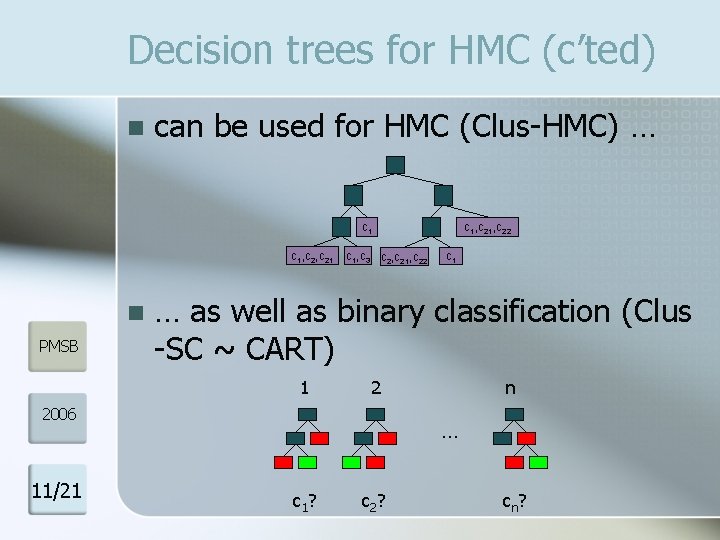
Decision trees for HMC (c’ted) n can be used for HMC (Clus-HMC) … c 1, c 21 n PMSB c 1, c 3 c 2, c 21, c 22 c 1 … as well as binary classification (Clus -SC ~ CART) 1 2 2006 11/21 c 1, c 22 n … c 1 ? c 2 ? cn?
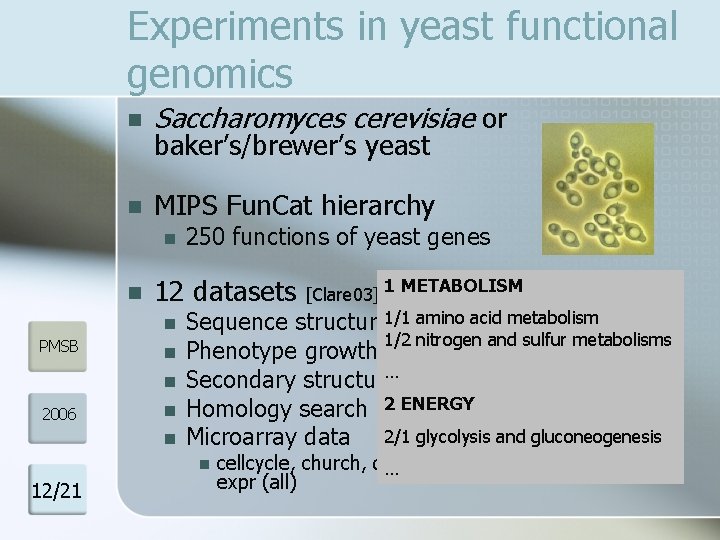
Experiments in yeast functional genomics n Saccharomyces cerevisiae or n MIPS Fun. Cat hierarchy baker’s/brewer’s yeast n n 12 datasets n PMSB n n 2006 250 functions of yeast genes n n 1 METABOLISM amino acid metabolism Sequence structure 1/1 (seq) 1/2 nitrogen and sulfur metabolisms Phenotype growth (pheno) … Secondary structure (struc) 2 ENERGY Homology search (hom) Microarray data 2/1 glycolysis and gluconeogenesis n 12/21 [Clare 03] cellcycle, church, derisi, eisen, gasch 1, gasch 2, spo, … expr (all)
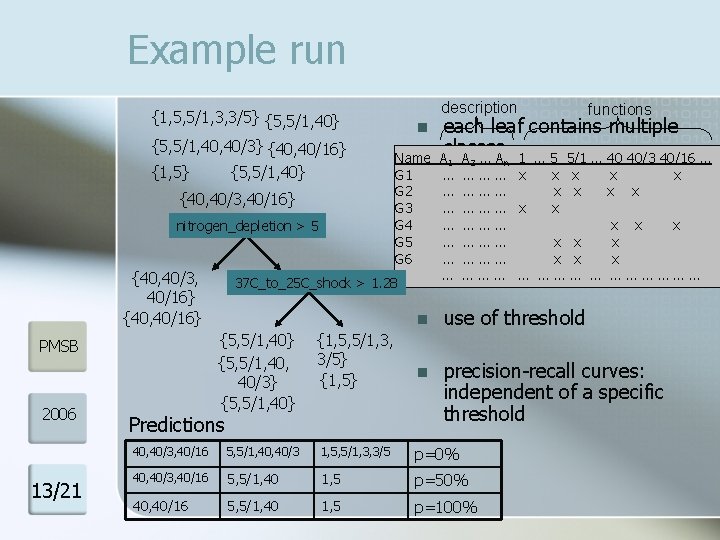
Example run {1, 5, 5/1, 3, 3/5} {5, 5/1, 40, 40/3} {40, 40/16} description n Name {1, 5} {5, 5/1, 40} G 1 G 2 n {40, 40/3, 40/16} G 3 G 4 nitrogen_depletion > 5 G 5 n G 6 … {40, 40/3, 37 C_to_25 C_shock > 1. 28 40/16} {40, 40/16} {5, 5/1, 40, 40/3} {5, 5/1, 40} PMSB 2006 13/21 {1, 5, 5/1, 3, 3/5} {1, 5} Predictions functions each leaf contains multiple classes A A … A 1 … 5 5/1 … 40 40/3 40/16 … 1 2 n … ……… x x x … …classes x to x predict? x x which … ……… x x x problem: different class … ……… x x x frequencies … ……………… n use of threshold n precision-recall curves: independent of a specific threshold 40, 40/3, 40/16 5, 5/1, 40/3 1, 5, 5/1, 3, 3/5 p=0% 40, 40/3, 40/16 5, 5/1, 40 1, 5 p=50% 40, 40/16 5, 5/1, 40 1, 5 p=100%
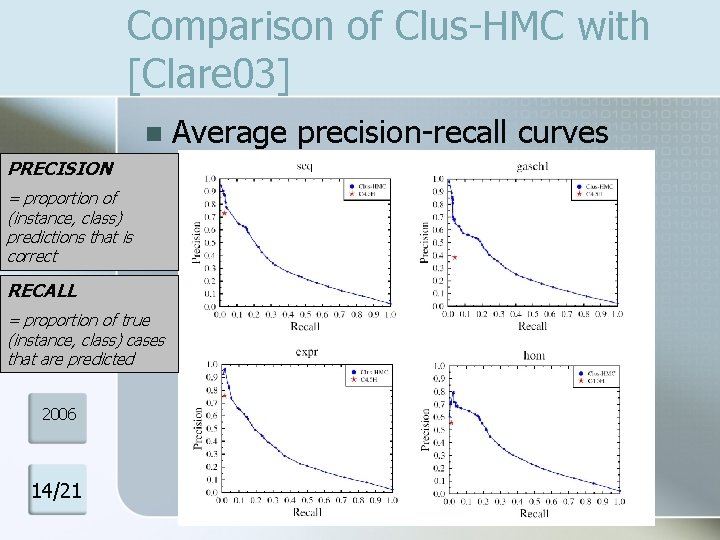
Comparison of Clus-HMC with [Clare 03] n PRECISION = proportion of (instance, class) predictions that is correct RECALL = proportion of true (instance, PMSB class) cases that are predicted 2006 14/21 Average precision-recall curves
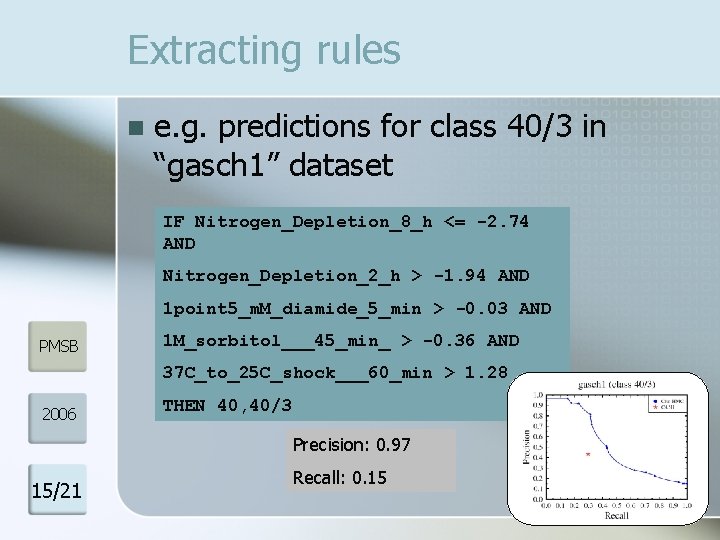
Extracting rules n e. g. predictions for class 40/3 in “gasch 1” dataset IF Nitrogen_Depletion_8_h <= -2. 74 AND Nitrogen_Depletion_2_h > -1. 94 AND 1 point 5_m. M_diamide_5_min > -0. 03 AND PMSB 1 M_sorbitol___45_min_ > -0. 36 AND 37 C_to_25 C_shock___60_min > 1. 28 2006 THEN 40, 40/3 Precision: 0. 97 15/21 Recall: 0. 15
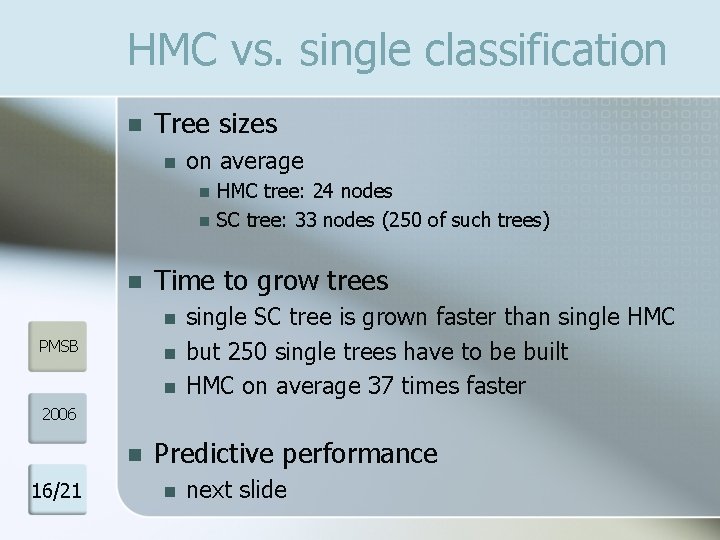
HMC vs. single classification n Tree sizes n on average n n n Time to grow trees n PMSB HMC tree: 24 nodes SC tree: 33 nodes (250 of such trees) n n single SC tree is grown faster than single HMC but 250 single trees have to be built HMC on average 37 times faster 2006 n 16/21 Predictive performance n next slide
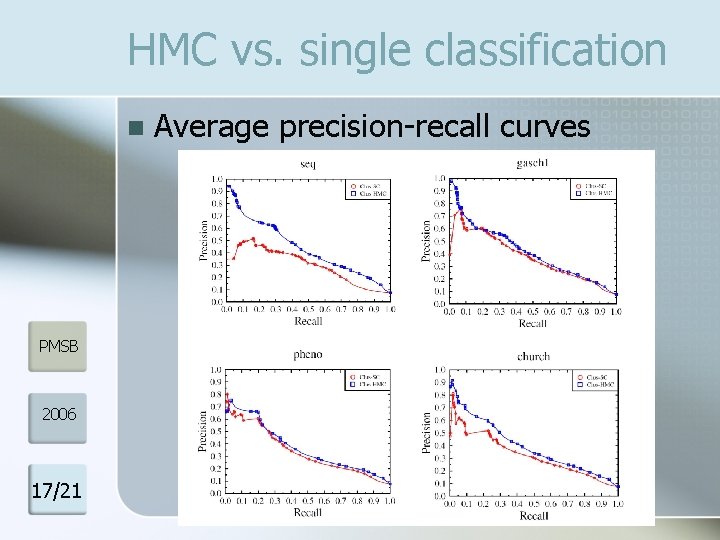
HMC vs. single classification n PMSB 2006 17/21 Average precision-recall curves
Explanation of the results n The classes are not independent n different trees for different classes actually share structure n explains some complexity reduction achieved by Clus-HMC n PMSB one class carries information on other classes n this n 2006 18/21 n increases the signal-to-noise ratio provides better guidance when learning the tree (explaining good predictive performance) avoids overfitting (explaining further reduction of tree size) n this was confirmed empirically
Conclusions n HMC decision trees are a useful tool for gene function prediction n PMSB Compared to regular tree learning, HMC tree learning: n 2006 fast to learn high interpretability n is even faster yields trees that: n n 19/21 n are smaller are easier to interpret have equal or better predictive performance
Further work n Comparison to other HMC learning algorithms n n n PMSB Use more advanced hierarchy such as Gene Ontology n n 2006 kernel methods studied by Rousu et al. and Barutcuoglu et al. other suggestions are welcome! thousands of classes, spread over 19 levels how to handle the part_of relationship? n n 20/21 if a function A is part-of a function B then does a gene with function A also have function B? gene “has” function B X vs. gene “is involved” in function B

Questions? PMSB 2006 21/21
- Slides: 21