LEADING BETTER VALUE CARE Reducing harm from falls

LEADING BETTER VALUE CARE Reducing harm from falls in hospital Northern NSW Falls Prevention Rural Network Forum 1

CLINICAL EXCELLENCE COMMISSION

FALLS COLLABORATIVE ‘Keeping older people safe in our care’ Aim Reduce falls and serious harm from falls by 5% within 12 months Inclusions: Age ≥ 70 years Inpatients in a health service Partial or assisted fall Exclusions: Staff, visitors

Appreciation for a System “Every System is perfectly designed to deliver the results that it gets. ” Psychology of change Theory of Knowledge Unwarranted Variation
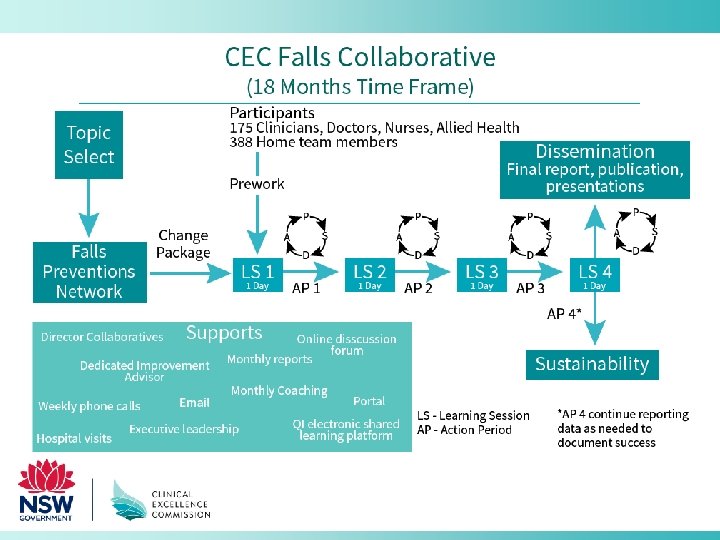

FALLS COLLABORATIVE

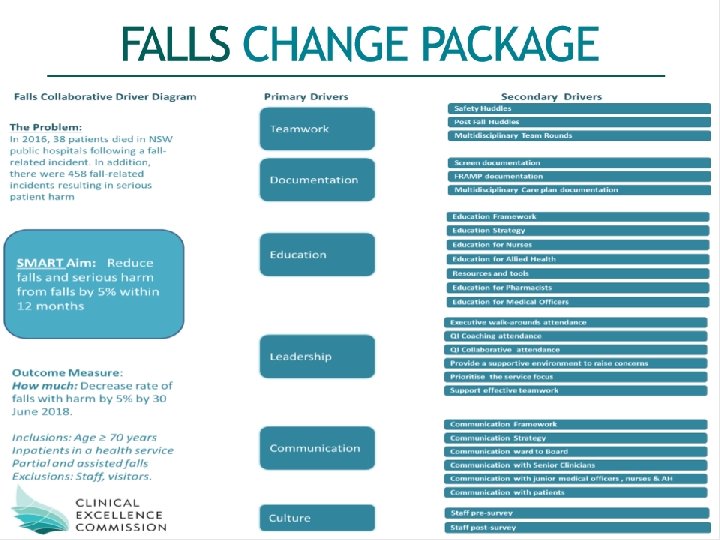
Final Bundle 7

Thinking Doing & Learning

PLAN DO STUDY ACT Changes That Result In Improvement Many PDSA Cycles…. . ta Implementation of Change Da Wide-scale Tests of Change Follow-up Tests Hunches, Theories, Ideas Very Small Scale Tests 10
![0% March April May June July August September October [CELLREF] July 2019 [CELLREF] May](http://slidetodoc.com/presentation_image_h/b7186306b9ee8e2fb07c9267fb89b0ea/image-11.jpg "0% March April May June July August September October [CELLREF] July 2019 [CELLREF] May")
0% March April May June July August September October [CELLREF] July 2019 [CELLREF] May 2019 March 2019 January 2019 December 2018 November 2018 [CELLREF] Week 35 [CELLREF] Week 32 [CELLREF] Week 31 Week 34 [CELLREF] Week 30 [CELLREF] Week 29 Week 33 [CELLREF] [CELLREF] [CELLREF] Falls in Hospital Collaborative Percentage of patients who 'insert intervention here' each week [CELLREF] [CELLREF] Week 28 Week 27 Week 26 Week 25 Week 24 Week 23 Week 22 Week 21 Week 20 Week 19 Week 18 Week 17 Week 16 Week 15 Week 14 Week 13 Week 12 [CELLREF] 100% Week 11 Week 10 60% [CELLREF] 70% Week 9 80% [CELLREF] 90% Week 8 [CELLREF] 40% Week 7 [CELLREF] 50% Week 6 Week 5 Week 4 Week 3 [CELLREF] 10% Week 2 20% [CELLREF] 30% Week 1 CONTINUOUS RUN CHART Periodical sampling

SERIOUS HARM FROM FALLS • 11/40 teams have not had a SAC 1 or 2 for > 390 days ( duration of the Collaborative) • 26/40 teams have not had a SAC 1 or 2 for > 100 days

QUALITY IMPROVEMENT DATA SYSTEM Monitor falls data LHD team activity Resources

CEC Quality Tools Web Site www. cec. health. nsw. gov. au http: //www. cec. health. nsw. gov. au/quality-improvement/improvement-academy/quality-improvementtools 14

QI ACADEMY

NORTHERN NSW - TEAMS Inpatient Unit Byron Central Hospital Aleisha Scanlan and Jennell Cornalle Lismore Hospital - C 7

Using Rapid- Cycle Testing Plan Do Study Act Why, evaluate the impact of potential changes on a given aim?

YOUR AIM & MEASURES • AIM – Improve the performance of a paper aeroplane to maximize the distance it flies and the accuracy of the flight • M e a s u r e s – Distance in meters – Accuracy of the landing (total landing points)

t h Flig PDSA CYCLE FOR IMPROVEMENT Act • What changes are to be made in next cycle? Abandon Adapt Adopt Study • Results of the flight Plan • Assign Roles • Design/change the plane Do • Fly the plane • Record the distance

t h Flig PDSA CYCLE FOR IMPROVEMENT Rules • Only one design change per PDSA cycle • Each team designs and commits to flying only one plane • All planes must have wings and be able to fly • Each design is flown by each of the three pilots • In order to fly you must get clearance from the air traffic controller

t h Flig PDSA CYCLE FOR IMPROVEMENT • Assign the following roles • Team Lead • Pilots x 3 • Data collection/scribe • Design Team • Decide on a Name for your TEAM • Design and build a paper airplane for distance Flight One Collect Your Baseline DATA • Pilot 1, 2 and 3 will fly the plane and record the data; Repeat • Rapid Cycle: More cycles = more data = more chances to improve

What is your theory?

PDSA Tracker # # Plan What questions? Theories? Prediction Do Study Act What do you see? How Long? How did what you see match prediction? What now? Adopt, adapt, abandon? 2 3 4 5 6 7 8 9 10 Data Collection on a Run Chart Distance (M) 1 25 20 15 10 5 1 2 3 4 5 PDSA Test Cycle 6 7 8 9 10

PDSA Tracker # # Plan What questions? Theories? Prediction Do Study Act What do you see? How Long? How did what you see match prediction? What now? Adopt, adapt, abandon? 2 3 4 5 6 7 8 9 10 Data Collection on a Run Chart Distance (M) 1 25 20 15 10 5 1 2 3 4 5 PDSA Test Cycle 6 7 8 9 10

Let’s Play!

Discussion What did you learn about rapid-cycle change projects?
- Slides: 26