
Le changement du paradigme nergtique avec les nergies
- Slides: 12
Le changement du paradigme énergétique avec les énergies renouvelables variables Professor Jan Horst Keppler Scientific Director, Chaire European Electricity Markets Université Paris-Dauphine CIRED, 22 octobre 2013 1
Key Issues The influx of significant amounts of intermittent renewables (wind, solar) creates two sets of interacting issues: 1. The increasing disconnect of wholesale prices and costs (private and social) Ø Issues are declining average prices, increased volatility, decreasing load factors (the disappearance of baseload) and profitability for conventional production, capacity reductions and investment delays, tension on the security of supply and the increasingly recognised need for capacity remuneration mechanisms (CRMs) and demand management (load shifting). 2. The declining integrity of established market areas Ø Issues are internal congestion with de facto regional market areas, spill-overs into neighbouring markets, more frequent saturation of interconnections, decreasing price convergence. Together, the two sets of issues demand an in-depth discussion of the overall market architecture for European electricity for the next five years in parallel to further geographic integration. At stake is ultimately the claim that well functioning electricity markets are the most efficient manner to ensure least-cost pricing and adequate investment. 2
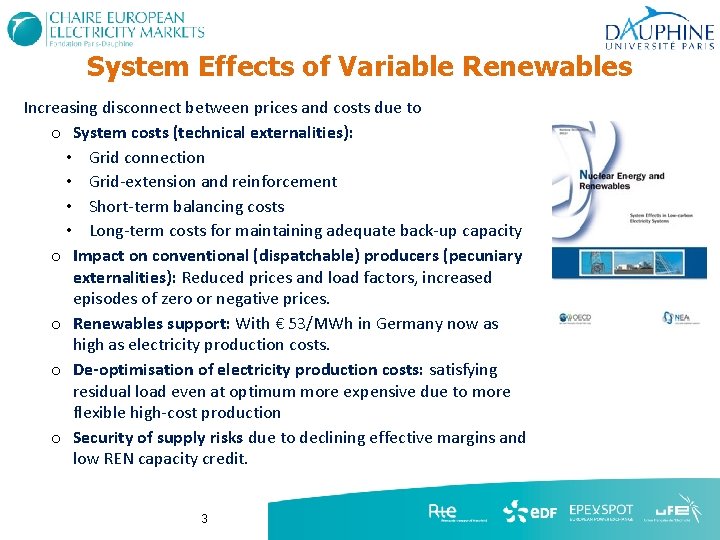
System Effects of Variable Renewables Increasing disconnect between prices and costs due to o System costs (technical externalities): • Grid connection • Grid-extension and reinforcement • Short-term balancing costs • Long-term costs for maintaining adequate back-up capacity o Impact on conventional (dispatchable) producers (pecuniary externalities): Reduced prices and load factors, increased episodes of zero or negative prices. o Renewables support: With € 53/MWh in Germany now as high as electricity production costs. o De-optimisation of electricity production costs: satisfying residual load even at optimum more expensive due to more flexible high-cost production o Security of supply risks due to declining effective margins and low REN capacity credit. 3
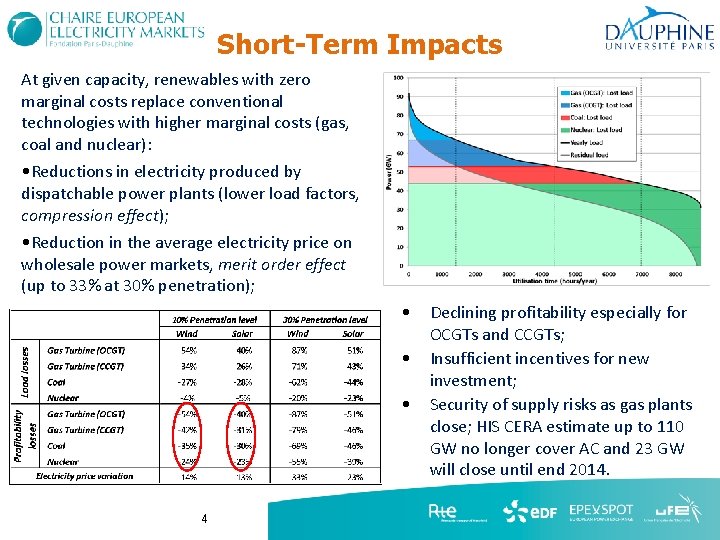
Short-Term Impacts At given capacity, renewables with zero marginal costs replace conventional technologies with higher marginal costs (gas, coal and nuclear): • Reductions in electricity produced by dispatchable power plants (lower load factors, compression effect); • Reduction in the average electricity price on wholesale power markets, merit order effect (up to 33% at 30% penetration); • • • 4 Declining profitability especially for OCGTs and CCGTs; Insufficient incentives for new investment; Security of supply risks as gas plants close; HIS CERA estimate up to 110 GW no longer cover AC and 23 GW will close until end 2014.
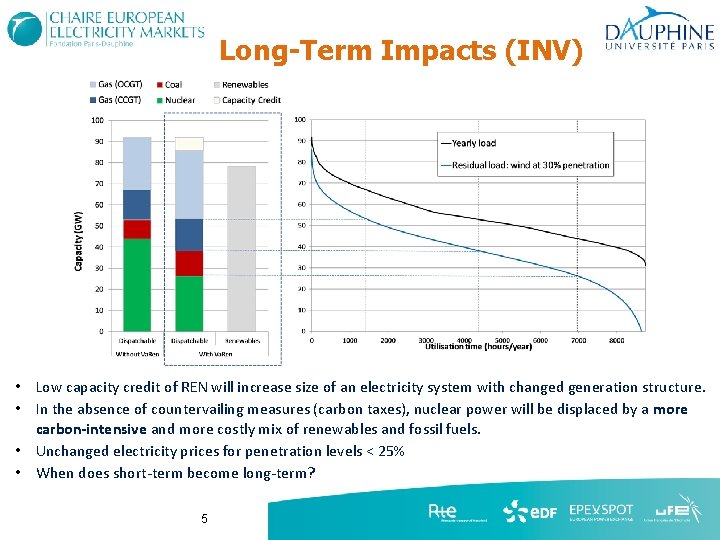
Long-Term Impacts (INV) • Low capacity credit of REN will increase size of an electricity system with changed generation structure. • In the absence of countervailing measures (carbon taxes), nuclear power will be displaced by a more carbon-intensive and more costly mix of renewables and fossil fuels. • Unchanged electricity prices for penetration levels < 25% • When does short-term become long-term? 5
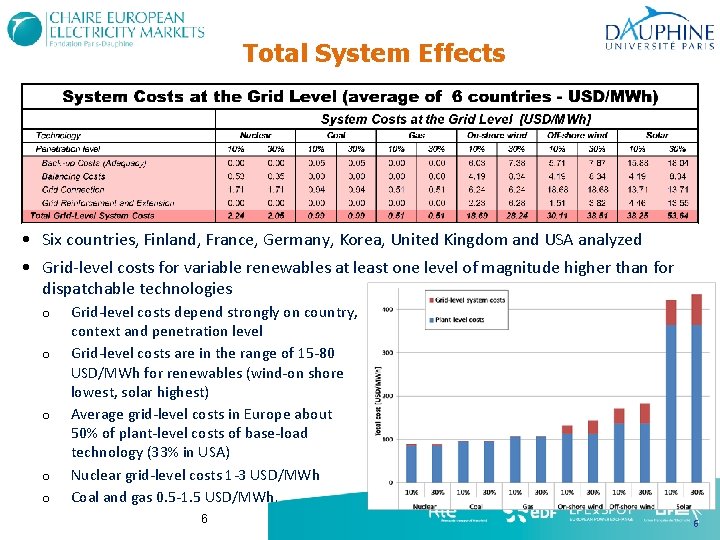
Total System Effects • Six countries, Finland, France, Germany, Korea, United Kingdom and USA analyzed • Grid-level costs for variable renewables at least one level of magnitude higher than for dispatchable technologies o o o Grid-level costs depend strongly on country, context and penetration level Grid-level costs are in the range of 15 -80 USD/MWh for renewables (wind-on shore lowest, solar highest) Average grid-level costs in Europe about 50% of plant-level costs of base-load technology (33% in USA) Nuclear grid-level costs 1 -3 USD/MWh Coal and gas 0. 5 -1. 5 USD/MWh. 6 6
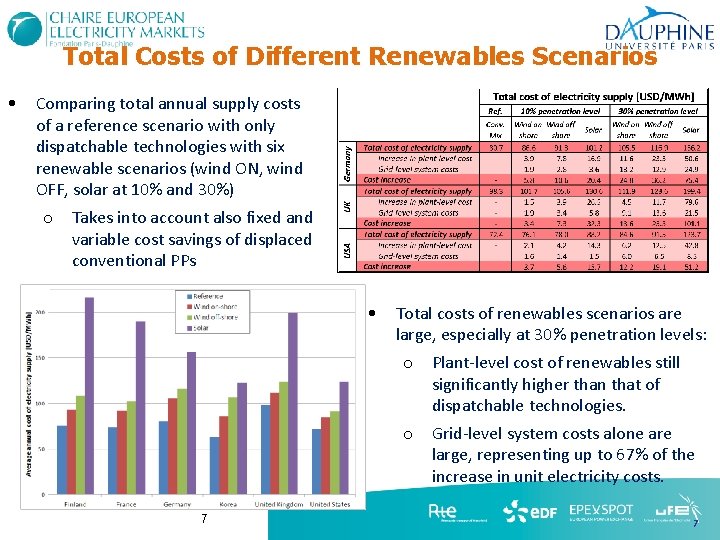
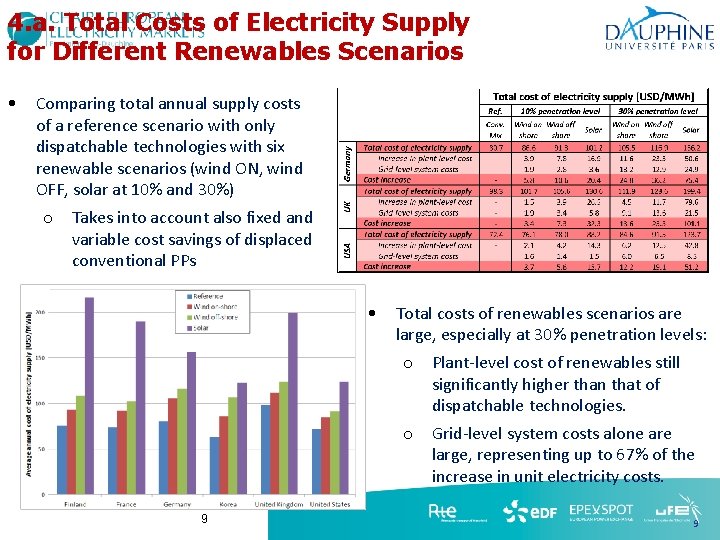
Total Costs of Different Renewables Scenarios • Comparing total annual supply costs of a reference scenario with only dispatchable technologies with six renewable scenarios (wind ON, wind OFF, solar at 10% and 30%) o Takes into account also fixed and variable cost savings of displaced conventional PPs • Total costs of renewables scenarios are large, especially at 30% penetration levels: o Plant-level cost of renewables still significantly higher than that of dispatchable technologies. o Grid-level system costs alone are large, representing up to 67% of the increase in unit electricity costs. 7 7
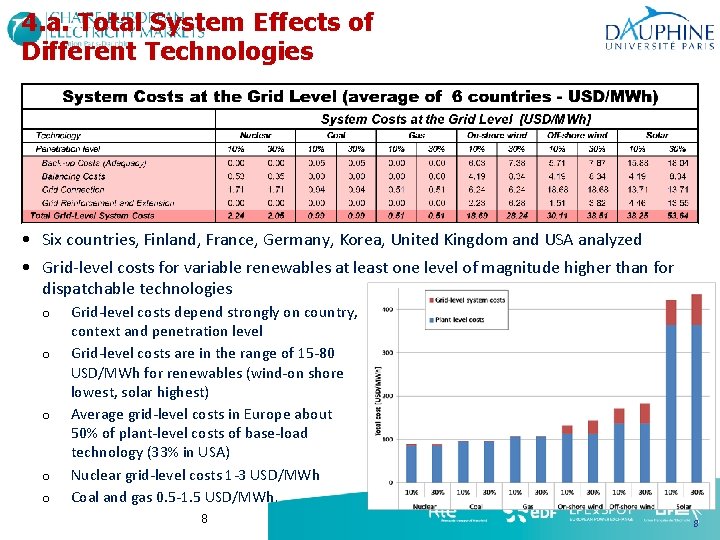
4. a. Total System Effects of Different Technologies • Six countries, Finland, France, Germany, Korea, United Kingdom and USA analyzed • Grid-level costs for variable renewables at least one level of magnitude higher than for dispatchable technologies o o o Grid-level costs depend strongly on country, context and penetration level Grid-level costs are in the range of 15 -80 USD/MWh for renewables (wind-on shore lowest, solar highest) Average grid-level costs in Europe about 50% of plant-level costs of base-load technology (33% in USA) Nuclear grid-level costs 1 -3 USD/MWh Coal and gas 0. 5 -1. 5 USD/MWh. 8 8
4. a. Total Costs of Electricity Supply for Different Renewables Scenarios • Comparing total annual supply costs of a reference scenario with only dispatchable technologies with six renewable scenarios (wind ON, wind OFF, solar at 10% and 30%) o Takes into account also fixed and variable cost savings of displaced conventional PPs • Total costs of renewables scenarios are large, especially at 30% penetration levels: o Plant-level cost of renewables still significantly higher than that of dispatchable technologies. o Grid-level system costs alone are large, representing up to 67% of the increase in unit electricity costs. 9 9
The Investment Challenge • Increasing tension between privately and socially optimal levels of capacity as objective functions (profitability vs. security of supply even under improbable circumstances) are not the same; • Balancing markets and Intraday markets necessary but insufficient as volatile shortterm signals do not aggregate into long-term investment signal for risk-averse investors; • Capacity remuneration mechanisms (CRMs) are a logical answer but leave many questions unresolved: Definite theoretical case still needs to be made Impact on energy-only markets? What is the difference between a flexibility product and a capacity product? Which role for demand-side management, load-shifting and energy efficiency (risk of partial market by-pass – Voltalis)? Ø Vastly different national schemes under way (e. g. capacity obligations in France vs. strategic reserves in Germany) Ø Fears of free-riding require coordination (fast) but not harmonization (unrealistic) Ø CEEM international conference on 16 April, Université Paris–Dauphine. Ø Ø 10
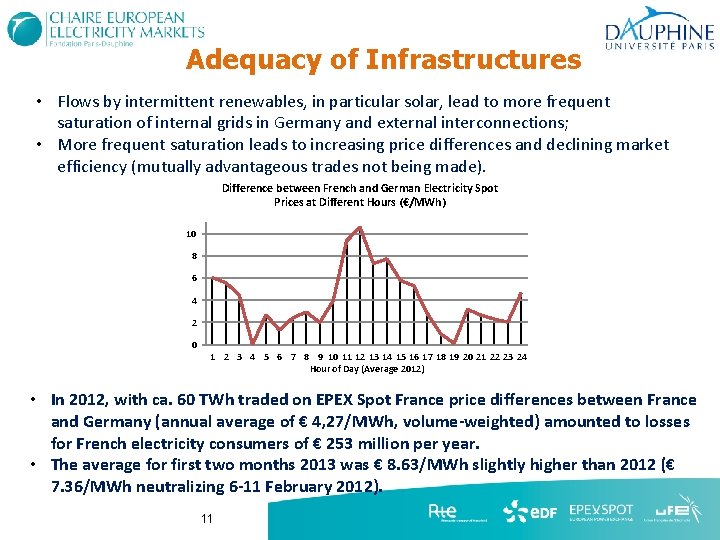
Adequacy of Infrastructures • Flows by intermittent renewables, in particular solar, lead to more frequent saturation of internal grids in Germany and external interconnections; • More frequent saturation leads to increasing price differences and declining market efficiency (mutually advantageous trades not being made). Difference between French and German Electricity Spot Prices at Different Hours (€/MWh) 10 8 6 4 2 0 1 2 3 4 5 6 7 8 9 10 11 12 13 14 15 16 17 18 19 20 21 22 23 24 Hour of Day (Average 2012) • In 2012, with ca. 60 TWh traded on EPEX Spot France price differences between France and Germany (annual average of € 4, 27/MWh, volume-weighted) amounted to losses for French electricity consumers of € 253 million per year. • The average for first two months 2013 was € 8. 63/MWh slightly higher than 2012 (€ 7. 36/MWh neutralizing 6 -11 February 2012). 11
Conclusion Issues highlighted not only offer challenges but also opportunities: 1. The increasing disconnect of wholesale prices and costs (private and social) Ø The need for new flexibility and capacity instruments allowing for the integration of shortterm demand-side and (perhaps) energy efficiency measures. Intraday development step in the right direction but may not be enough (specific demand-side products? ). 2. The declining integrity of established market areas Ø Better management of existing infrastructures (flow-based mechanism); linking of capacity markets may require return to reserved capacity or priority dispatch; more attention and better communication on the need for adequate investment in new transport infrastructures (internal and external). Awareness is increasing and discussions are under way, much of it however in a piecemeal manner looking for quick fixes and stop-gaps. Overall understanding of new needs of electricity market participants, producers and customers, as well as fast-changing business models in the new environment will be key to success. 12