LDA Ensembles for Interactive Exploration and Categorization of

LDA Ensembles for Interactive Exploration and Categorization of Behaviors Siming Chen 1, 2, Nathalia Andrienko 1, 3, Gennady Andrienko 1, 3, Linara Adilova 1, Jeremie Barlet 4, Joerg Kindermann 1, Phong. H Nguyen 3, Olivier Thonnard 4, Cagatay Turkay 3 1) 2) 3) 4) Fraunhofer IAIS, Germany Bonn University, Germany City University, London, UK Amadeus, France

Problem Statement • Behaviors: a set of actions performed by some agent during a period of time • Analyzing a large collection of behaviors by multiple agents • Identifying typical behaviors • Spotting behavior anomalies. • Identifying behavior types is challenging • A variety of actions with different frequency • It’s not easy to define ‘behavior patterns’

Approach – LDA Ensembles • We propose an approach leveraging topic modeling techniques -- LDA (Latent Dirichlet Allocation) • Representing categories of typical behaviors by topics obtained through applying topic modeling to behaviors.

Approach – LDA Ensembles • Ensembles of topic models • Topic modeling requires setting the number of topics • Directly setting an ‘appropriate’ number of topic is challenging • Many topic modeling algorithms are non-deterministic and produce slightly different results in each run even if the number of topics is the same • With ensembles, users can decide about the target number based on topics distribution after multiple LDA runs

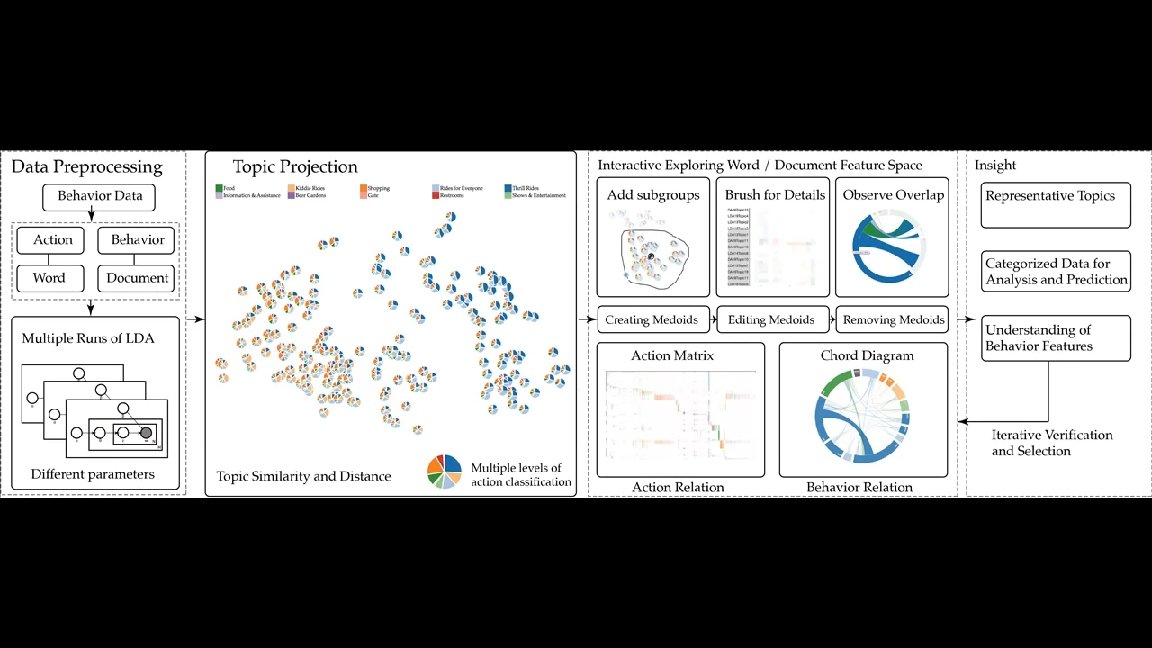
Topics Distribution Actions Class Selected Topics Overlapping View Topic-Action Matrix

Visual Analytics Interface • Topic Projection • Showing similarity and distribution • Enabling interactive selection • Topic-Action Matrix • Showing the Relationship of topic and actions • Supporting Ranking and sorting • Selected Topic Chord View • Showing the overlapping based on the similarity of belonging sessions

Visual Analytics Workflow We run multiple rounds of LDA, and generate all the topics as input for visual analytics • Users can interactively select representative topics and modify the selection after understanding the topic features, their capabilities to differentiate behaviors, and the coverage of the behavior set. •
: Topic Selection • Glyph encoding • Percentage of action classes •")
Analytic Process (1): Topic Selection • Glyph encoding • Percentage of action classes • Defining topic groups • Brushing the regions • Click and add similar candidates • Selecting the representative • The Medoid of the group
: Topic editing / updating/ removing • (a) Original selected topic groups,")
Analytic Process (2): Topic editing / updating/ removing • (a) Original selected topic groups, (b) Updated topic group, (c) Matrix visualization, (d) Detailed matrix by interactive zooming
: Multiple-level of Exploration • Multiple level of exploration • Drilling down")
Analytic Process (3): Multiple-level of Exploration • Multiple level of exploration • Drilling down to specific action classes • Showing the details of the action distributions
: Iterative Exploration • Refinement by examining the duplication of representatives of")
Analytic Process (4): Iterative Exploration • Refinement by examining the duplication of representatives of topics • Distinctiveness • Coverage of behaviors • Patterns of action probability distributions

Expert Evaluation The software is open sourced and deployed in Collaborators’ platform • Their feedbacks of the interviews are positive • • Selected topics represent behaviors of interest well • Typical behaviors can be identified as ‘normal’ • Atypical behaviors can be identified as ‘anomaly’

Further Collaborations and Future Work VASABI: Doing User Behaviour Analytics through Interactive Visual Hierarchical User Profiles (J) Authors: Phong H. Nguyen, Rafael Henkin, Siming Chen, Natalia Andrienko, Gennady Andrienko, Olivier Thonnard, Cagatay Turkay

• Thank you http: //simingchen. me • http: //geoanalytics. net/and/ •
- Slides: 15