
Lawrence Park Capital Partners Credit Strategies Fund June


- Slides: 27
Lawrence Park Capital Partners Credit Strategies Fund June 2014
Disclaimer THIS SUMMARY HAS BEEN PREPARED FOR INFORMATIONAL PURPOSES ONLY, SOLELY AS A PRELIMINARY DOCUMENT TO DETERMINE INVESTOR INTEREST REGARDING LAWRENCE PARK CREDIT STRATEGIES FUND (THE “FUND”), WHICH IS DESCRIBED HEREIN. EXCEPT AS OTHERWISE DESCRIBED IN THE FUND’S CONFIDENTIAL PRIVATE PLACEMENT MEMORANDUM (THE “PPM”), DATED March 3, 2014, THIS DOCUMENT MAY NOT BE REPRODUCED FOR ANY PURPOSE OR PROVIDED TO OTHERS IN WHOLE OR IN PART WITHOUT THE PRIOR WRITTEN PERMISSION OF THE FUND MANAGER OF THE FUND (THE “FUND MANAGER”). AN OFFER OR SOLICITATION WILL BE MADE ONLY THROUGH THE PPM, AND WILL BE SUBJECT TO THE TERMS AND CONDITIONS CONTAINED IN THE PPM. THIS SUMMARY DOES NOT CONSTITUTE AN OFFER TO SELL OR BUY ANY SECURITIES. THE INFORMATION SET FORTH HEREIN DOES NOT PURPORT TO BE COMPLETE AND IS INTENDED TO BE READ IN CONJUNCTION WITH THE PPM. ALL INFORMATION AND OPINIONS AS WELL AS ANY FIGURES INDICATED HEREIN ARE SUBJECT TO CHANGE WITHOUT NOTICE. THE INVESTMENT RATES OF RETURN SET FORTH HEREIN DO NOT REFLECT MANAGEMENT FEES, EXPENSES OR CARRIED INTEREST TO BE CHARGED BY THE FUND MANAGER. THIS PRODUCT WILL BE AVAILABLE TO ACCREDITED INVESTORS AS THAT TERM IS DEFINED UNDER CANADIAN SECURITIES LEGISLATION. IN ONTARIO, IN ORDER FOR INVESTORS TO BE CONSIDERED ACCREDITED INVESTORS, INVESTORS MUST MEET CERTAIN ELIGIBILITY REQUIREMENTS WITH REGARDS TO FINANCIAL ASSETS AND/OR INCOME HISTORY. AN INVESTMENT IN THE FUND WILL INVOLVE SIGNIFICANT RISKS DUE, AMONG OTHER THINGS, TO THE NATURE OF THE FUND’S INVESTMENTS. THE RISK FACTORS WILL BE CONTAINED IN THE PPM. INVESTORS SHOULD HAVE THE FINANCIAL ABILITY AND WILLINGNESS TO ACCEPT RISKS WHICH ARE CHARACTERISTIC OF THE INVESTMENTS DESCRIBED HEREIN. THIS PRESENTATION DOES NOT CONSIDER THE SPECIFIC INVESTMENT OBJECTIVES, FINANCIAL SITUATION OR PARTICULAR NEEDS OF ANY RECIPIENT. NO ASSURANCE CAN BE GIVEN THAT THE FUND’S INVESTMENT OBJECTIVE WILL BE ACHIEVED OR THAT THE INVESTORS WILL RECEIVE A RETURN OF THEIR CAPITAL. ACCORDINGLY, THE PPM SHOULD BE READ IN ITS ENTIRETY AND REVIEWED BY POTENTIAL INVESTORS’ LEGAL AND FINANCIAL ADVISORS. CONFIDENTIAL 2
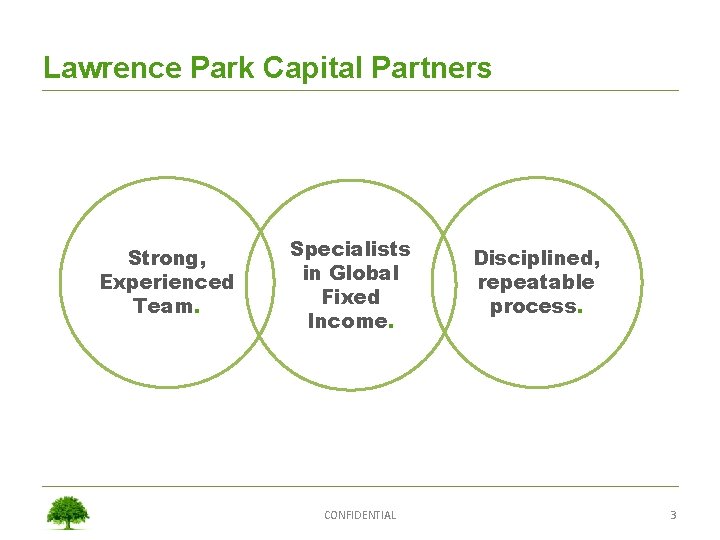
Lawrence Park Capital Partners Strong, Experienced Team. Specialists in Global Fixed Income. CONFIDENTIAL Disciplined, repeatable process. 3
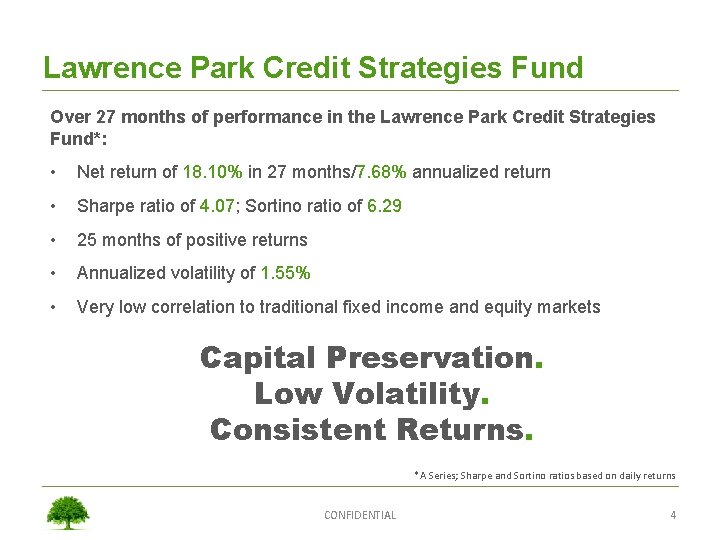
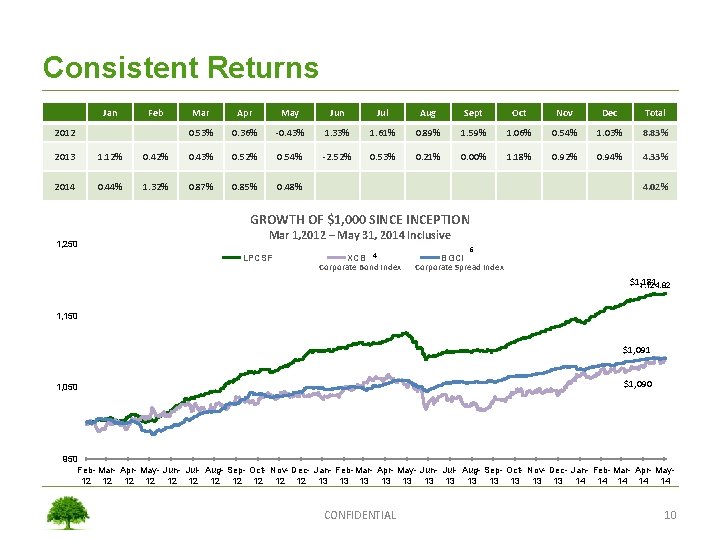
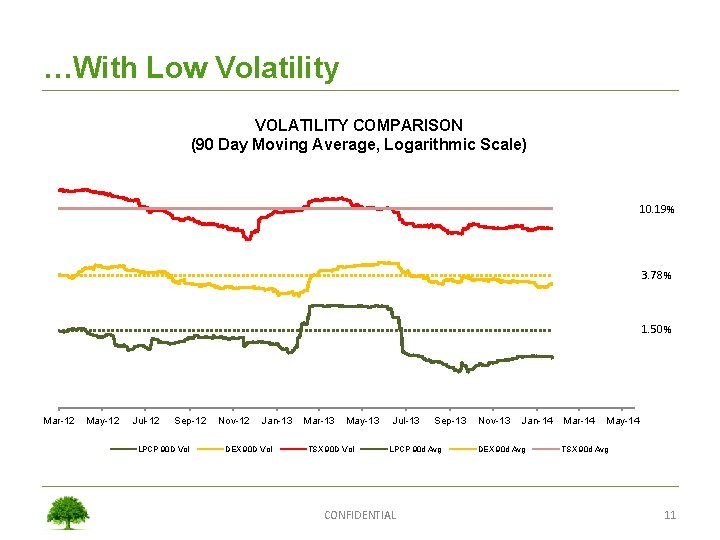
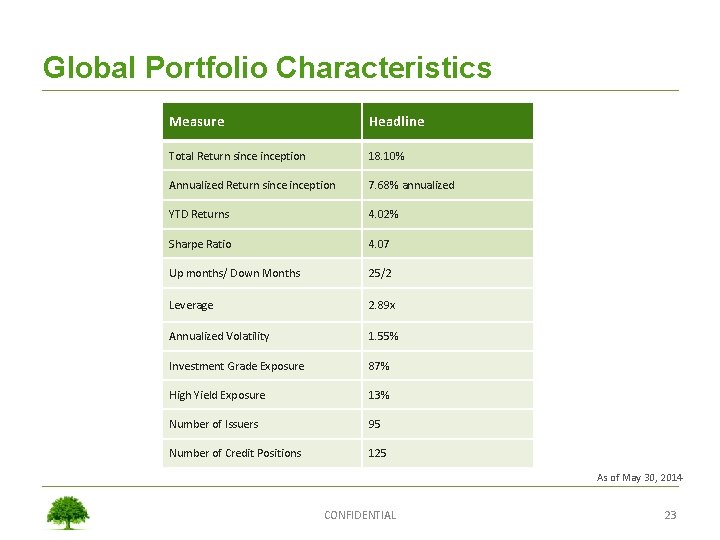
Lawrence Park Credit Strategies Fund Over 27 months of performance in the Lawrence Park Credit Strategies Fund*: • Net return of 18. 10% in 27 months/7. 68% annualized return • Sharpe ratio of 4. 07; Sortino ratio of 6. 29 • 25 months of positive returns • Annualized volatility of 1. 55% • Very low correlation to traditional fixed income and equity markets Capital Preservation. Low Volatility. Consistent Returns. *A Series; Sharpe and Sortino ratios based on daily returns CONFIDENTIAL 4
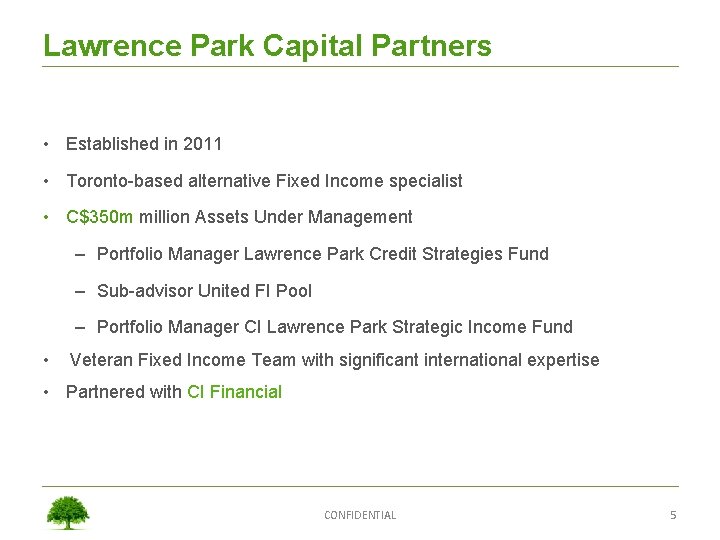
Lawrence Park Capital Partners • Established in 2011 • Toronto-based alternative Fixed Income specialist • C$350 m million Assets Under Management – Portfolio Manager Lawrence Park Credit Strategies Fund – Sub-advisor United FI Pool – Portfolio Manager CI Lawrence Park Strategic Income Fund • Veteran Fixed Income Team with significant international expertise • Partnered with CI Financial CONFIDENTIAL 5
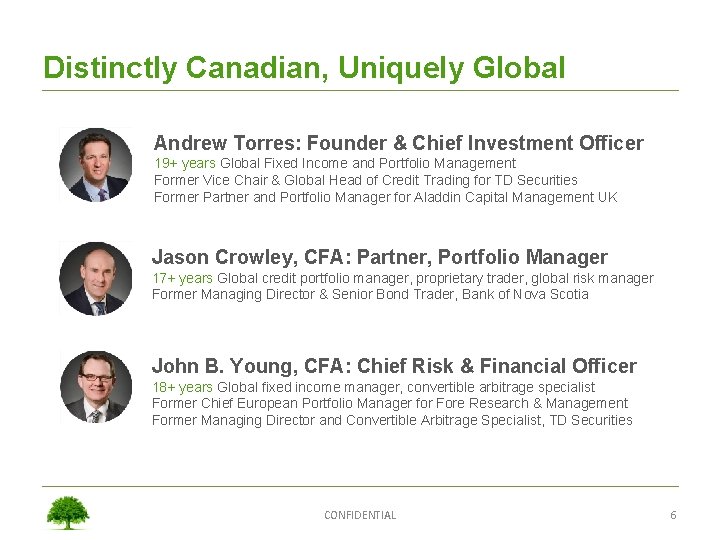
Distinctly Canadian, Uniquely Global Andrew Torres: Founder & Chief Investment Officer 19+ years Global Fixed Income and Portfolio Management Former Vice Chair & Global Head of Credit Trading for TD Securities Former Partner and Portfolio Manager for Aladdin Capital Management UK Jason Crowley, CFA: Partner, Portfolio Manager 17+ years Global credit portfolio manager, proprietary trader, global risk manager Former Managing Director & Senior Bond Trader, Bank of Nova Scotia John B. Young, CFA: Chief Risk & Financial Officer 18+ years Global fixed income manager, convertible arbitrage specialist Former Chief European Portfolio Manager for Fore Research & Management Former Managing Director and Convertible Arbitrage Specialist, TD Securities CONFIDENTIAL 6
A Solid, Seasoned, and Professional Team • Partners and staff combine for over 70 years experience trading, structuring, and building fixed income credit businesses globally • • • Established investment strategy honed over two decades managing multi-billion dollar portfolios Proprietary investment strategies employed using bank capital Senior partners bring extensive experience from major global financial centres: London, New York, and Toronto • • First hand knowledge and understanding of the nuances of each market/region Experience evaluating and hedging credit opportunities across multiple currencies and markets Extensive long-standing relationships with sell side community Daily insight into the inventories and axes of 42 global bond dealer and broker desks CONFIDENTIAL 7
The Lawrence Park Approach • Process • • Foundation • • • Identify bonds which have become dislocated from normal pricing relationships, taking advantage of market inefficiencies and changes in investor sentiment Focus on investment grade corporate bonds, which offer greater liquidity and are more resilient in times of market stress Hedge out interest rate risk and currency risks, significantly reducing Fund volatility Nimble, mean reversion approach to trading Technical based screening analysis with in-depth fundamental overlay Active trading strategy with timely profit taking and redeployment of capital Low exposure to interest rate moves Disciplined trading governed by strong risk metrics/controls Results • • Target net annual returns of 6 -10% Low volatility: low correlation to traditional asset classes: superior risk-adjusted returns. CONFIDENTIAL 8
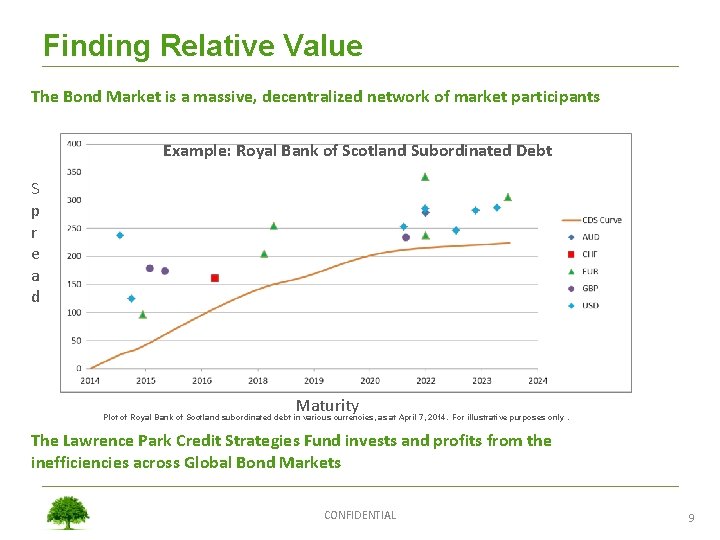
Finding Relative Value The Bond Market is a massive, decentralized network of market participants Example: Royal Bank of Scotland Subordinated Debt S p r e a d Maturity Plot of Royal Bank of Scotland subordinated debt in various currencies, as at April 7, 2014. For illustrative purposes only. The Lawrence Park Credit Strategies Fund invests and profits from the inefficiencies across Global Bond Markets CONFIDENTIAL 9
Consistent Returns Jan Feb 2012 Mar Apr May Jun Jul Aug Sept Oct Nov Dec Total 0. 53% 0. 36% -0. 43% 1. 33% 1. 61% 0. 89% 1. 59% 1. 06% 0. 54% 1. 03% 8. 83% -2. 52% 0. 53% 0. 21% 0. 00% 1. 18% 0. 92% 0. 94% 4. 33% 2013 1. 12% 0. 43% 0. 52% 0. 54% 2014 0. 44% 1. 32% 0. 87% 0. 85% 0. 48% 4. 02% GROWTH OF $1, 000 SINCEPTION 1, 250 Mar 1, 2012 – May 31, 2014 Inclusive LPCSF XCB 4 Corporate Bond Index 6 BGCI Corporate Spread Index $1, 181 1, 124. 82 1, 150 $1, 091 $1, 090 1, 050 950 Feb- Mar- Apr- May- Jun- Jul- Aug- Sep- Oct- Nov- Dec- Jan- Feb- Mar- Apr- May 12 12 12 13 13 13 14 14 14 CONFIDENTIAL 10
…With Low Volatility VOLATILITY COMPARISON (90 Day Moving Average, Logarithmic Scale) 10. 19% 3. 78% 1. 50% Mar-12 May-12 Jul-12 Sep-12 LPCP 90 D Vol Nov-12 Jan-13 DEX 90 D Vol Mar-13 May-13 TSX 90 D Vol Jul-13 Sep-13 LPCP 90 d Avg CONFIDENTIAL Nov-13 Jan-14 DEX 90 d Avg Mar-14 May-14 TSX 90 d Avg 11
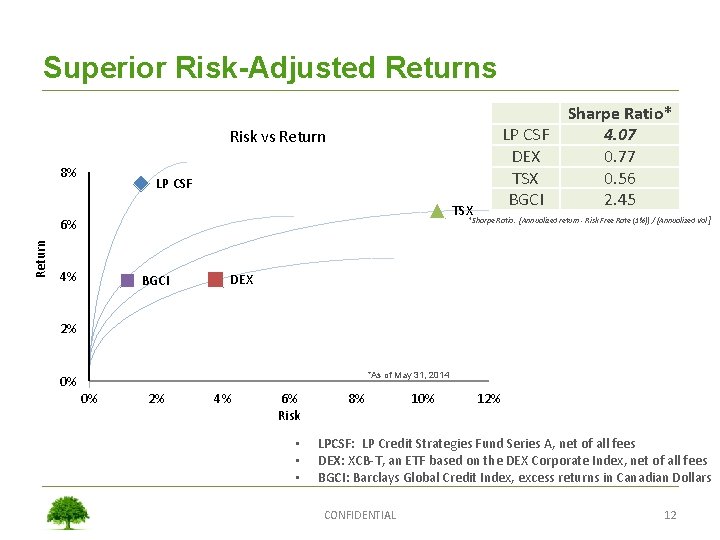
Superior Risk-Adjusted Returns LP CSF DEX TSX BGCI Risk vs Return 8% LP CSF TSX *Sharpe Ratio: [Annualized return - Risk Free Rate (1%)] / [Annualized Vol ] 6% Return Sharpe Ratio* 4. 07 0. 77 0. 56 2. 45 4% BGCI DEX 2% *As of May 31, 2014 0% 0% 2% 4% 6% Risk • • • 8% 10% 12% LPCSF: LP Credit Strategies Fund Series A, net of all fees DEX: XCB-T, an ETF based on the DEX Corporate Index, net of all fees BGCI: Barclays Global Credit Index, excess returns in Canadian Dollars CONFIDENTIAL 12
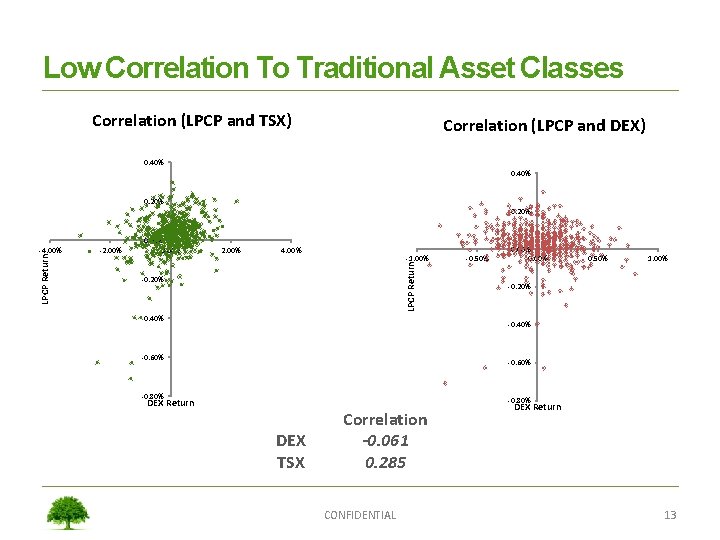
Low Correlation To Traditional Asset Classes Correlation (LPCP and TSX) Correlation (LPCP and DEX) 0. 40% 0. 20% -2. 00% 0. 00% 2. 00% 4. 00% -1. 00% LPCP Return -4. 00% 0. 20% -0. 40% 0. 00% 0. 50% 1. 00% -0. 20% -0. 40% -0. 60% -0. 80% DEX Return -0. 50% -0. 80% DEX TSX Correlation -0. 061 0. 285 CONFIDENTIAL DEX Return 13
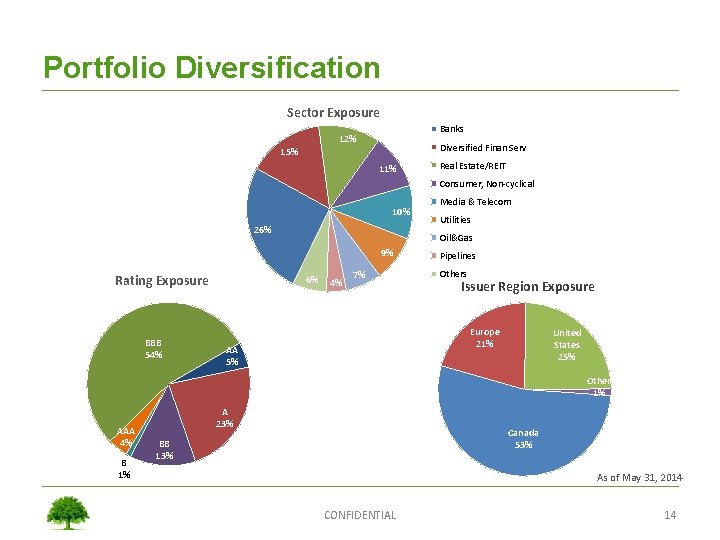
Portfolio Diversification Sector Exposure Banks 12% Diversified Finan Serv 15% 11% Real Estate/REIT Consumer, Non-cyclical 10% 26% BBB 54% Utilities Oil&Gas 9% Rating Exposure Media & Telecom 6% 4% 7% Pipelines Others Issuer Region Exposure Europe 21% AA 5% United States 25% Other 1% AAA 4% B 1% A 23% Canada 53% BB 13% As of May 31, 2014 CONFIDENTIAL 14
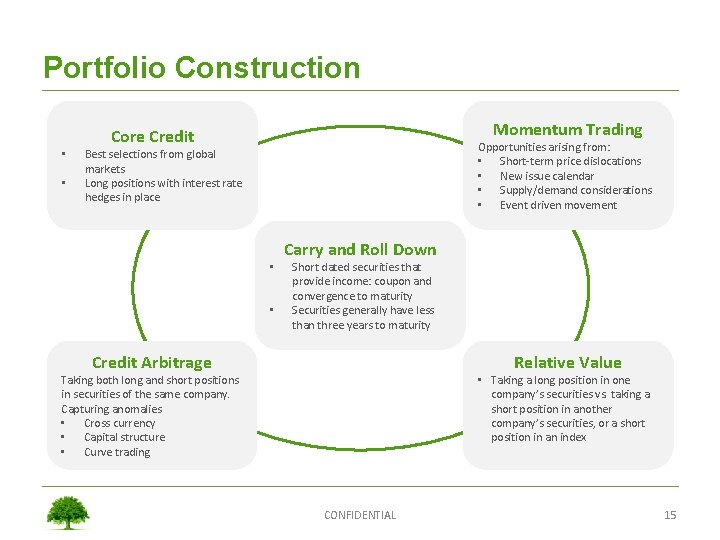
Portfolio Construction • • Momentum Trading Core Credit Opportunities arising from: • Short-term price dislocations • New issue calendar • Supply/demand considerations • Event driven movement Best selections from global markets Long positions with interest rate hedges in place • • Carry and Roll Down Short dated securities that provide income: coupon and convergence to maturity Securities generally have less than three years to maturity Credit Arbitrage Relative Value Taking both long and short positions in securities of the same company. Capturing anomalies • Cross currency • Capital structure • Curve trading • Taking a long position in one company’s securities vs. taking a short position in another company’s securities, or a short position in an index CONFIDENTIAL 15
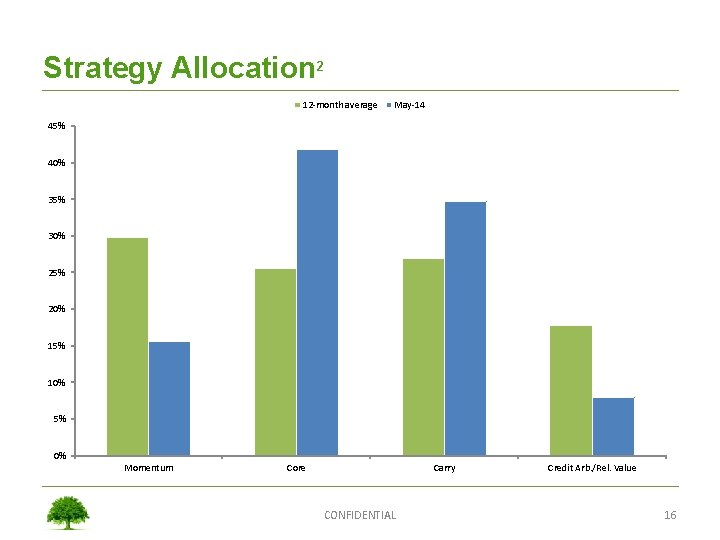
Strategy Allocation 2 12 -month average May-14 45% 40% 35% 30% 25% 20% 15% 10% 5% 0% Momentum Core Carry CONFIDENTIAL Credit Arb. /Rel. Value 16
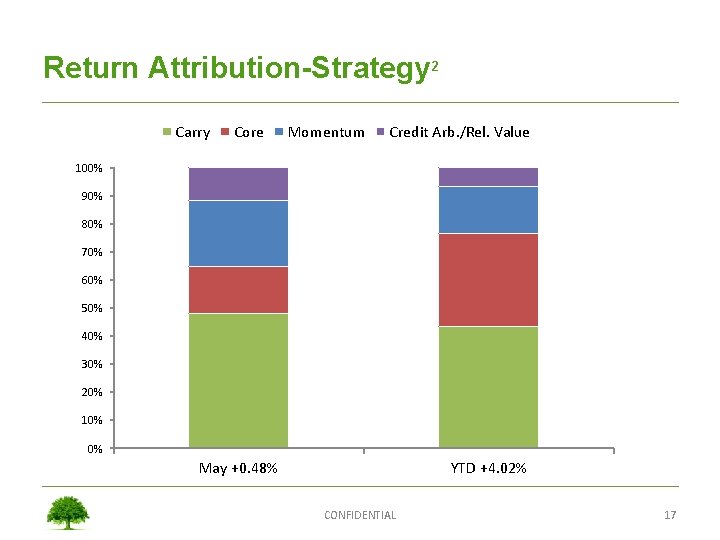
Return Attribution-Strategy 2 Carry Core Momentum Credit Arb. /Rel. Value 100% 90% 80% 70% 60% 50% 40% 30% 20% 10% 0% May +0. 48% YTD +4. 02% CONFIDENTIAL 17
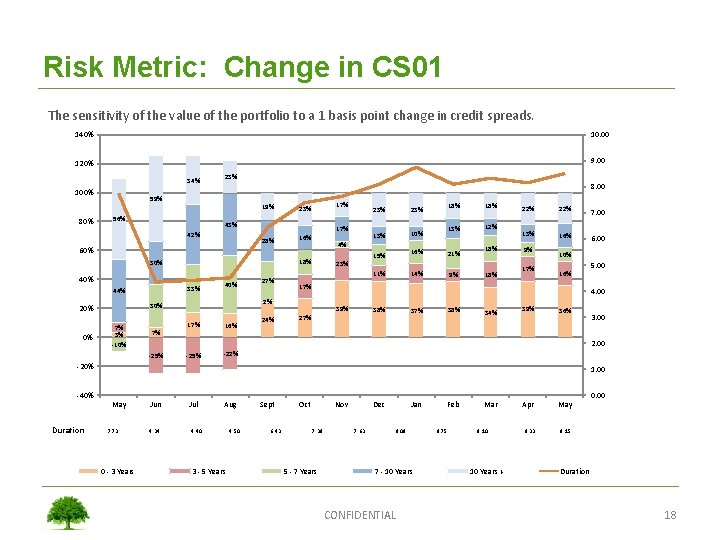
Risk Metric: Change in CS 01 The sensitivity of the value of the portfolio to a 1 basis point change in credit spreads. 140% 10. 00 120% 9. 00 34% 100% 80% 23% 8. 00 59% 19% 56% 17% 23% 42% 28% 17% 16% 33% 44% 7% 3% -10% 7% 27% 16% -25% -22% 24% 10% 16% 18% 13% 12% 21% 18% 23% 14% 11% 9% 18% 22% 13% 16% 9% 17% 6. 00 16% 5. 00 4. 00 39% 38% 27% 38% 37% 34% 39% 36% 3. 00 2. 00 -25% -20% 1. 00 -40% 0. 00 May Duration 7. 00 10% 17% 2% 30% 20% 0% 40% 13% 15% 18% 40% 23% 4% 60% 30% 23% 7. 73 0 - 3 Years Jun 4. 34 Jul Aug 4. 40 3 - 5 Years 4. 50 Sept 6. 43 Oct Nov 7. 39 5 - 7 Years Dec 7. 63 Jan 8. 09 7 - 10 Years CONFIDENTIAL Feb 8. 75 Mar 8. 10 10 Years + Apr May 8. 33 8. 15 Duration 18
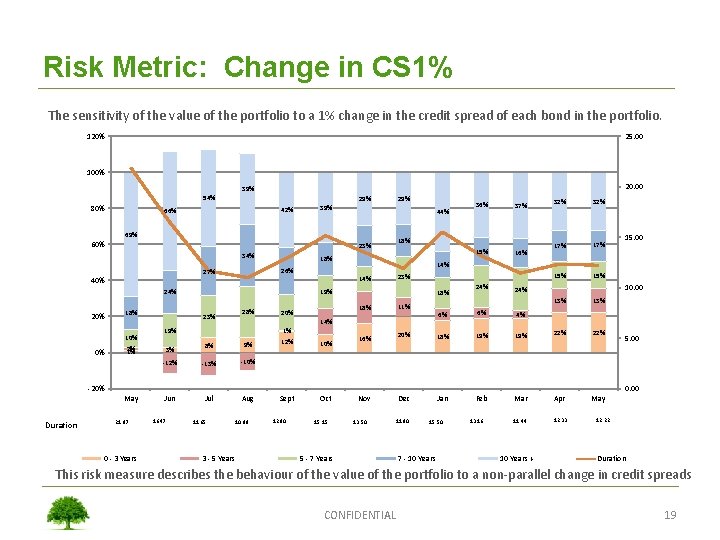
Risk Metric: Change in CS 1% The sensitivity of the value of the portfolio to a 1% change in the credit spread of each bond in the portfolio. 120% 25. 00 100% 20. 00 39% 54% 80% 29% 42% 66% 39% 44% 69% 60% 18% 26% 27% 40% 24% 20% 18% 10% 0% 2% 1% 28% 11% 18% 1% 8% 9% -12% -13% -10% Jun Jul Aug 3% 18% 12% 10% Sept Oct 24% 17% 15% 13% 6% 4% 16% 20% 18% 19% 22% Dec Jan Feb Mar Apr May 11. 44 12. 33 -20% 5. 00 0. 00 May Duration 15. 00 10. 00 6% 14% 19% 16% 23% 14% 20% 15% 32% 14% 19% 23% 37% 18% 23% 34% 36% 32% 21. 87 0 - 3 Years 16. 47 11. 65 10. 99 3 - 5 Years 12. 90 15. 15 Nov 13. 50 11. 90 5 - 7 Years 15. 50 7 - 10 Years 13. 16 10 Years + 12. 22 Duration This risk measure describes the behaviour of the value of the portfolio to a non-parallel change in credit spreads CONFIDENTIAL 19
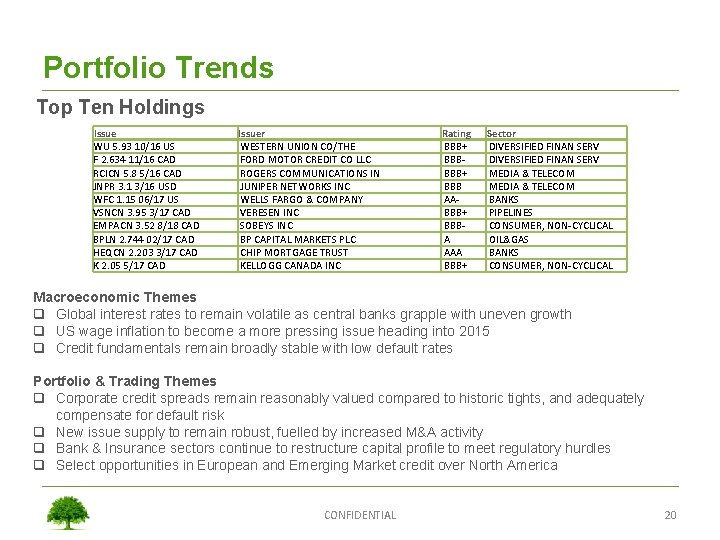
Portfolio Trends Top Ten Holdings Issue WU 5. 93 10/16 US F 2. 634 11/16 CAD RCICN 5. 8 5/16 CAD JNPR 3. 1 3/16 USD WFC 1. 15 06/17 US VSNCN 3. 95 3/17 CAD EMPACN 3. 52 8/18 CAD BPLN 2. 744 02/17 CAD HEQCN 2. 203 3/17 CAD K 2. 05 5/17 CAD Issuer WESTERN UNION CO/THE FORD MOTOR CREDIT CO LLC ROGERS COMMUNICATIONS IN JUNIPER NETWORKS INC WELLS FARGO & COMPANY VERESEN INC SOBEYS INC BP CAPITAL MARKETS PLC CHIP MORTGAGE TRUST KELLOGG CANADA INC Rating BBB+ BBB- BBB+ BBB AA- BBB+ BBB- A AAA BBB+ Sector DIVERSIFIED FINAN SERV MEDIA & TELECOM BANKS PIPELINES CONSUMER, NON-CYCLICAL OIL&GAS BANKS CONSUMER, NON-CYCLICAL Macroeconomic Themes q Global interest rates to remain volatile as central banks grapple with uneven growth q US wage inflation to become a more pressing issue heading into 2015 q Credit fundamentals remain broadly stable with low default rates Portfolio & Trading Themes q Corporate credit spreads remain reasonably valued compared to historic tights, and adequately compensate for default risk q New issue supply to remain robust, fuelled by increased M&A activity q Bank & Insurance sectors continue to restructure capital profile to meet regulatory hurdles q Select opportunities in European and Emerging Market credit over North America CONFIDENTIAL 20
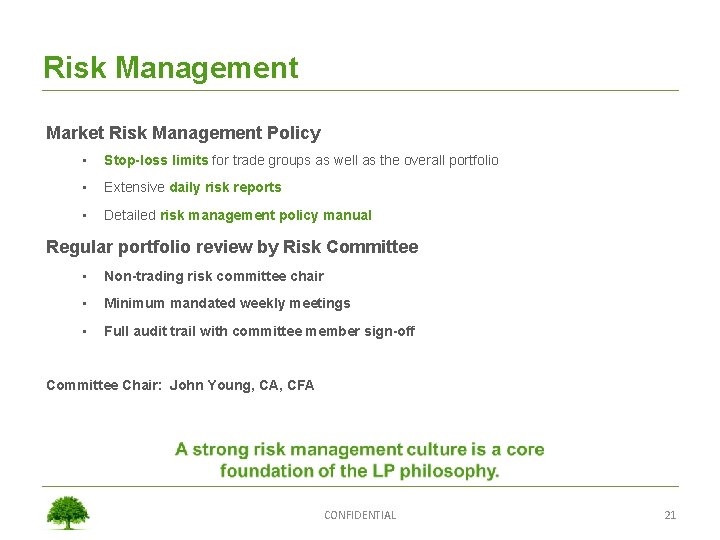
Risk Management Market Risk Management Policy • Stop-loss limits for trade groups as well as the overall portfolio • Extensive daily risk reports • Detailed risk management policy manual Regular portfolio review by Risk Committee • Non-trading risk committee chair • Minimum mandated weekly meetings • Full audit trail with committee member sign-off Committee Chair: John Young, CA, CFA CONFIDENTIAL 21
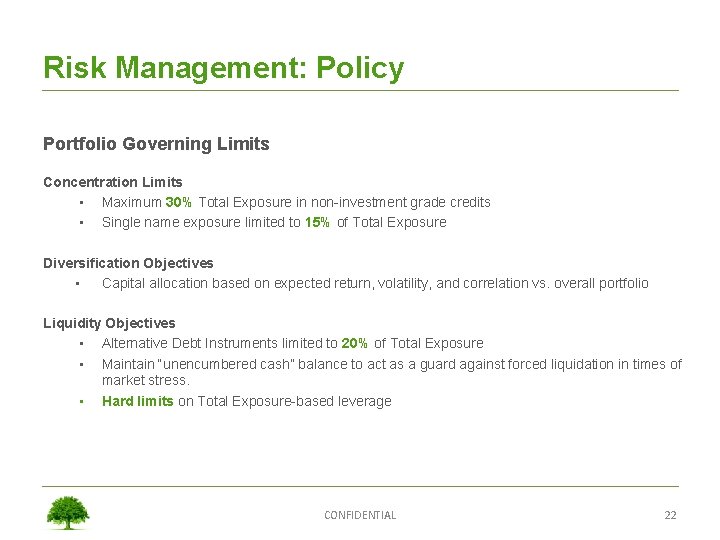
Risk Management: Policy Portfolio Governing Limits Concentration Limits • Maximum 30% Total Exposure in non-investment grade credits • Single name exposure limited to 15% of Total Exposure Diversification Objectives • Capital allocation based on expected return, volatility, and correlation vs. overall portfolio Liquidity Objectives • Alternative Debt Instruments limited to 20% of Total Exposure • Maintain “unencumbered cash” balance to act as a guard against forced liquidation in times of market stress. • Hard limits on Total Exposure-based leverage CONFIDENTIAL 22
Global Portfolio Characteristics Measure Headline Total Return sinception 18. 10% Annualized Return sinception 7. 68% annualized YTD Returns 4. 02% Sharpe Ratio 4. 07 Up months/ Down Months 25/2 Leverage 2. 89 x Annualized Volatility 1. 55% Investment Grade Exposure 87% High Yield Exposure 13% Number of Issuers 95 Number of Credit Positions 125 As of May 30, 2014 CONFIDENTIAL 23
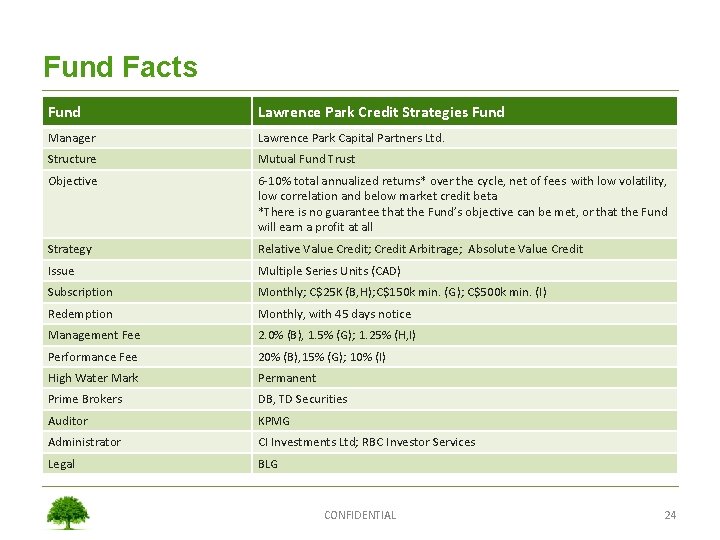
Fund Facts Fund Lawrence Park Credit Strategies Fund Manager Lawrence Park Capital Partners Ltd. Structure Mutual Fund Trust Objective 6 -10% total annualized returns* over the cycle, net of fees with low volatility, low correlation and below market credit beta *There is no guarantee that the Fund’s objective can be met, or that the Fund will earn a profit at all Strategy Relative Value Credit; Credit Arbitrage; Absolute Value Credit Issue Multiple Series Units (CAD) Lawrence Park Credit Strategies Subscription Redemption Fund Monthly; C$25 K (B, H); C$150 k min. (G); C$500 k min. (I) Monthly, with 45 days notice Management Fee 2. 0% (B), 1. 5% (G); 1. 25% (H, I) Performance Fee 20% (B), 15% (G); 10% (I) High Water Mark Permanent Prime Brokers DB, TD Securities Auditor KPMG Administrator CI Investments Ltd; RBC Investor Services Legal BLG CONFIDENTIAL 24
Lawrence Park Team Contact Information The Lawrence Park Credit Strategies Fund is offered to Qualified Investors. Please contact us for full offering documents. Portfolio Management and Trading: CEO/CIO - Andrew C. Torres, BMath PM - Jason Crowley, CFA Trader - Rory Stack, BASc andrew. torres@lpcapitalpartners. com jason. crowley@lpcapitalpartners. com rory. stack@lpcapitalpartners. com Corporate: CFO/CRO/COO - John B. Young, CFA, CA john. young@lpcapitalpartners. com Business Development: Director - Kathleen Biggs kathleen. biggs@lpcapitalpartners. com Operations: Snr. Analyst - Sharon Liu, BMath, MA, CAIA sharon. liu@lpcapitalpartners. com Lawrence Park Capital Partners Ltd. 2 Berkeley Street, Suite 304 Toronto, Ontario M 5 A 4 J 5 (416) 646 -2180 www. lpcapitalpartners. com CONFIDENTIAL 25
Performance And Benchmark Disclaimer 1. All return figures for the Lawrence Park Credit Strategies Fund (the “Fund”) are based on the A Series units and are net of management fees, performance fees, trailing commissions (if any) and Fund expenses. Other series may have higher fees and differing redemption terms. Monthly returns are based on monthly NAV calculations by RBC Investor Services. 2. Strategies a) Momentum Trading –involves taking a long or short position in a security to take advantage of short-term price dislocations b) Outright Credit – involves taking a long or short position in a security based on longer-term value technicals or fundamentals c) Carry and Roll Down – involves levered positions in short dated securities primarily to earn income d) Relative Value – involves taking a long position in one company’s securities vs. taking a short position in another company’s securities, or a short position in an index e) Credit Arbitrage – involves taking both long and short positions in securities of the same company 3. Asset Classes a) CAD IG – Canadian $ Investment Grade Bonds (rated at least BBB- or equivalent by one major rating agency) b) CAD HY – Canadian $ High Yield Bonds (rated no higher than BB+ or equivalent by any major rating agency) c) USD IG - US$ Investment Grade Bonds (rated at least BBB- or equivalent by one major rating agency) d) USD HY - US$ High Yield Bonds (rated no higher than BB+ or equivalent by any major rating agency) e) EUR IG - Euro denominated Grade Bonds (rated at least BBB- or equivalent by one major rating agency) f) EUR HY – Euro denominated High Yield Bonds (rated no higher than BB+ or equivalent by any major rating agency) g) Hybrid and Pref - Capital instruments issued by banks and corporations, typically lower in the capital structure with some equity-like attribute 4. The DEX XCB is an index-based ETF that replicates the DEX Corporate Index, a benchmark index of Canadian Dollar corporate bonds published daily by PC Bond Analytics. The Fund has a high % of its assets in C$ corporate bonds, and thus the DEX Corporate is a relevant index for comparing risk and return in the Fund. The DEX Corporate Index has a high component of interest rate risk, whereas the Fund has a low component of interest rate risk. 5. The TSX is a widely-known equity index of Canadian large-cap companies. It is included for purposes of comparing fund returns and volatility against different asset classes. The Fund invests primarily in debt instruments, and the inclusion of the TSX is not intended to imply that equity indices are an appropriate benchmark for the Fund. 6. BGCI refers to the Barclays Global Corporate Index. Returns for this benchmark are calculated as excess daily returns, or the difference between total returns of the security and an implied Treasury portfolio matching the term-structure profile of that security. Returns are calculated in Canadian dollars, assuming currency exposures on non-Canadian holdings are fully hedged. In the opinion of the portfolio managers, this index represents a valid benchmark for the Credit Strategies Fund on the basis it is a) based on a global portfolio of publically traded corporate bonds, b) expressed in Canadian Dollars, and c) assumes currency and interest rate risk have been hedged from the portfolio. 7. Annualized volatility and Sharpe calculations are based on daily returns sinception, calculated by the Manager. The risk-free rate used for the Sharpe ratio calculation is 1. 00%, approximately equal to the average Canadian 3 month T-bill rate over the past 12 months. All comparisons to the benchmark are sinception of the Fund, March 1, 2012, unless noted otherwise. 8. Ratings and Regional Breakdowns reflect the end of the month portfolio composition on a Total Exposure basis. Total Exposure is equal to the total directional long positions, plus total directional short positions, excluding hedges & cash. Investors should note that because the portfolio is turned over frequently, current composition may differ materially from the numbers stated herein. 9. The Fund’s returns are not guaranteed, its value changes frequently, and past performance may not be repeated. No representations or warranties of any kind are intended or should be inferred with respect to the economic return or the tax consequences from an investment in the Fund. Potential qualified investors should read the Fund’s offering memorandum carefully prior to investing. 10. Investors should note that the Fund utilizes long and short positions in both domestic and international fixed-income products, and may incorporate leverage and derivative overlays. Fund performance may deviate significantly from benchmark indices shown. CONFIDENTIAL 26
THANK YOU CONFIDENTIAL 27