Latest Developments in f MRI Peter A Bandettini

Latest Developments in f. MRI Peter A. Bandettini, Ph. D Unit on Functional Imaging Methods & 3 T Neuroimaging Core Facility Laboratory of Brain and Cognition National Institute of Mental Health

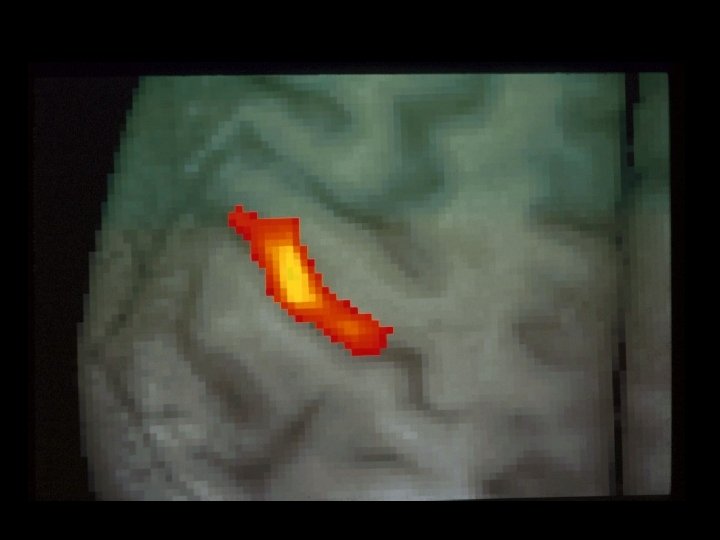
Alternating Left and Right Finger Tapping ~ 1992

The use of f. MRI for the Investigation of Brain Function and Physiology • Where? • When? • How much? • How to get the brain to do what we want it to do in the context of an f. MRI experiment? (limitations: limited time and signal to noise, motion, acoustic noise) • How much more information can we obtain?

A Primary Challenge for Observing Brain Activation: . . . to make progressively more precise inferences without making too many assumptions about non-neuronal physiologic factors.

Neuronal Activation Measured Signal Hemodynamics Noise

Latest Developments… 1. Temporal Resolution 2. Spatial Resolution 3. Sensitivity and Noise 4. Information Content 5. Implementation

Latest Developments… 1. Temporal Resolution 2. Spatial Resolution 3. Sensitivity and Noise 4. Information Content 5. Implementation

Echo-Planar Imaging
 15 20")
1000 msec 100 msec 34 msec 0 5 10 Time (sec) 15 20

Word stem completion

Buckner, R. L, Bandettini, P. A. et al. Detection of cortical activation during averaged single trials of a cognitive task using functional magnetic resonance imaging. Proc. Natl. Acad. Sci. USA 93, 14878 -83 (1996).

Latency Magnitude + 2 sec - 2 sec

Hemi-Field Experiment Right Hemisphere Left Hemisphere 9. 0 seconds 15 seconds 500 msec 10 20 Time (seconds) 30

0 500 ms 10 500 ms 20 30 Right Hemifield Left Hemifield + 2. 5 s 0 s - 2. 5 s - =

11026– 11031 PNAS September 26, 2000 vol. 97 no. 20

Latest Developments… 1. Temporal Resolution 2. Spatial Resolution 3. Sensitivity and Noise 4. Information Content 5. Implementation

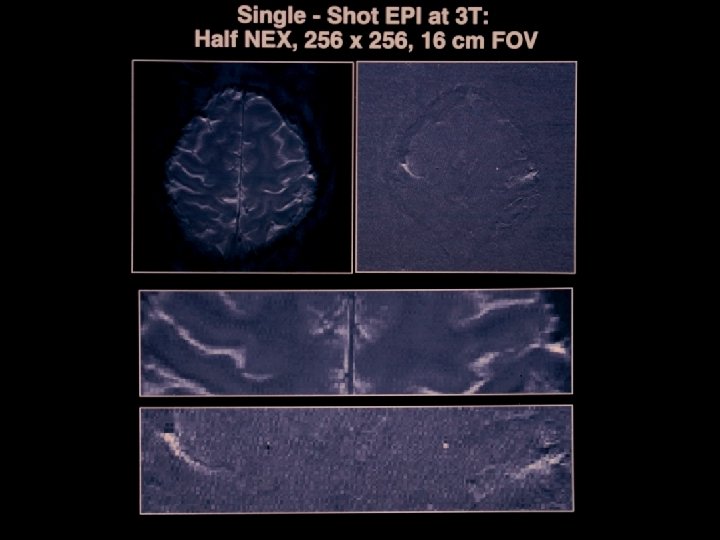
Single Shot Imaging T 2* decay EPI Readout Window ≈ 20 to 40 ms

Multishot Imaging T 2* decay EPI Window 1 T 2* decay EPI Window 2

Multi Shot EPI Excitations Matrix Size 1 64 x 64 2 128 x 128 4 256 x 128 8 256 x 256

Partial k-space imaging T 2* decay EPI Window


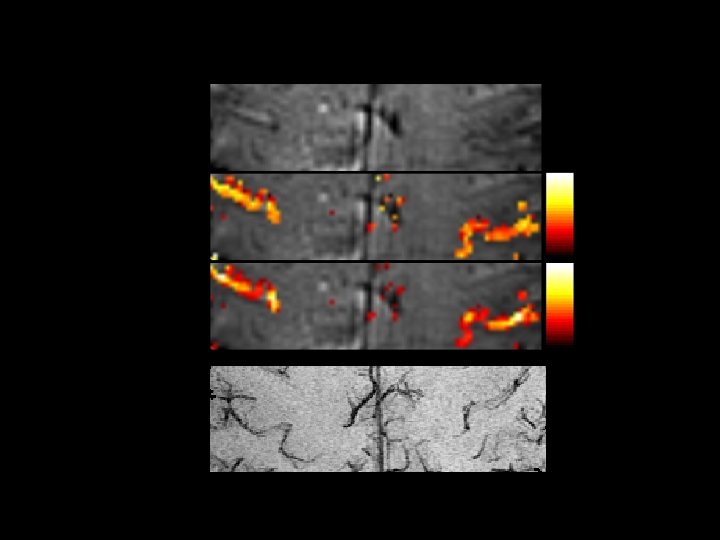
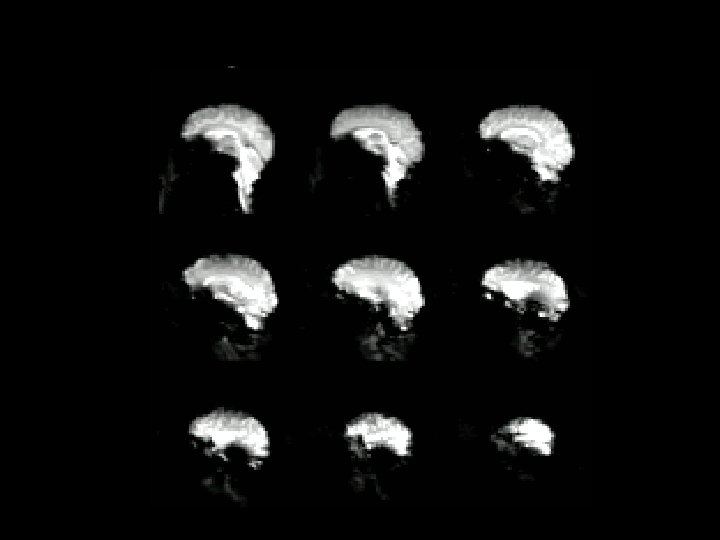
Perfusion BOLD Rest Activation

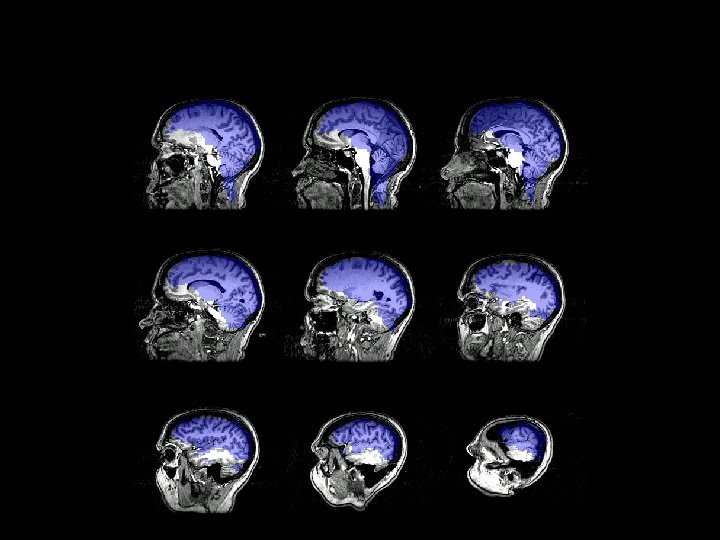
Anatomy BOLD Perfusion
 Venous inflow (Perf. No VN)")
Hemodynamic Specificity Arterial inflow (BOLD TR < 500 ms) Venous inflow (Perf. No VN)

ODC Maps using f. MRI Menon, et al 1 cm calcarine • Identical in size, orientation, and appearance to those obtained by optical imaging 1 and histology 3, 4. 1 Malonek D, Grinvald A. Science 272, 551 -4 (1996). 3 Horton JC, Hocking DR. J Neurosci 16, 7228 -39 (1996). 4 Horton JC, et al. Arch Ophthalmol 108, 1025 -31 (1990).

Latest Developments… 1. Temporal Resolution 2. Spatial Resolution 3. Sensitivity and Noise 4. Information Content 5. Implementation

Temporal S/N vs. Image S/N PHANTOMS SUBJECTS 1400 1000 Temporal S/N 1200 1000 800 600 400 200 400 600 800 Image S/N 1000 1200 1400 0 200 400 600 800 Image S/N N. Petridou 1000

Temporal vs. Image S/N Optimal Resolution Study Human data Petridou et al

Temporal vs. Image S/N Optimal Resolution Study Phantom data Petridou et al

Continuously Growing Activation Area CC Histogram Inflection Point Ziad Saad, et al

Latest Developments… 1. Temporal Resolution 2. Spatial Resolution 3. Sensitivity and Noise 4. Information Content 5. Implementation

Motor Cortex Auditory Cortex Binder, J. R. et al. Cognitive Brain Research 2, 31 -38 (1994). Rao, S. M. et al. J. Cereb. Blood Flow and Metab. 16, 1250 -1254 (1996).

Logothetis et al. Nature, 412, 150 -157

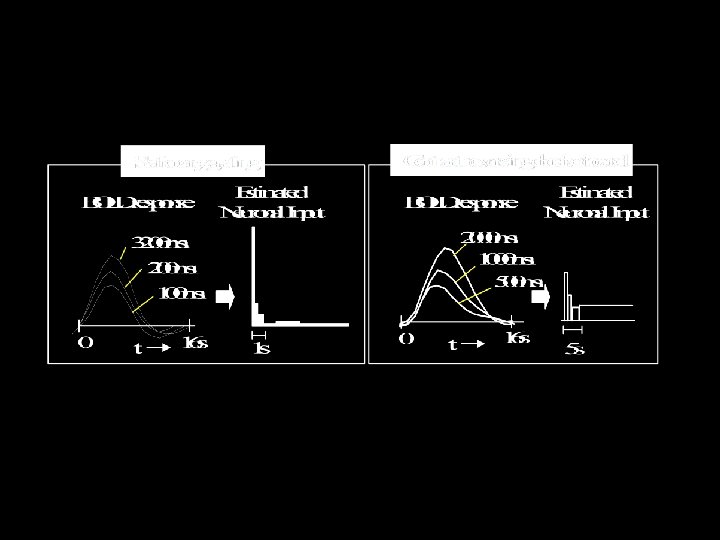
BOLD Response Stimulus timing Signal Different stimulus “ON” periods 0. 25 s linear 0. 5 s measured 1 s 2 s 20 s time (s) Brief stimuli produce larger responses than expected
 6 4 2 0 1 -2 f")
Results – visual task 8 f (SD) 6 4 2 0 1 -2 f (SD) 6 40 4 20 2 4 nonlinearity 6 3 4 5 0 10 20 30 40 8 60 02 2 Stimulus Duration 0 8 -2 1 2 3 4 5 Stimulus Duration

Results – visual task Nonlinearity Magnitude Latency

Different stimulus “OFF” periods BOLD Response Signal measured linear Stimulus timing 2 s 3 s 4 s 8 s 16 s time (s) Brief stimulus OFF periods produce smaller decreases than expected

Sources of this Nonlinearity • Neuronal • Hemodynamic – Oxygen extraction – Blood volume dynamics Oxygen Extraction Flow In Flow Out D Volume

BOLD Correlation with Neuronal Activity Logothetis et al. Nature, 412, 150 -157 Bandettini and Ungerleider, Nature Neuroscience, 4, 864 -866

Hemdodynamic Stress Calibration 5% CO 2 12% O 2

CMRO 2 -related BOLD signal deficit: CBF hypercapnia visual stimulation Hoge, et al. BOLD (% increase) 20 CBF (% increase) 15 10 5 0 -5 -10 0 200 400 600 800 1000 1200 1400 Time (seconds) 3 2 1 0 0 200 400 600 800 1000 1200 1400 Time (seconds) Simultaneous Perfusion and BOLD imaging during graded visual activation and hypercapnia N=12

Hoge, et al. Computed CMRO 2 changes 40 30 20 10 0 -10 -20 -30 -40 Subject 1 Subject 2 %

Neuronal Activation Input Strategies 1. Block Design 2. Frequency Encoding 3. Phase Encoding 4. Single Event 5. Orthogonal Block Design 6. Free Behavior Design.

Free Behavior Design Use a continuous measure as a reference function: • Task performance • Skin Conductance • Heart, respiration rate. . • Eye position • EEG
 Ventromedial PFC Orbitofrontal Cortex Hypothalamus Amygdala Sympathetic Nervous System")
The Skin Conductance Response (SCR) Ventromedial PFC Orbitofrontal Cortex Hypothalamus Amygdala Sympathetic Nervous System Sweat Gland Resistance change across two electrodes induced by changes in sweating.

Brain activity correlated with SCR during “Rest”

Latest Developments… 1. Temporal Resolution 2. Spatial Resolution 3. Sensitivity and Noise 4. Information Content 5. Implementation

2 G/cm, 350 T/m/s 4 G/cm, 150 T/m/s 10 G/cm, 1000 T/m/s Diffusion imaging Faster imaging Higher resolution

Functional Imaging Methods / 3 T Group Staff Scientists: Sean Marrett Jerzy Bodurka Post Docs: Rasmus Birn Patrick Bellgowan Ziad Saad Graduate Student: Natalia Petridou Summer Student: Dan Kelley Program Assistant: Kay Kuhns August, 2000
- Slides: 60