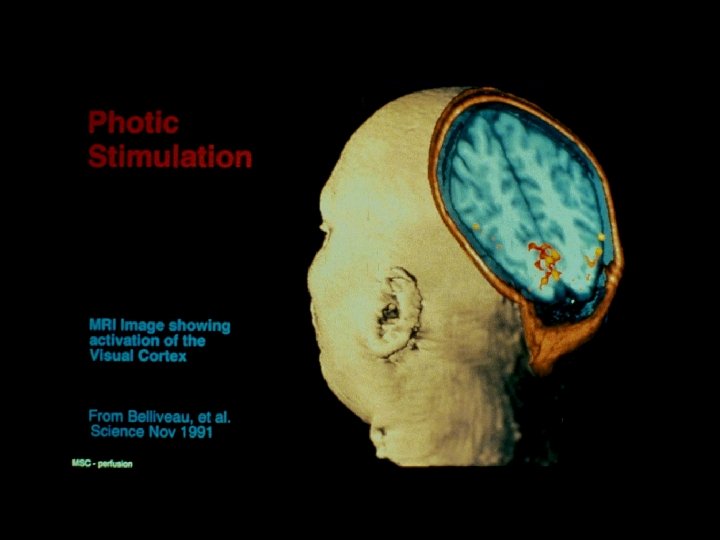
Latest Developments in f MRI Peter A Bandettini

Latest Developments in f. MRI Peter A. Bandettini, Ph. D Unit on Functional Imaging Methods & 3 T Neuroimaging Core Facility Laboratory of Brain and Cognition National Institute of Mental Health

The use of f. MRI for the Investigation of Brain Function and Physiology • Where? • When? • How much? • How to get the brain to do what we want it to do in the context of an f. MRI experiment? (limitations: limited time and signal to noise, motion, acoustic noise) • How much more information can we obtain?

Neuronal Activation ? Measured f. MRI Signal Hemodynamics Physiologic Factors ?

A Primary Challenge for Observing Brain Activation: . . . to make progressively more precise inferences without making too many assumptions about non-neuronal physiologic factors.

Contrast in Functional MRI • Blood Volume – Contrast agent injection and time series collection of T 2* or T 2 - weighted images • BOLD – Time series collection of T 2* or T 2 - weighted images • Perfusion – T 1 weighting – Arterial spin labeling

Resting Active
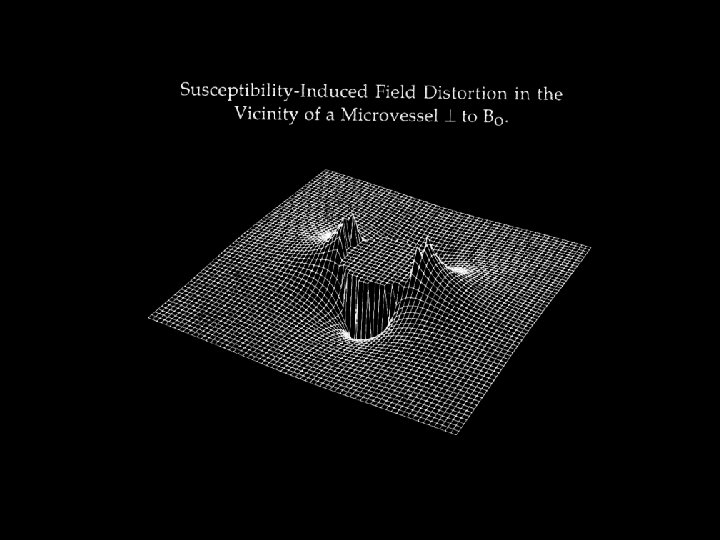

BOLD Contrast in the Detection of Neuronal Activity Cerebral Tissue Activation Local Vasodilation Oxygen Delivery Exceeds Metabolic Need Increase in Cerebral Blood Flow and Volume Increase in Capillary and Venous Blood Oxygenation Deoxy-hemoglobin: paramagnetic diamagnetic Decrease in Deoxy-hemoglobin. Oxy-hemoglobin: Decrease in susceptibility-related intravoxel dephasing Increase in T 2 and T 2* Local Signal Increase in T 2 and T 2* - weighted sequences
 signal changes task")
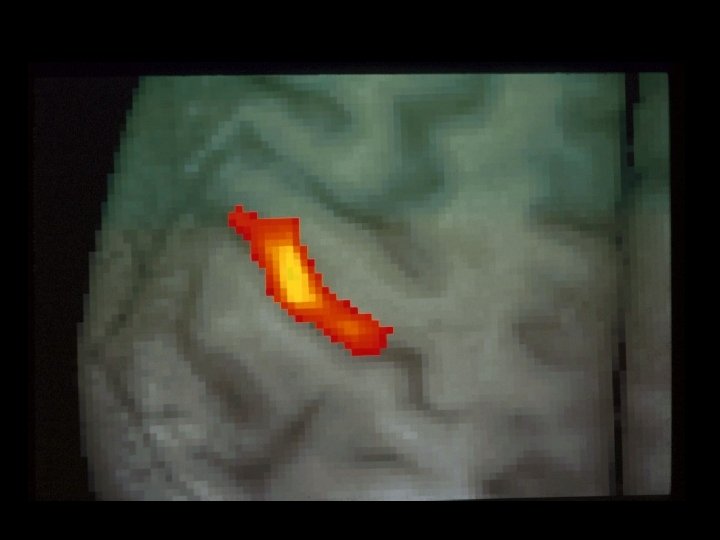
The BOLD Signal Blood Oxygenation Level Dependent (BOLD) signal changes task

Alternating Left and Right Finger Tapping ~ 1992

Perfusion / Flow Imaging EPISTAR - - - FAIR . . . Perfusion Time Series
 200 400 600 800 1000 1200 FAIR EPISTAR")
TI (ms) 200 400 600 800 1000 1200 FAIR EPISTAR

Resting ASL Signal

Comparison with Positron Emission Tomography PET: H 215 O MRI: ASL

Pushing the Envelope… 1. Temporal Resolution 2. Spatial Resolution 3. Sensitivity and Noise 4. Information Content 5. Implementation

Pushing the Envelope… 1. Temporal Resolution 2. Spatial Resolution 3. Sensitivity and Noise 4. Information Content 5. Implementation

time Anatomic Functional

Echo-Planar Imaging

2 1000 msec 100 msec 34 msec 1. 5 1 0. 5 0 -0. 5 -1 15 20 25 Time (sec) 30 35


Word stem completion
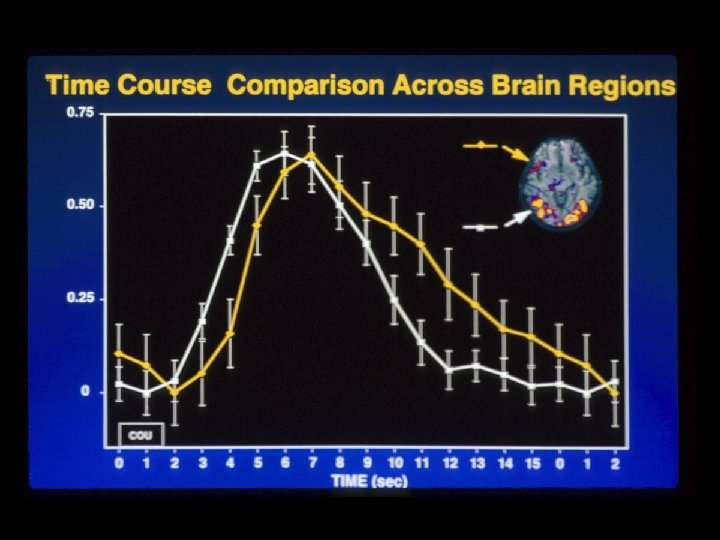

Latency Magnitude + 2 sec - 2 sec

Regions of Interest Used for Hemi-Field Experiment Right Hemisphere Left Hemisphere
 30")
9. 0 seconds 15 seconds 500 msec 10 20 Time (seconds) 30

Hemi-field with 500 msec asynchrony Average of 6 runs Standard Deviations Shown 3. 2 2. 4 1. 6 Percent 0. 8 MR Signal Strength 0 -0. 8 -1. 6 -2. 4 0 10 Time (seconds) 20 30

500 ms Right Hemifield Left Hemifield + 2. 5 s 0 s - 2. 5 s - =

11026– 11031 PNAS September 26, 2000 vol. 97 no. 20

Pushing the Envelope… 1. Temporal Resolution 2. Spatial Resolution 3. Sensitivity and Noise 4. Information Content 5. Implementation

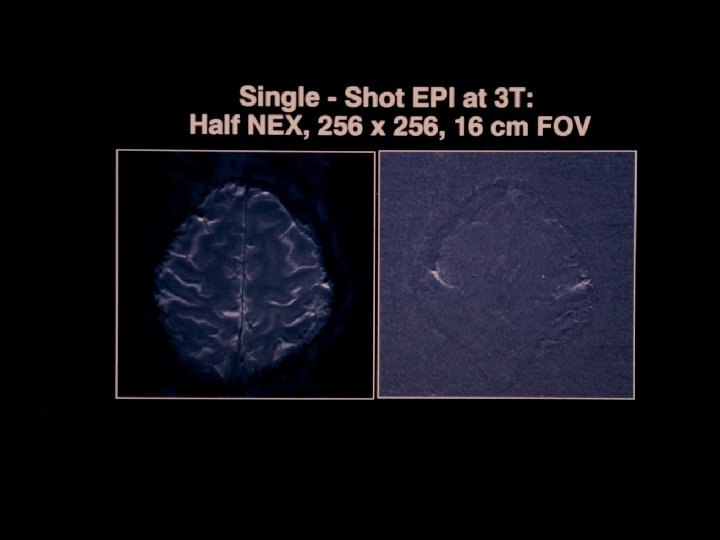
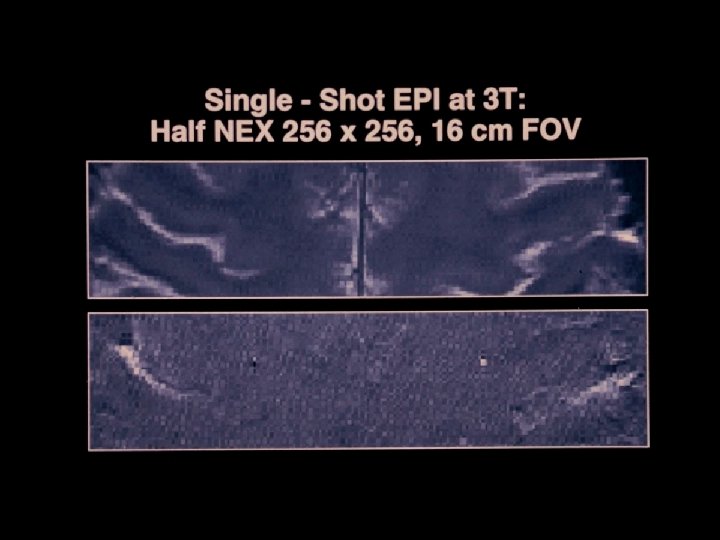
Single Shot Imaging T 2* decay EPI Readout Window ≈ 20 to 40 ms

Multishot Imaging T 2* decay EPI Window 1 T 2* decay EPI Window 2

Partial k-space imaging T 2* decay EPI Window

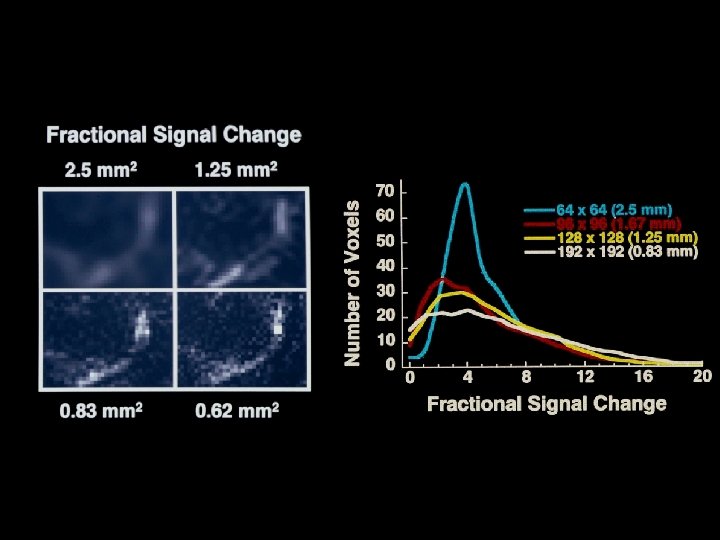
Multi Shot EPI Excitations Matrix Size 1 64 x 64 2 128 x 128 4 256 x 128 8 256 x 256

Perfusion BOLD Rest Activation

Anatomy BOLD Perfusion
 Venous inflow (Perf. No VN)")
Hemodynamic Specificity Arterial inflow (BOLD TR < 500 ms) Venous inflow (Perf. No VN)

ODC Maps using f. MRI 1 cm calcarine • Identical in size, orientation, and appearance to those obtained by optical imaging 1 and histology 3, 4. 1 Malonek D, Grinvald A. Science 272, 551 -4 (1996). 3 Horton JC, Hocking DR. J Neurosci 16, 7228 -39 (1996). 4 Horton JC, et al. Arch Ophthalmol 108, 1025 -31 (1990).
![Why short is better than long The vascular response to prolonged neural stimulation [Oxy]](http://slidetodoc.com/presentation_image/55c54de6456d253da109db5e62213364/image-44.jpg "Why short is better than long The vascular response to prolonged neural stimulation [Oxy]")
Why short is better than long The vascular response to prolonged neural stimulation [Oxy] It is argued that f. MRI cannot achieve submillimeter functional resolution because a saturated hyperoxic vascular response to neural activity spreads over many millimeters 1, 2. However, optical imaging has demonstrated that the hyperoxic response can yield well-localized maps when using short duration stimuli (<5 sec)1. ~12 sec The vascular response to brief neural stimulation 1 Malonek D, Grinvald A. Science 272, 551 - 4 (1996). 2 Kim D-S, Duong T, Kim S-G. Nat Neurosci 3, 164 -9 (2000).

Pushing the Envelope… 1. Temporal Resolution 2. Spatial Resolution 3. Sensitivity and Noise 4. Information Content 5. Implementation

Temporal S/N vs. Image S/N PHANTOMS SUBJECTS 1400 1000 Temporal S/N 1200 1000 800 600 400 200 400 600 800 Image S/N 1000 1200 1400 0 200 400 600 800 Image S/N N. Petridou 1000

Pushing the Envelope… 1. Temporal Resolution 2. Spatial Resolution 3. Sensitivity and Noise 4. Information Content 5. Implementation

Motor Cortex Auditory Cortex

BOLD Response Stimulus timing Signal Different stimulus “ON” periods 0. 25 s linear 0. 5 s measured 1 s 2 s 20 s time (s) Brief stimuli produce larger responses than expected

Results – visual task Nonlinearity Magnitude Latency

Results – motor task Nonlinearity Magnitude Latency

Different stimulus “OFF” periods BOLD Response Signal measured linear Stimulus timing 2 s 3 s 4 s 8 s 16 s time (s) Brief stimulus OFF periods produce smaller decreases than expecte

Sources of this Nonlinearity • Neuronal • Hemodynamic – Oxygen extraction – Blood volume dynamics Oxygen Extraction Flow In Flow Out D Volume

5% CO 2 12% O 2

CMRO 2 -related BOLD signal deficit: CBF hypercapnia visual stimulation Hoge, et al. BOLD (% increase) 20 CBF (% increase) 15 10 5 0 -5 -10 0 200 400 600 800 1000 1200 1400 Time (seconds) 3 2 1 0 0 200 400 600 800 1000 1200 1400 Time (seconds) Simultaneous Perfusion and BOLD imaging during graded visual activation and hypercapnia N=12

Hoge, et al. CBF-CMRO 2 coupling 4 -10 +10 0 +20 CMRO 2 (% increase) BOLD (% increase) 25 3 2 1 20 15 10 5 0 0 0 10 20 30 40 Perfusion (% increase) 50 0 10 20 30 40 50 Perfusion (% increase) Characterizing Activation-induced CMRO 2 changes using calibration with hypercapnia

Hoge, et al. Computed CMRO 2 changes 40 30 20 10 0 -10 -20 -30 -40 Subject 1 Subject 2 %


Neuronal Activation Input Strategies 1. Block Design 2. Frequency Encoding 3. Phase Encoding 4. Single Event 5. Orthogonal Block Design 6. Free Behavior Design.

Free Behavior Design Use a continuous measure as a reference function: • Task performance • Skin Conductance • Heart, respiration rate. . • Eye position • EEG

Brain activity correlated with SCR during “Rest”

Pushing the Envelope… 1. Temporal Resolution 2. Spatial Resolution 3. Sensitivity and Noise 4. Information Content 5. Implementation

Motion Recognize? • Edge effects • Shorter signal change latencies • Unusually high signal changes • External measuring devices Correct? • Image registration algorithms • Orthogonalize to motion-related function (cardiac, respiration, movement) • Navigator echo for k-space alignment (for multishot techniques) • Re-do scan Bypass? • Paradigm timing strategies. . • Gating (with T 1 -correction) Suppress? • Flatten image contrast • Physical restraint • Averaging, smoothing
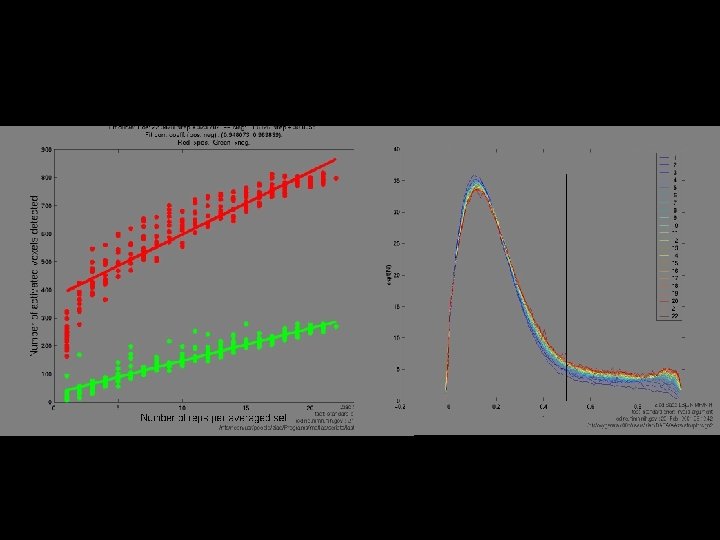
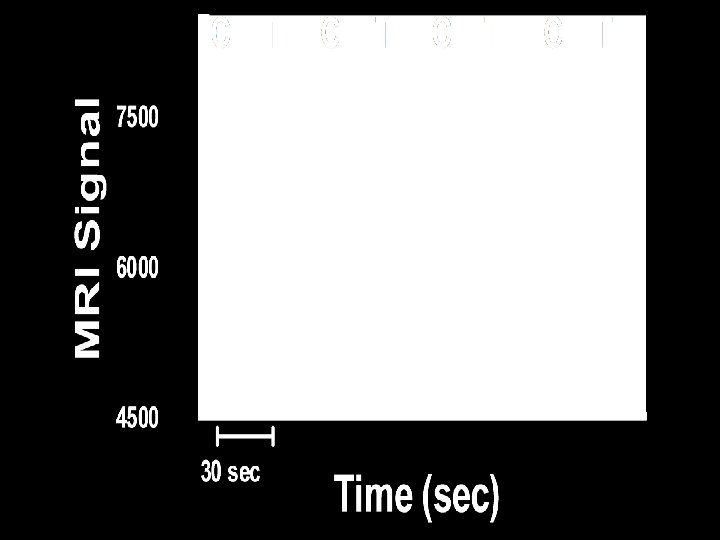
 Image Acquisition ( 20 to 30 sec)")
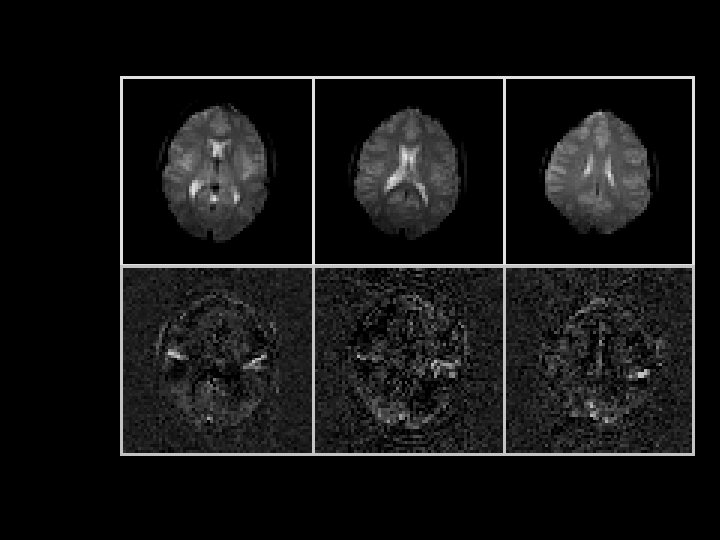
Prior EPI Gradients ( 20 sec ) Image Acquisition ( 20 to 30 sec) T C T T C = C Average Time Series Difference Time Series
 5 6 7")
a. b. c. 0 1 2 3 4 Time (sec) 5 6 7

b.

How to deal with Scanner Noise? • Clustered volume acquisition Talavage et al. • Silent sequences

Functional Imaging Methods / 3 T Group Staff Scientists: Sean Marrett Jerzy Bodurka Post Docs: Rasmus Birn Patrick Bellgowan Ziad Saad Graduate Student: Natalia Petridou Summer Student: Dan Kelley Program Assistant: Kay Kuhns August, 2000
- Slides: 73