
LATERAL LOAD PATH ANALYSIS PRACTICAL METHODS FOR LIGHTFRAME









- Slides: 78
LATERAL LOAD PATH ANALYSIS: PRACTICAL METHODS FOR LIGHTFRAME MODULAR STRUCTURES THANH HUYNH
RESEARCH OBJECTIVES BUILDING ANALOG MATERIAL PROPERTIES SHEAR WALL TEST SHEAR WALL CALIBRATION STRUCTURAL DETAILS WIND LOADS FOUNDATION CONFIGURATIONS SAP 2000 ANALYSIS METHOD SAP 2000 OUTPUT VERIFICATION SAP 2000 RESULTS MODELING CONCLUSIONS RECOMMENDATIONS FOR FUTURE RESEARCH BASED ON CONCLUSIONS OUTLINE
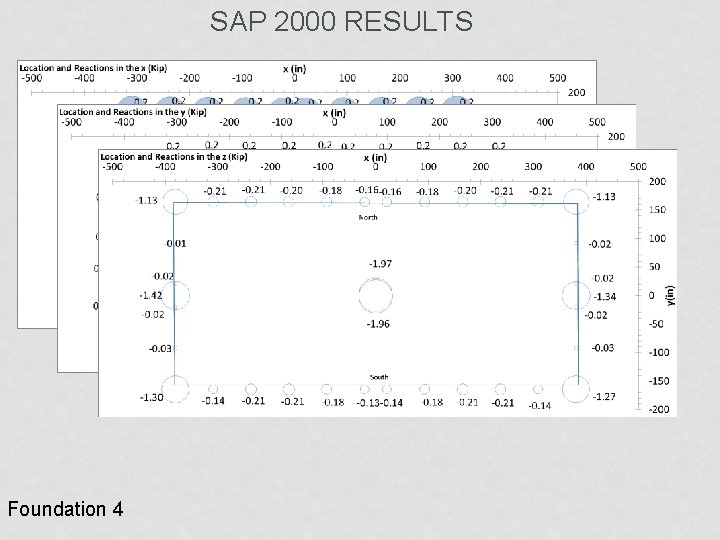
RESEARCH OBJECTIVES
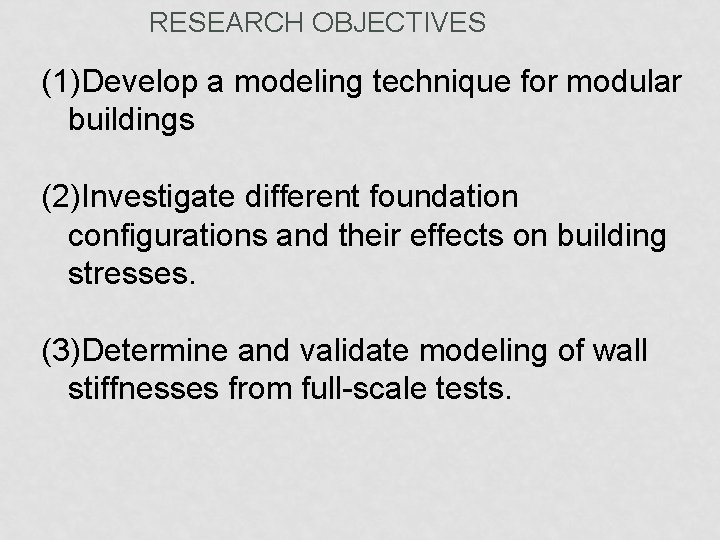
RESEARCH OBJECTIVES (1)Develop a modeling technique for modular buildings (2)Investigate different foundation configurations and their effects on building stresses. (3)Determine and validate modeling of wall stiffnesses from full-scale tests.
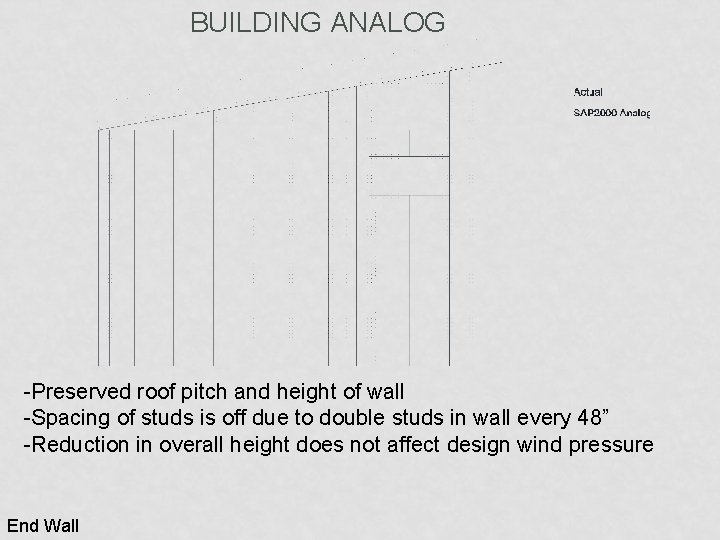
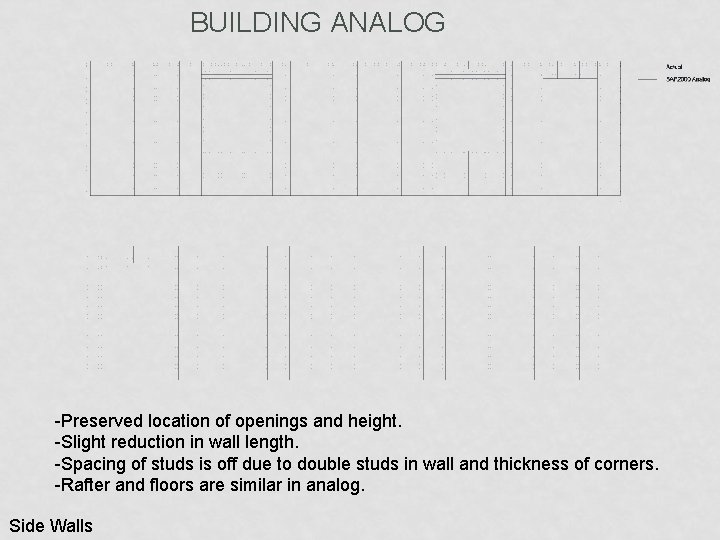
BUILDING ANALOG ARCHITECTURAL DRAWINGS VS SAP 2000 MODEL
BUILDING ANALOG -Preserved roof pitch and height of wall -Spacing of studs is off due to double studs in wall every 48” -Reduction in overall height does not affect design wind pressure End Wall
BUILDING ANALOG -Preserved location of openings and height. -Slight reduction in wall length. -Spacing of studs is off due to double studs in wall and thickness of corners. -Rafter and floors are similar in analog. Side Walls
MATERIAL PROPERTIES
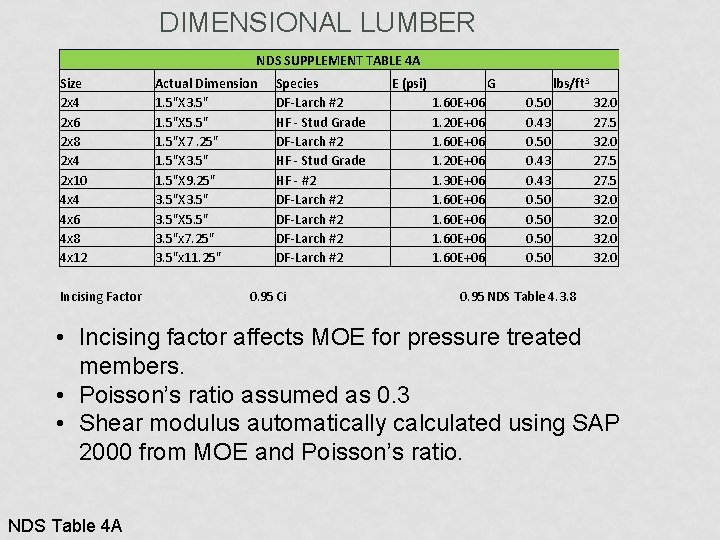
DIMENSIONAL LUMBER NDS SUPPLEMENT TABLE 4 A Size 2 x 4 2 x 6 2 x 8 2 x 4 2 x 10 4 x 4 4 x 6 4 x 8 4 x 12 Incising Factor Actual Dimension 1. 5"X 3. 5" 1. 5"X 5. 5" 1. 5"X 7. 25" 1. 5"X 3. 5" 1. 5"X 9. 25" 3. 5"X 5. 5" 3. 5"x 7. 25" 3. 5"x 11. 25" Species DF-Larch #2 HF - Stud Grade HF - #2 DF-Larch #2 0. 95 Ci E (psi) G 1. 60 E+06 1. 20 E+06 1. 30 E+06 1. 60 E+06 lbs/ft 3 0. 50 0. 43 0. 50 32. 0 27. 5 32. 0 0. 95 NDS Table 4. 3. 8 • Incising factor affects MOE for pressure treated members. • Poisson’s ratio assumed as 0. 3 • Shear modulus automatically calculated using SAP 2000 from MOE and Poisson’s ratio. NDS Table 4 A
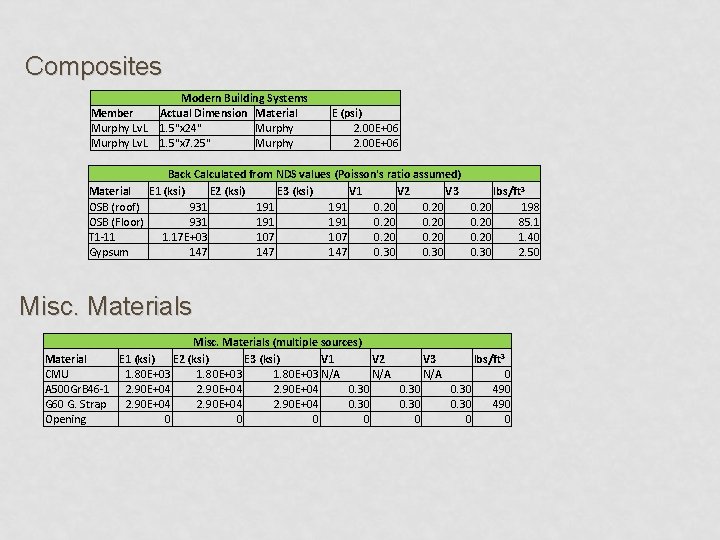
Composites Member Murphy Lv. L Modern Building Systems Actual Dimension Material 1. 5"x 24" Murphy 1. 5"x 7. 25" Murphy E (psi) 2. 00 E+06 Back Calculated from NDS values (Poisson's ratio assumed) Material E 1 (ksi) E 2 (ksi) E 3 (ksi) V 1 V 2 V 3 OSB (roof) 931 191 0. 20 OSB (Floor) 931 191 0. 20 T 1 -11 1. 17 E+03 107 0. 20 Gypsum 147 147 0. 30 lbs/ft 3 0. 20 198 0. 20 85. 1 0. 20 1. 40 0. 30 2. 50 Misc. Materials (multiple sources) Material E 1 (ksi) E 2 (ksi) E 3 (ksi) V 1 V 2 V 3 lbs/ft 3 CMU 1. 80 E+03 N/A N/A 0 A 500 Gr. B 46 -1 2. 90 E+04 0. 30 490 G 60 G. Strap 2. 90 E+04 0. 30 490 Opening 0 0 0 0
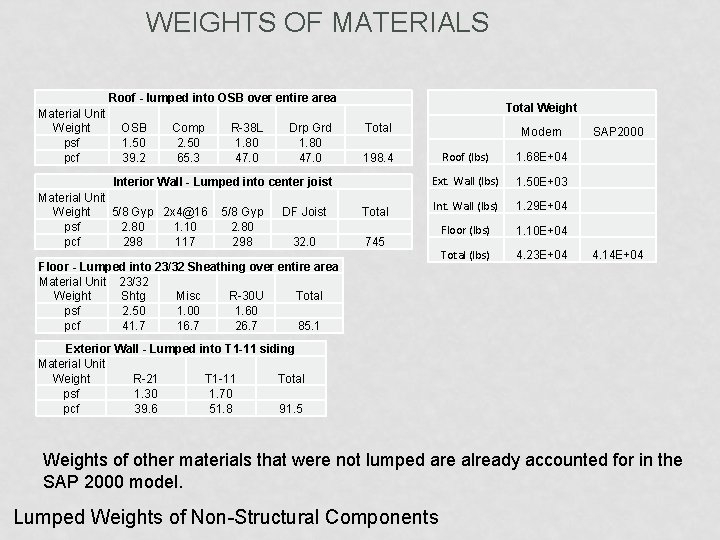
WEIGHTS OF MATERIALS Roof - lumped into OSB over entire area Material Unit Weight psf pcf OSB 1. 50 39. 2 Comp 2. 50 65. 3 R-38 L 1. 80 47. 0 Drp Grd 1. 80 47. 0 Total Weight Total 198. 4 Interior Wall - Lumped into center joist Material Unit Weight 5/8 Gyp 2 x 4@16 psf 2. 80 1. 10 pcf 298 117 5/8 Gyp 2. 80 298 DF Joist 32. 0 Total 745 Modern Roof (lbs) 1. 68 E+04 Ext. Wall (lbs) 1. 50 E+03 Int. Wall (lbs) 1. 29 E+04 Floor (lbs) 1. 10 E+04 Total (lbs) 4. 23 E+04 Floor - Lumped into 23/32 Sheathing over entire area Material Unit 23/32 Weight Shtg Misc R-30 U Total psf 2. 50 1. 00 1. 60 pcf 41. 7 16. 7 26. 7 85. 1 SAP 2000 4. 14 E+04 Exterior Wall - Lumped into T 1 -11 siding Material Unit Weight R-21 T 1 -11 Total psf 1. 30 1. 70 pcf 39. 6 51. 8 91. 5 Weights of other materials that were not lumped are already accounted for in the SAP 2000 model. Lumped Weights of Non-Structural Components
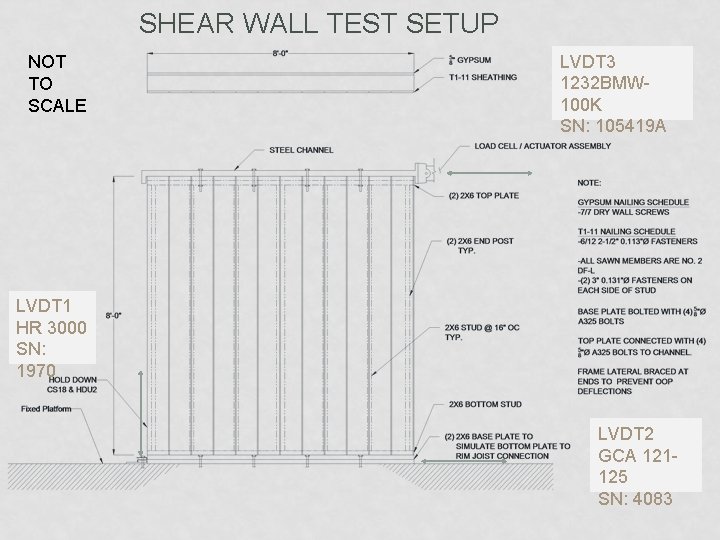
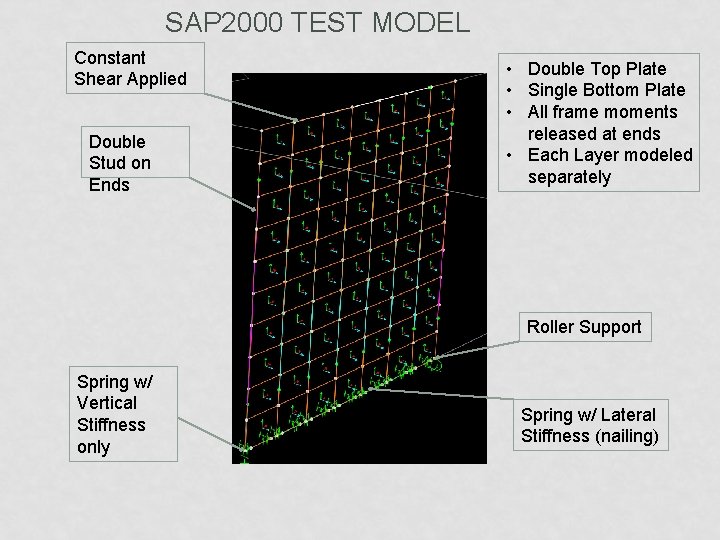
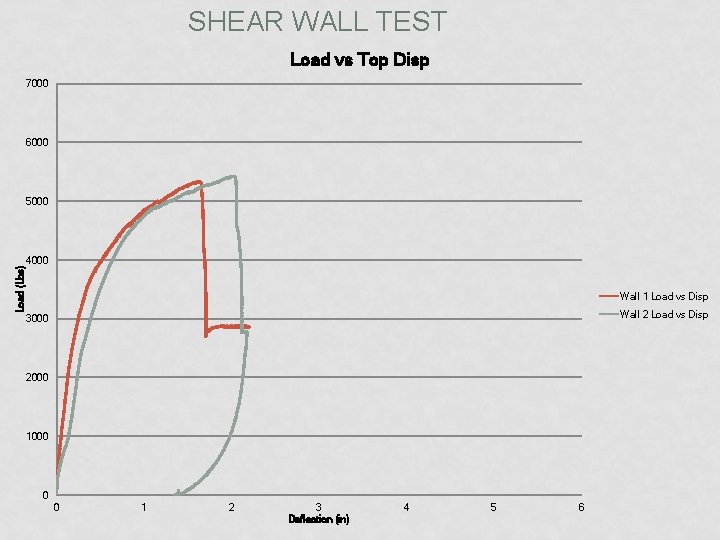
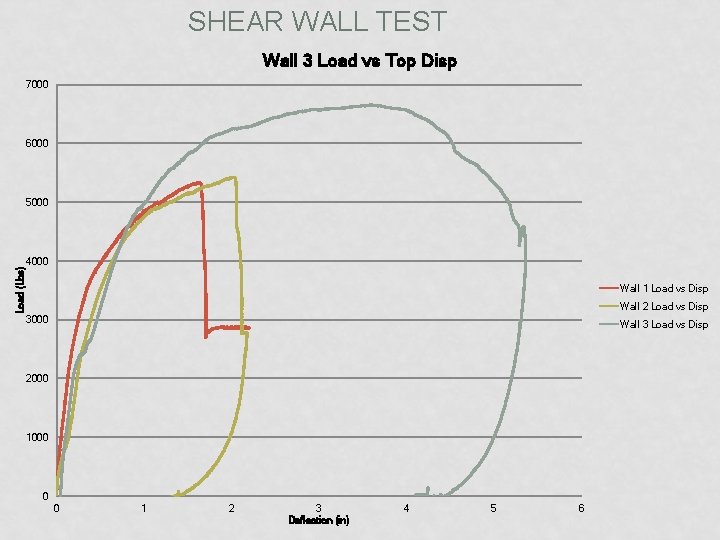
SHEAR WALL TEST S H E A R W A L L T E S T S E T U P S A P 2 0 0 0 T E S T M O D E L R E S U L T S O F T E S T
SHEAR WALL TEST SETUP NOT TO SCALE LVDT 3 1232 BMW 100 K SN: 105419 A LVDT 1 HR 3000 SN: 1970 LVDT 2 GCA 121125 SN: 4083
SAP 2000 TEST MODEL Constant Shear Applied Double Stud on Ends • Double Top Plate • Single Bottom Plate • All frame moments released at ends • Each Layer modeled separately Roller Support Spring w/ Vertical Stiffness only Spring w/ Lateral Stiffness (nailing)
SHEAR WALL TEST Load vs Top Disp 7000 6000 Load (Lbs) 5000 4000 Wall 1 Load vs Disp Wall 2 Load vs Disp 3000 2000 1000 0 0 1 2 3 Deflection (in) 4 5 6
SHEAR WALL TEST Wall 3 Load vs Top Disp 7000 6000 Load (Lbs) 5000 4000 Wall 1 Load vs Disp Wall 2 Load vs Disp 3000 Wall 3 Load vs Disp 2000 1000 0 0 1 2 3 Deflection (in) 4 5 6
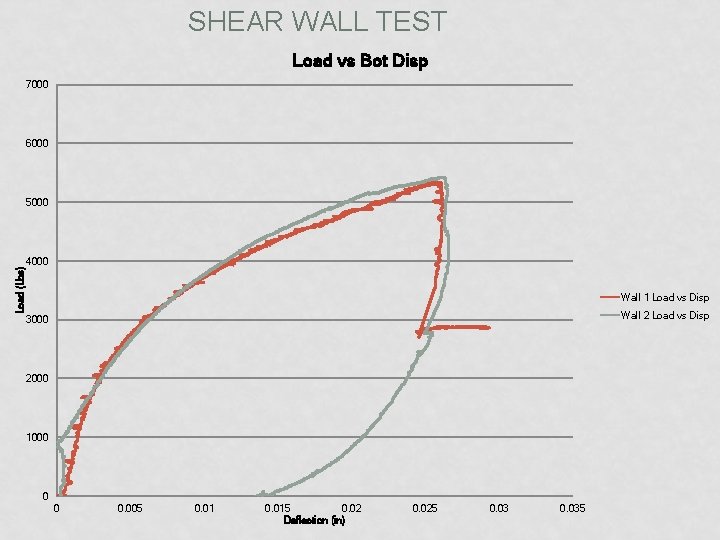
SHEAR WALL TEST Load vs Bot Disp 7000 6000 Load (Lbs) 5000 4000 Wall 1 Load vs Disp Wall 2 Load vs Disp 3000 2000 1000 0 0 0. 005 0. 015 0. 02 Deflection (in) 0. 025 0. 035
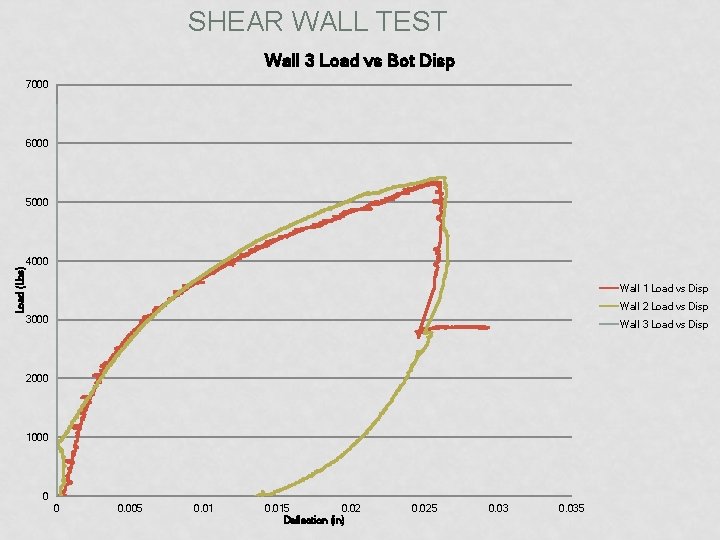
SHEAR WALL TEST Wall 3 Load vs Bot Disp 7000 6000 Load (Lbs) 5000 4000 Wall 1 Load vs Disp Wall 2 Load vs Disp 3000 Wall 3 Load vs Disp 2000 1000 0 0 0. 005 0. 015 0. 02 Deflection (in) 0. 025 0. 035
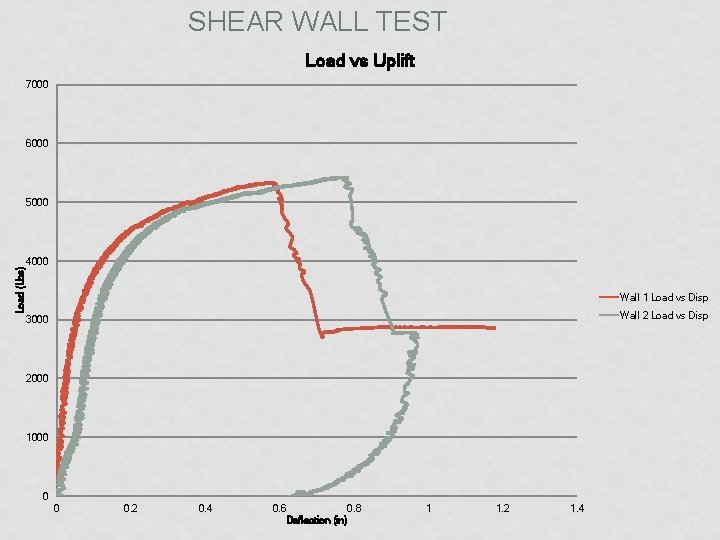
SHEAR WALL TEST Load vs Uplift 7000 6000 Load (Lbs) 5000 4000 Wall 1 Load vs Disp Wall 2 Load vs Disp 3000 2000 1000 0 0 0. 2 0. 4 0. 6 0. 8 Deflection (in) 1 1. 2 1. 4
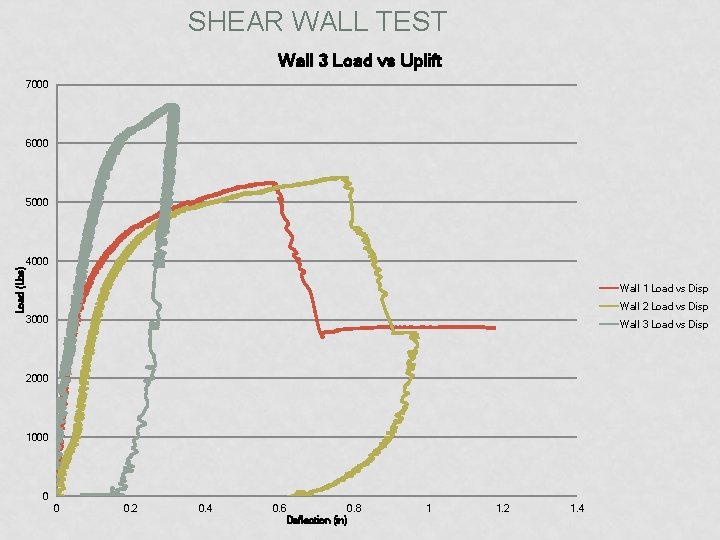
SHEAR WALL TEST Wall 3 Load vs Uplift 7000 6000 Load (Lbs) 5000 4000 Wall 1 Load vs Disp Wall 2 Load vs Disp 3000 Wall 3 Load vs Disp 2000 1000 0 0 0. 2 0. 4 0. 6 0. 8 Deflection (in) 1 1. 2 1. 4
SHEAR WALL CALIBRATION NDS 3 -TERM DEFORMATION EQUATION SAP 2000 CALIBRATION MODEL AND RESULTS
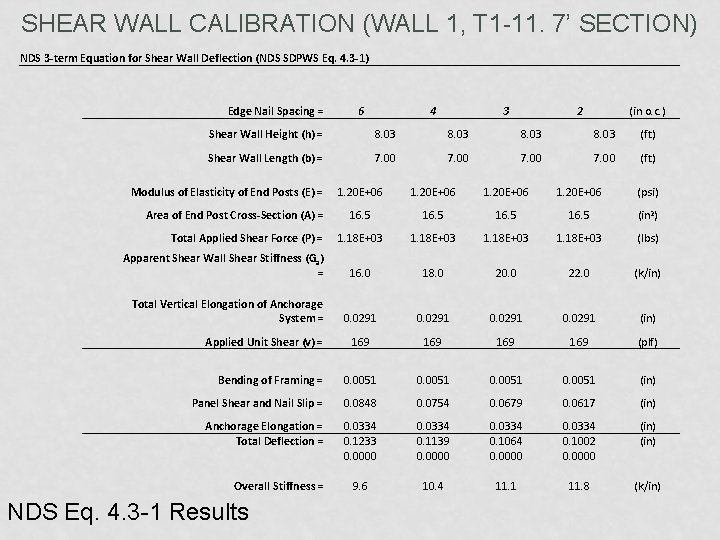
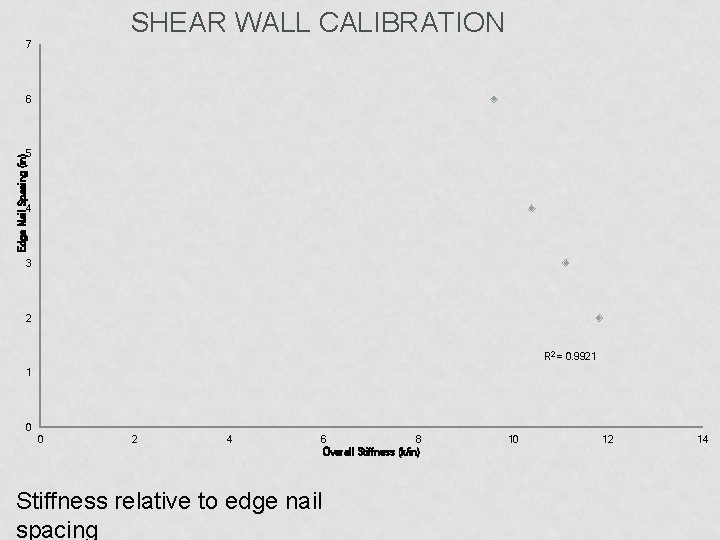
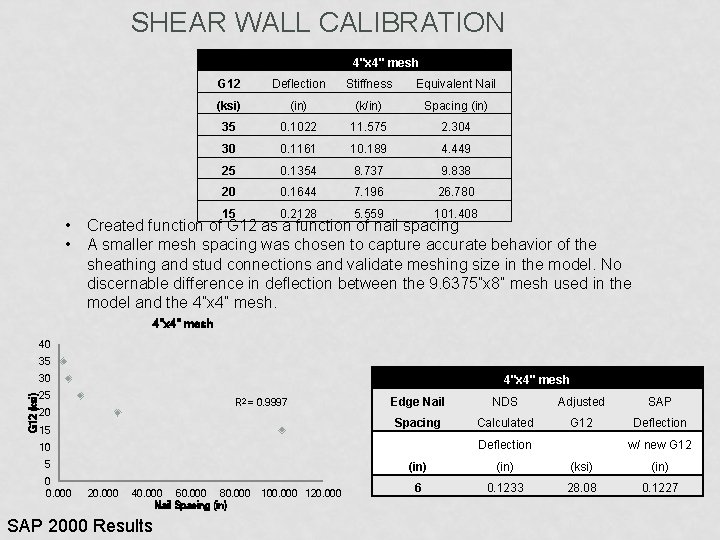
SHEAR WALL CALIBRATION • The 3 - term NDS equation is used to calibrate the shear wall stiffness. • Stiffnesses of walls for several edge nail spacings are computed and used to develop a functional relationship. • This is used in establishing G 12 values and stiffnesses for all of the walls.
SHEAR WALL CALIBRATION (WALL 1, T 1 -11. 7’ SECTION) NDS 3 -term Equation for Shear Wall Deflection (NDS SDPWS Eq. 4. 3 -1) Edge Nail Spacing = (in o. c. ) 8. 03 (ft) Shear Wall Length (b) = 7. 00 (ft) 1. 20 E+06 (psi) 16. 5 (in 2) 1. 18 E+03 (lbs) 16. 0 18. 0 20. 0 22. 0 (k/in) 0. 0291 (in) 169 169 (plf) Bending of Framing = 0. 0051 (in) Panel Shear and Nail Slip = 0. 0848 0. 0754 0. 0679 0. 0617 (in) Anchorage Elongation = Total Deflection = 0. 0334 0. 1233 0. 0000 0. 0334 0. 1139 0. 0000 0. 0334 0. 1064 0. 0000 0. 0334 0. 1002 0. 0000 (in) 9. 6 10. 4 11. 1 11. 8 (k/in) Apparent Shear Wall Shear Stiffness (Ga) = Total Vertical Elongation of Anchorage System = 2 8. 03 Total Applied Shear Force (P) = 3 8. 03 Area of End Post Cross-Section (A) = 4 Shear Wall Height (h) = Modulus of Elasticity of End Posts (E) = 6 Applied Unit Shear (v) = Overall Stiffness = NDS Eq. 4. 3 -1 Results
SHEAR WALL CALIBRATION 7 6 Edge Nail Spacing (in) 5 4 3 2 R 2 = 0. 9921 1 0 0 2 4 6 8 Overall Stiffness (k/in) Stiffness relative to edge nail spacing 10 12 14
SHEAR WALL CALIBRATION 4"x 4" mesh • • G 12 Deflection Stiffness Equivalent Nail (ksi) (in) (k/in) Spacing (in) 35 0. 1022 11. 575 2. 304 30 0. 1161 10. 189 4. 449 25 0. 1354 8. 737 9. 838 20 0. 1644 7. 196 26. 780 15 0. 2128 5. 559 101. 408 Created function of G 12 as a function of nail spacing A smaller mesh spacing was chosen to capture accurate behavior of the sheathing and stud connections and validate meshing size in the model. No discernable difference in deflection between the 9. 6375”x 8” mesh used in the model and the 4”x 4” mesh. 4"x 4" mesh 40 35 G 12 (ksi) 30 4"x 4" mesh 25 R 2 = 0. 9997 20 15 Edge Nail NDS Adjusted SAP Spacing Calculated G 12 Deflection 10 5 0 0. 000 20. 000 40. 000 60. 000 80. 000 Nail Spacing (in) SAP 2000 Results 100. 000 120. 000 w/ new G 12 (in) (ksi) (in) 6 0. 1233 28. 08 0. 1227
STRUCTURAL DETAILS VIDEO HERE CMU/TIE CONNECTIONS
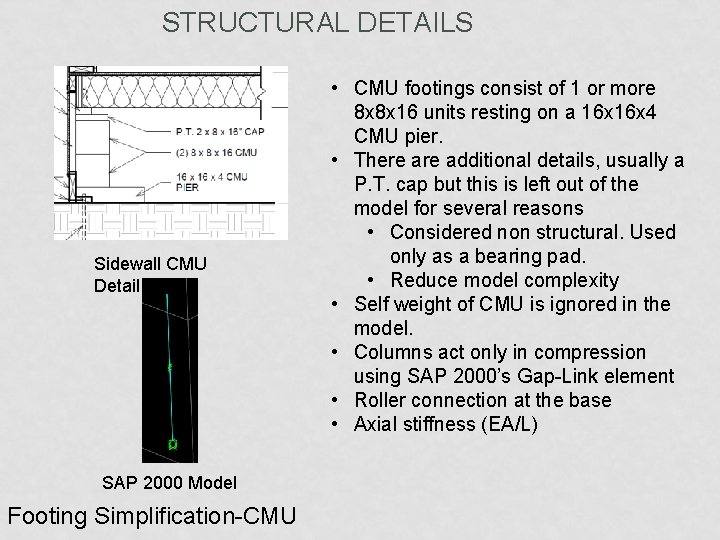
STRUCTURAL DETAILS Sidewall CMU Detail SAP 2000 Model Footing Simplification-CMU • CMU footings consist of 1 or more 8 x 8 x 16 units resting on a 16 x 4 CMU pier. • There additional details, usually a P. T. cap but this is left out of the model for several reasons • Considered non structural. Used only as a bearing pad. • Reduce model complexity • Self weight of CMU is ignored in the model. • Columns act only in compression using SAP 2000’s Gap-Link element • Roller connection at the base • Axial stiffness (EA/L)
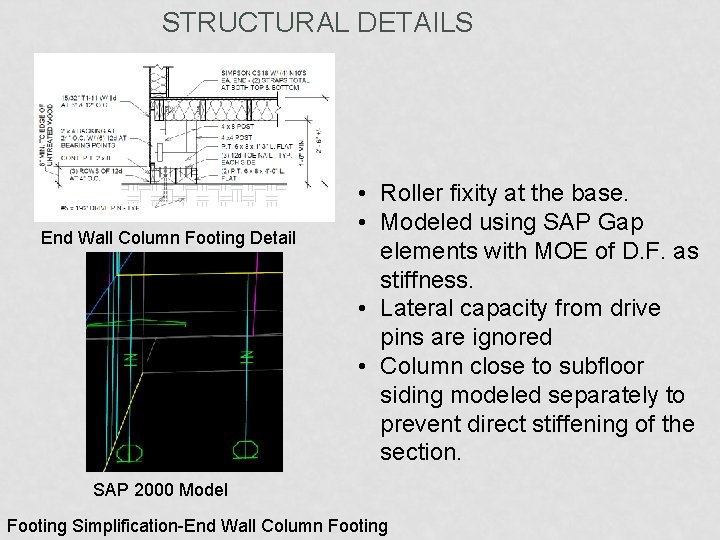
STRUCTURAL DETAILS End Wall Column Footing Detail • Roller fixity at the base. • Modeled using SAP Gap elements with MOE of D. F. as stiffness. • Lateral capacity from drive pins are ignored • Column close to subfloor siding modeled separately to prevent direct stiffening of the section. SAP 2000 Model Footing Simplification-End Wall Column Footing
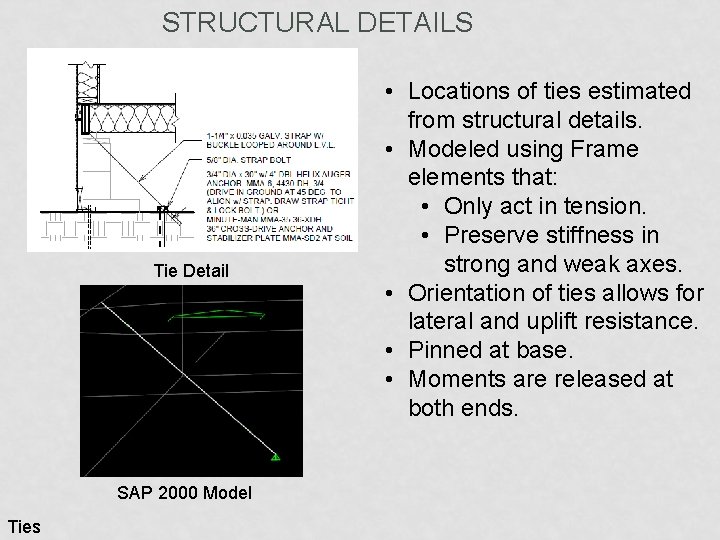
STRUCTURAL DETAILS Tie Detail SAP 2000 Model Ties • Locations of ties estimated from structural details. • Modeled using Frame elements that: • Only act in tension. • Preserve stiffness in strong and weak axes. • Orientation of ties allows for lateral and uplift resistance. • Pinned at base. • Moments are released at both ends.
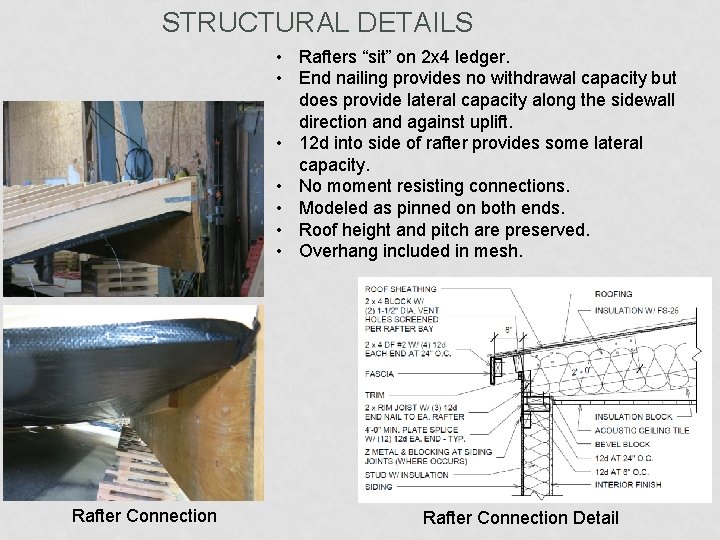
STRUCTURAL DETAILS • Rafters “sit” on 2 x 4 ledger. • End nailing provides no withdrawal capacity but does provide lateral capacity along the sidewall direction and against uplift. • 12 d into side of rafter provides some lateral capacity. • No moment resisting connections. • Modeled as pinned on both ends. • Roof height and pitch are preserved. • Overhang included in mesh. Rafter Connection Detail
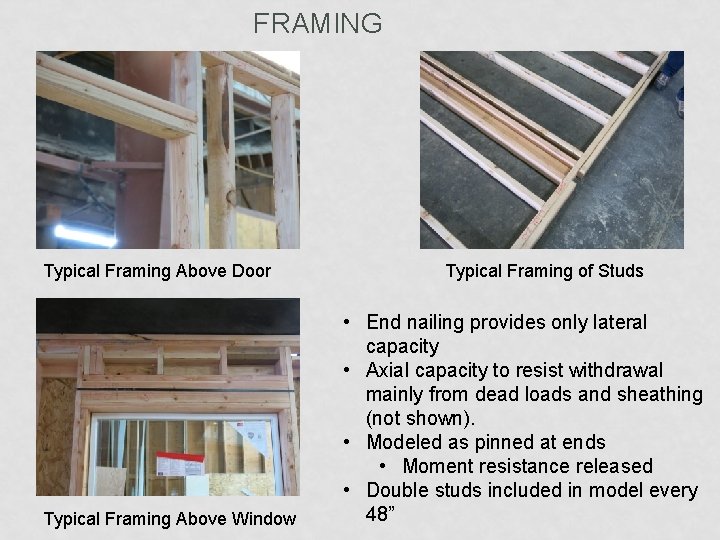
FRAMING Typical Framing Above Door Typical Framing Above Window Typical Framing of Studs • End nailing provides only lateral capacity • Axial capacity to resist withdrawal mainly from dead loads and sheathing (not shown). • Modeled as pinned at ends • Moment resistance released • Double studs included in model every 48”
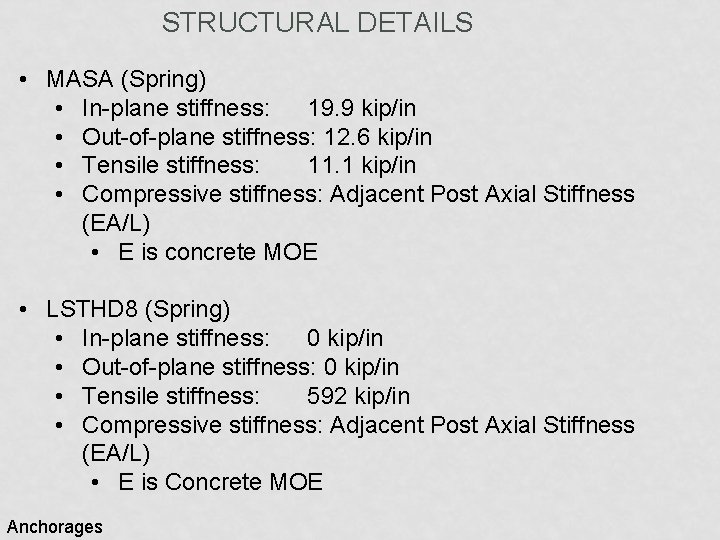
STRUCTURAL DETAILS • MASA (Spring) • In-plane stiffness: 19. 9 kip/in • Out-of-plane stiffness: 12. 6 kip/in • Tensile stiffness: 11. 1 kip/in • Compressive stiffness: Adjacent Post Axial Stiffness (EA/L) • E is concrete MOE • LSTHD 8 (Spring) • In-plane stiffness: 0 kip/in • Out-of-plane stiffness: 0 kip/in • Tensile stiffness: 592 kip/in • Compressive stiffness: Adjacent Post Axial Stiffness (EA/L) • E is Concrete MOE Anchorages
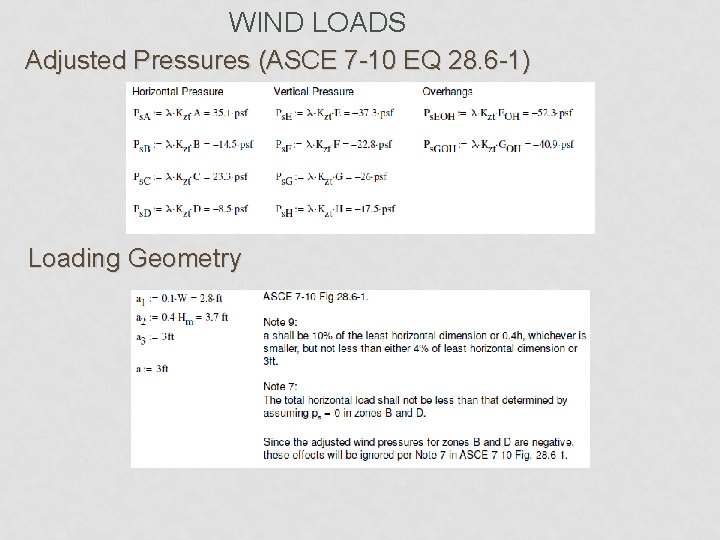
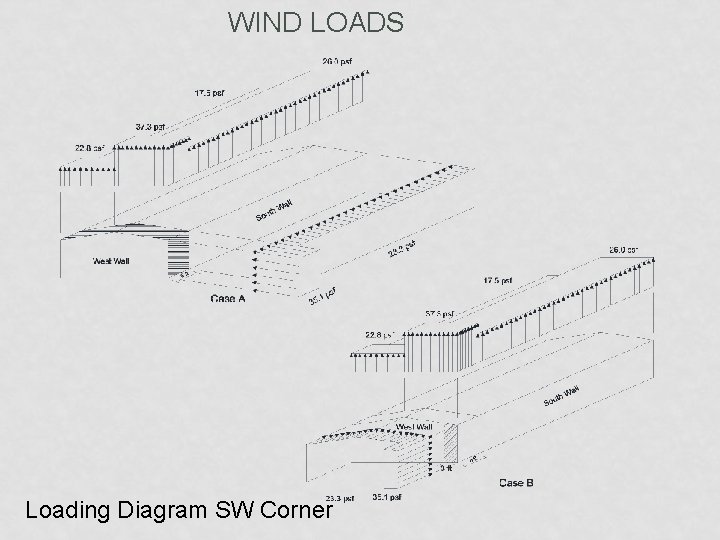
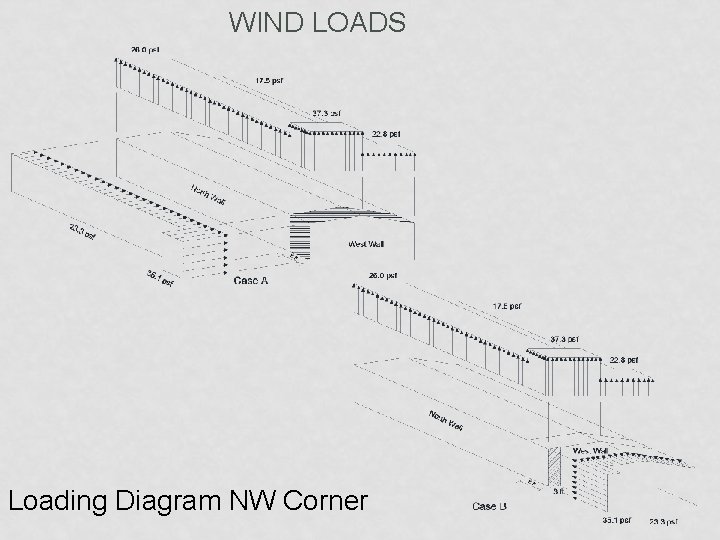
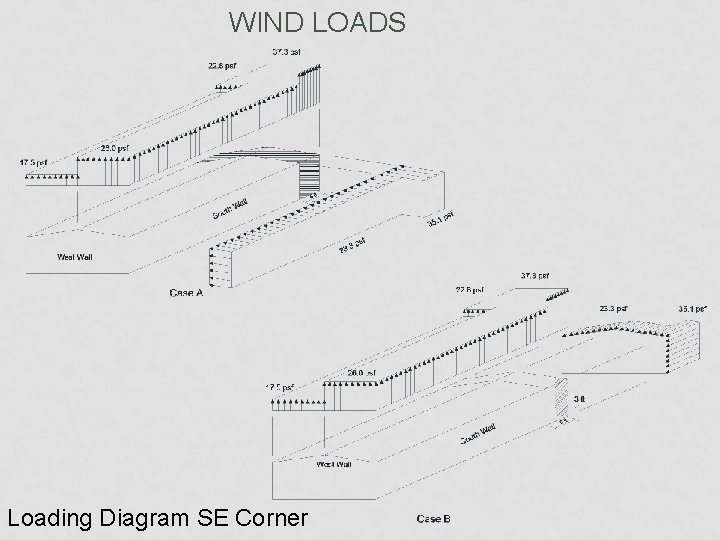
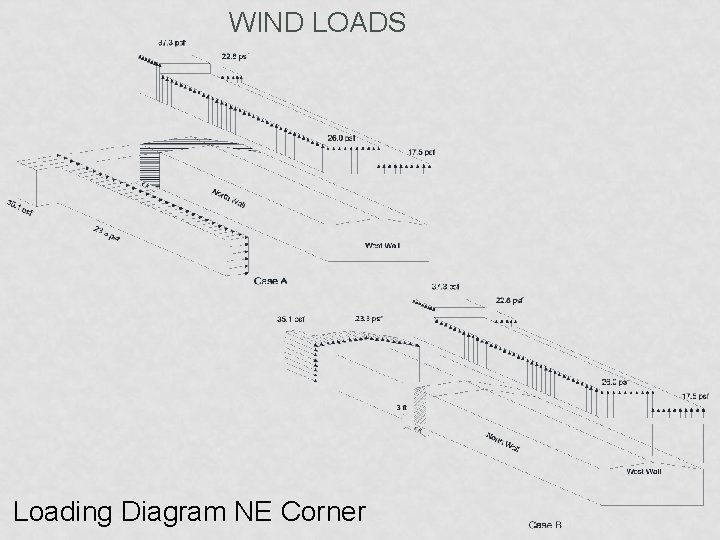
WIND LOADS ASCE 7 -10 SIMPLIFIED ENVELOPE (PART 2) METHOD CHECKED WITH EXAMPLE FROM STRUCTURAL LOADS (FANELLA, 2012)
WIND LOADS Adjusted Pressures (ASCE 7 -10 EQ 28. 6 -1) Loading Geometry
WIND LOADS Loading Diagram SW Corner
WIND LOADS Loading Diagram NW Corner
WIND LOADS Loading Diagram SE Corner
WIND LOADS Loading Diagram NE Corner
FOUNDATION CONFIGURATIONS F F O O U U N N D D A A T T I I O O N N 1 2 3 4
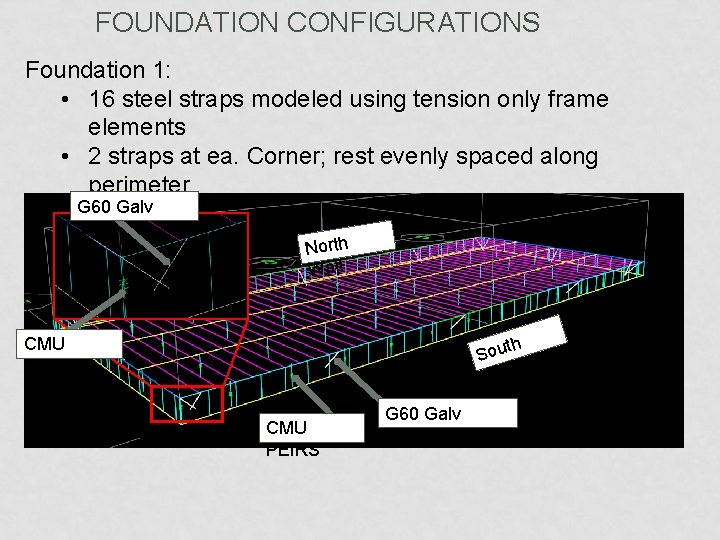
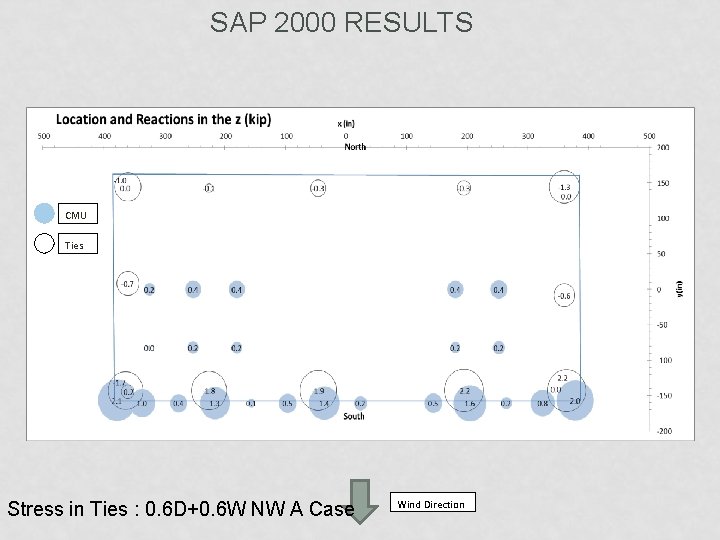
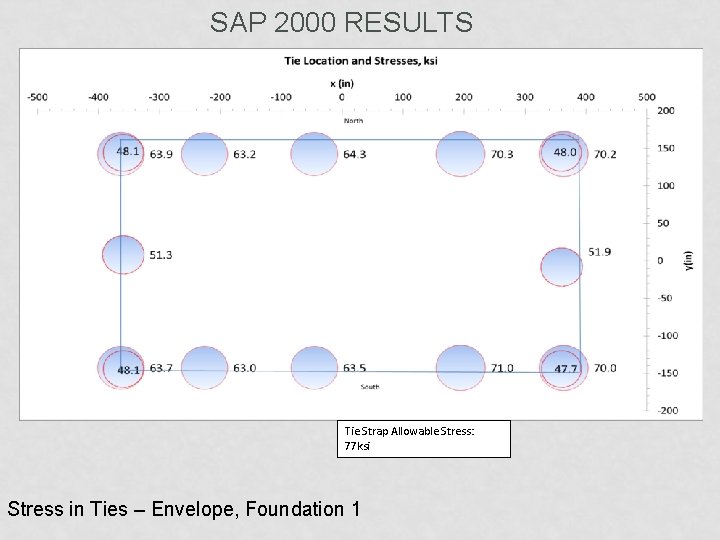
FOUNDATION CONFIGURATIONS Foundation 1: • 16 steel straps modeled using tension only frame elements • 2 straps at ea. Corner; rest evenly spaced along perimeter • G 60 Galv CMU under joist mid-span, perimeter and marriage line Strap North Wall th u o S l Wal CMU PEIRS G 60 Galv Straps
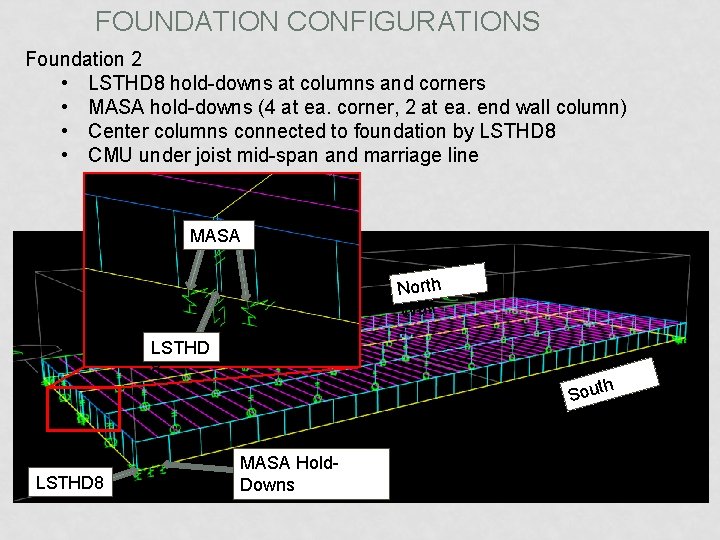
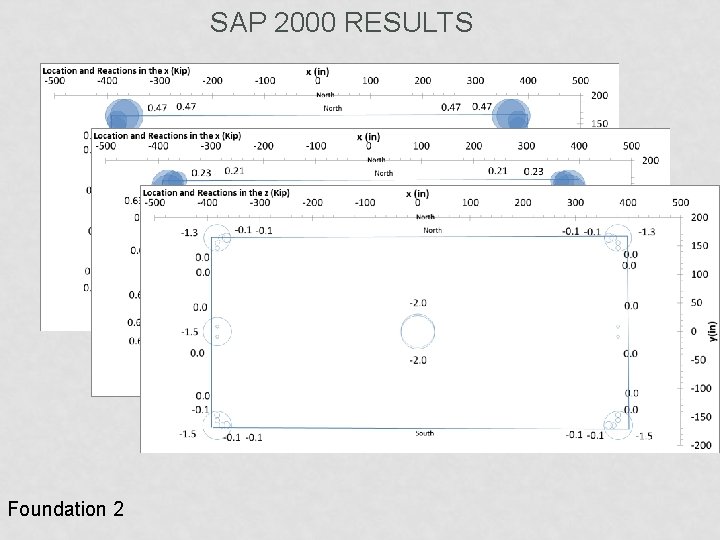
FOUNDATION CONFIGURATIONS Foundation 2 • LSTHD 8 hold-downs at columns and corners • MASA hold-downs (4 at ea. corner, 2 at ea. end wall column) • Center columns connected to foundation by LSTHD 8 • CMU under joist mid-span and marriage line MASA North Wall LSTHD 8 h Sout Wall MASA Hold. Downs
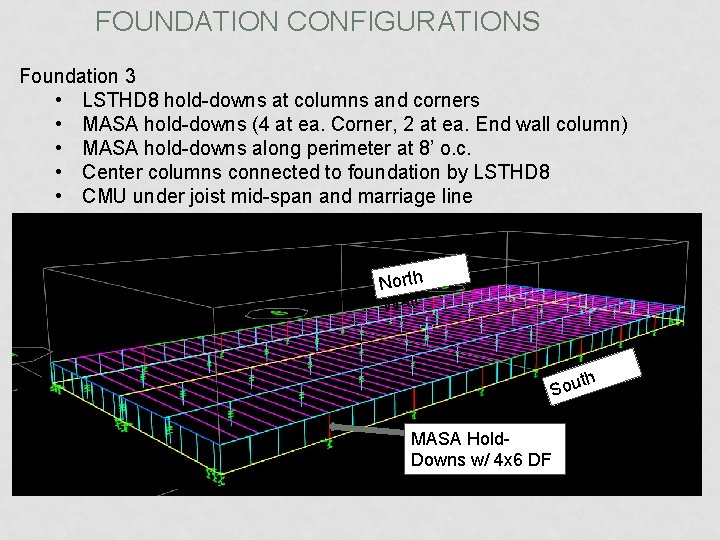
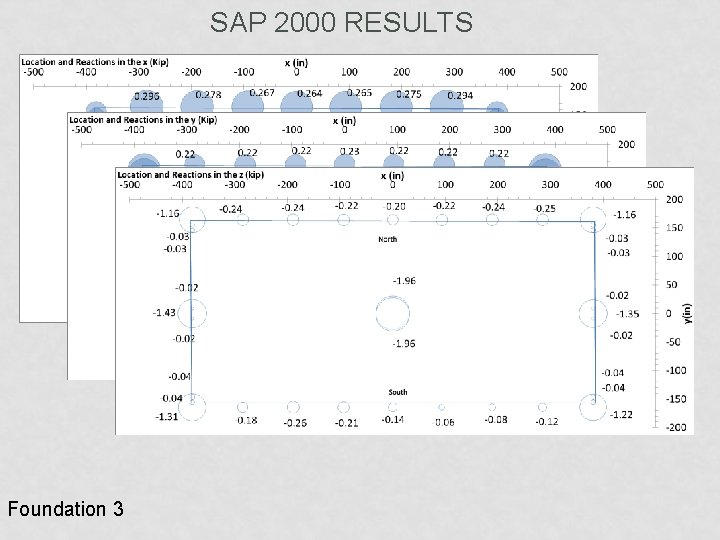
FOUNDATION CONFIGURATIONS Foundation 3 • LSTHD 8 hold-downs at columns and corners • MASA hold-downs (4 at ea. Corner, 2 at ea. End wall column) • MASA hold-downs along perimeter at 8’ o. c. • Center columns connected to foundation by LSTHD 8 • CMU under joist mid-span and marriage line North Wall th u o S l Wal MASA Hold. Downs w/ 4 x 6 DF Posts
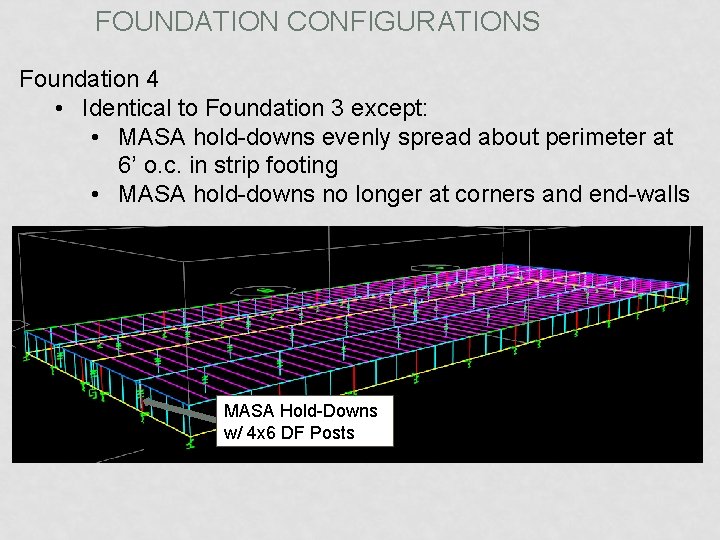
FOUNDATION CONFIGURATIONS Foundation 4 • Identical to Foundation 3 except: • MASA hold-downs evenly spread about perimeter at 6’ o. c. in strip footing • MASA hold-downs no longer at corners and end-walls MASA Hold-Downs w/ 4 x 6 DF Posts
SAP 2000 ANALYSIS METHOD N O N - L I N E A R A N A L Y S I S E N V E L O P E O V E R 8 L O A D C A S E S L O A D C O M B I N A T I O N S
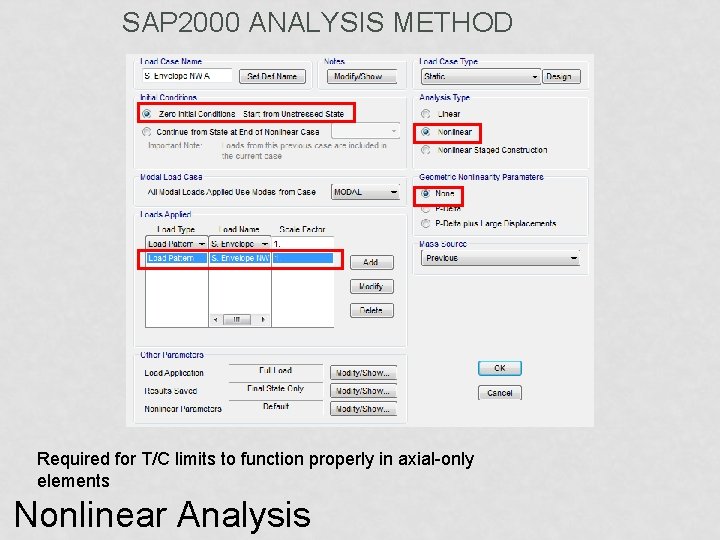
SAP 2000 ANALYSIS METHOD Required for T/C limits to function properly in axial-only elements Nonlinear Analysis
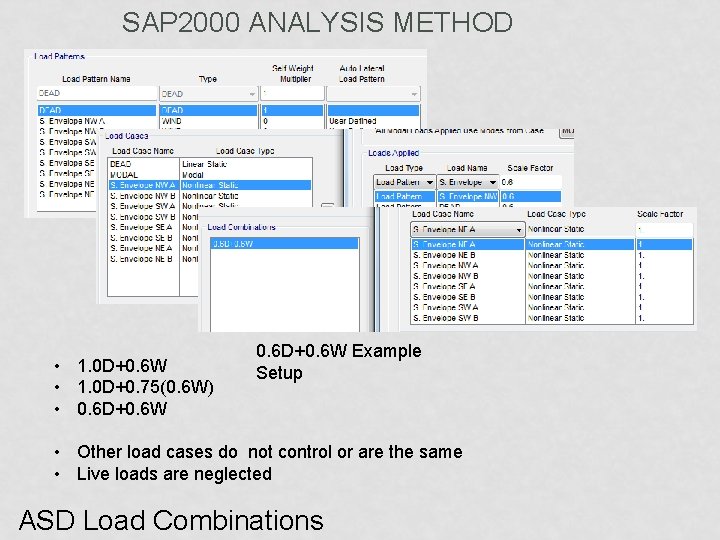
SAP 2000 ANALYSIS METHOD • 1. 0 D+0. 6 W • 1. 0 D+0. 75(0. 6 W) • 0. 6 D+0. 6 W Example Setup • Other load cases do not control or are the same • Live loads are neglected ASD Load Combinations
SAP 2000 OUTPUT VERIFICATION R E A C T I O N C H E C K E X P E C T E D S H E A R W A L L D E F O R M A T I O N S Q U A L I T A T I V E L O O K A T D E F O R M E D S H A P E A N D S T R E S S E V A L U A T I O N O F S H E A R W A L L T E S T D A T A
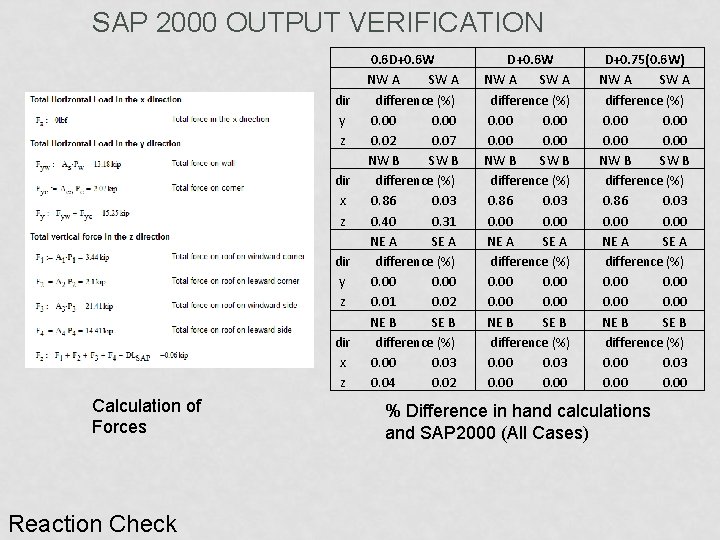
SAP 2000 OUTPUT VERIFICATION dir y z dir x z Calculation of Forces Reaction Check 0. 6 D+0. 6 W NW A SW A difference (%) 0. 00 0. 02 0. 07 NW B SW B difference (%) 0. 86 0. 03 0. 40 0. 31 NE A SE A difference (%) 0. 00 0. 01 0. 02 NE B SE B difference (%) 0. 00 0. 03 0. 04 0. 02 D+0. 6 W NW A SW A difference (%) 0. 00 NW B SW B difference (%) 0. 86 0. 03 0. 00 NE A SE A difference (%) 0. 00 NE B SE B difference (%) 0. 00 0. 03 0. 00 D+0. 75(0. 6 W) NW A SW A difference (%) 0. 00 NW B SW B difference (%) 0. 86 0. 03 0. 00 NE A SE A difference (%) 0. 00 NE B SE B difference (%) 0. 00 0. 03 0. 00 % Difference in hand calculations and SAP 2000 (All Cases)
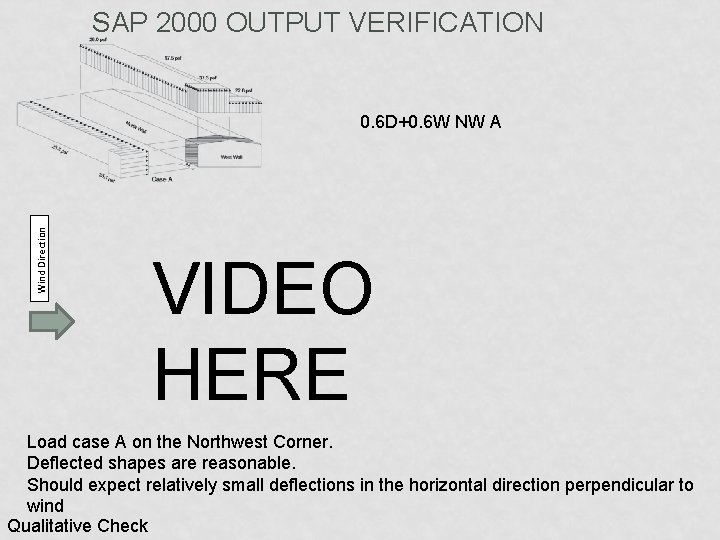
SAP 2000 OUTPUT VERIFICATION Wind Direction 0. 6 D+0. 6 W NW A VIDEO HERE Load case A on the Northwest Corner. Deflected shapes are reasonable. Should expect relatively small deflections in the horizontal direction perpendicular to wind Qualitative Check
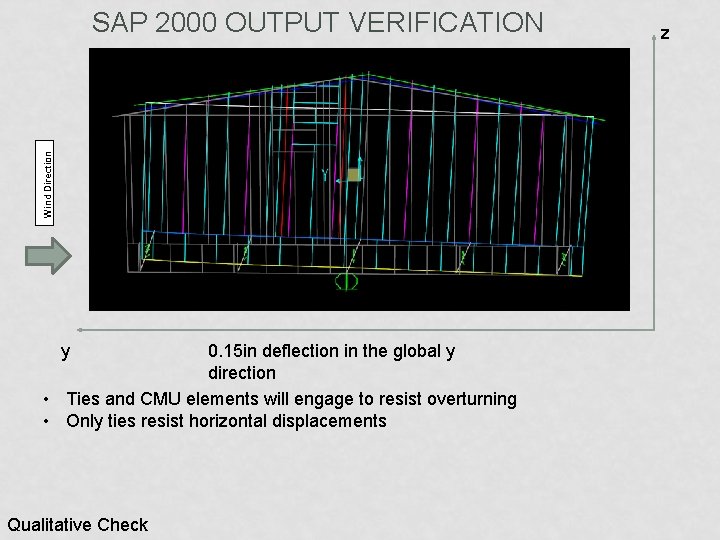
Wind Direction SAP 2000 OUTPUT VERIFICATION y 0. 15 in deflection in the global y direction • Ties and CMU elements will engage to resist overturning • Only ties resist horizontal displacements Qualitative Check z
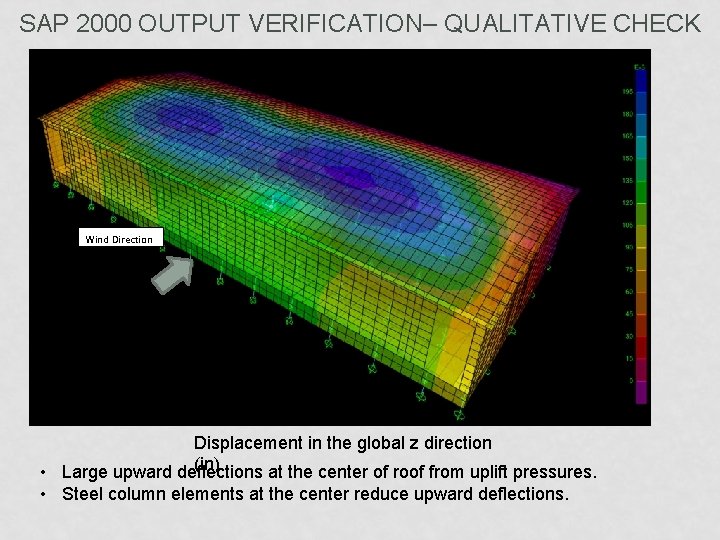
SAP 2000 OUTPUT VERIFICATION– QUALITATIVE CHECK Wind Direction Displacement in the global z direction (in) • Large upward deflections at the center of roof from uplift pressures. • Steel column elements at the center reduce upward deflections.
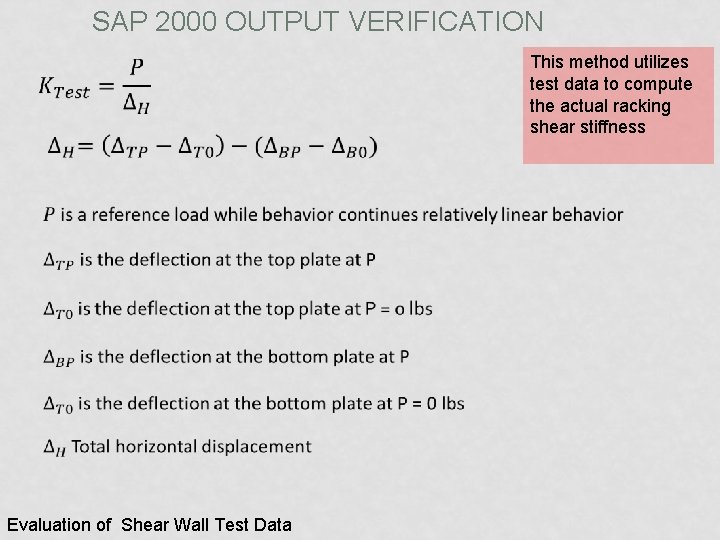
SAP 2000 OUTPUT VERIFICATION Evaluation of Shear Wall Test Data This method utilizes test data to compute the actual racking shear stiffness
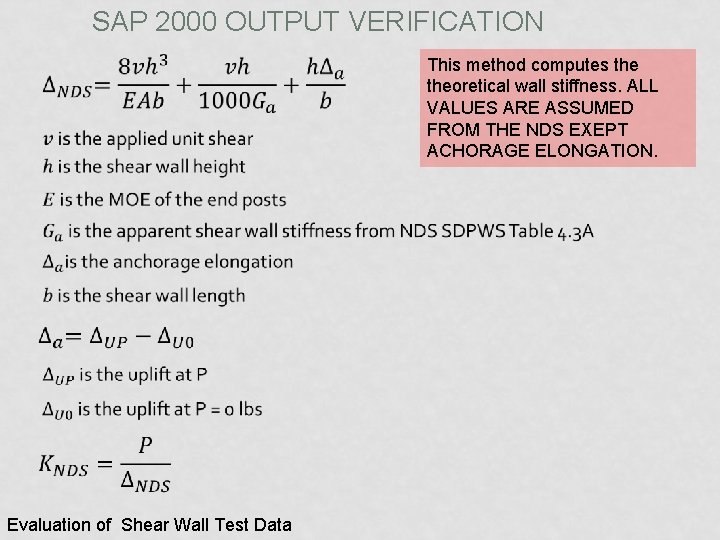
SAP 2000 OUTPUT VERIFICATION Evaluation of Shear Wall Test Data This method computes theoretical wall stiffness. ALL VALUES ARE ASSUMED FROM THE NDS EXEPT ACHORAGE ELONGATION.
SAP 2000 OUTPUT VERIFICATION Evaluation using NDS Equation… Theoretica l Actual Test NDS Diff. K (kip/in) % Evaluation of Shear Wall Test Data Wall 1 A 16. 40 16. 56 0. 94 Wall 2 14. 54 13. 68 -6. 31 Wall 3 14. 22 -0. 10
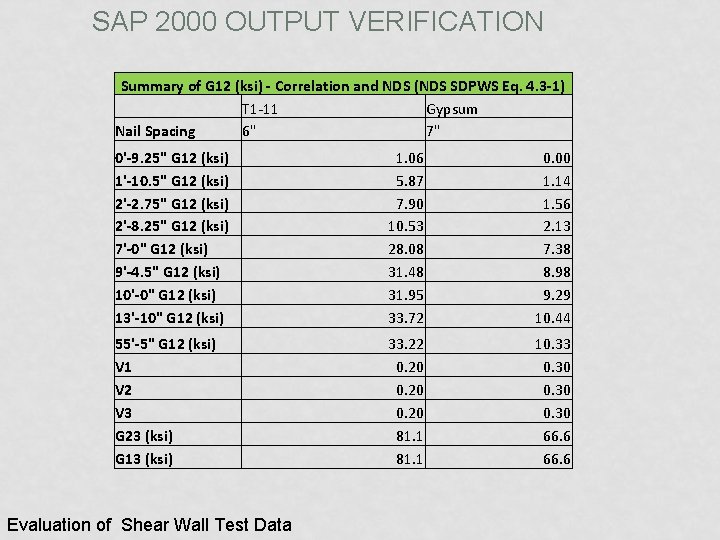
SAP 2000 OUTPUT VERIFICATION Summary of G 12 (ksi) - Correlation and NDS (NDS SDPWS Eq. 4. 3 -1) T 1 -11 Gypsum Nail Spacing 6" 7" 0'-9. 25" G 12 (ksi) 1'-10. 5" G 12 (ksi) 2'-2. 75" G 12 (ksi) 2'-8. 25" G 12 (ksi) 7'-0" G 12 (ksi) 9'-4. 5" G 12 (ksi) 10'-0" G 12 (ksi) 13'-10" G 12 (ksi) 1. 06 5. 87 7. 90 10. 53 28. 08 31. 48 31. 95 33. 72 0. 00 1. 14 1. 56 2. 13 7. 38 8. 98 9. 29 10. 44 55'-5" G 12 (ksi) V 1 V 2 V 3 G 23 (ksi) G 13 (ksi) 33. 22 0. 20 81. 1 10. 33 0. 30 66. 6 Evaluation of Shear Wall Test Data
TENSION IN TIES (FOUNDATION 1) FOUNDATION 2 FOUNDATION 3 FOUNDATION 4 ANCHORAGE UTILIZATION SHEAR WALL UTILIZATION (NO UPLIFT) LOADING FOR MAX DEFORMATION EFFECTS OF OPENINGS ON WINDOW OPENINGS AND DOOR STUDS SAP 2000 RESULTS
SAP 2000 RESULTS CMU Ties Stress in Ties : 0. 6 D+0. 6 W NW A Case Wind Direction
SAP 2000 RESULTS Tie Strap Allowable Stress: 77 ksi Stress in Ties – Envelope, Foundation 1
SAP 2000 RESULTS Foundation 2
SAP 2000 RESULTS Foundation 3
SAP 2000 RESULTS Foundation 4
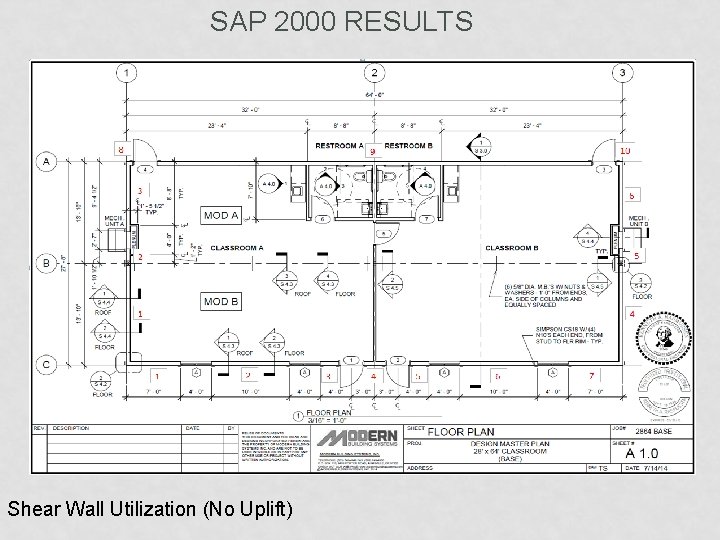
SAP 2000 RESULTS Shear Wall Utilization (No Uplift)
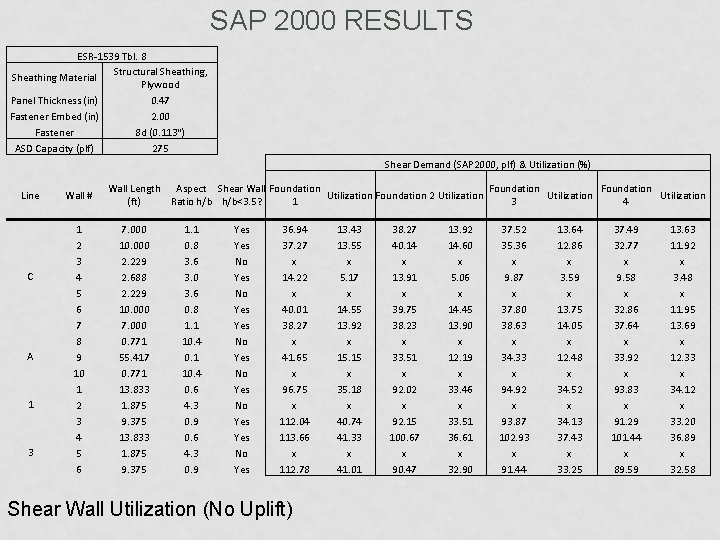
SAP 2000 RESULTS ESR-1539 Tbl. 8 Structural Sheathing, Sheathing Material Plywood Panel Thickness (in) 0. 47 Fastener Embed (in) 2. 00 Fastener 8 d (0. 113") ASD Capacity (plf) 275 Shear Demand (SAP 2000, plf) & Utilization (%) Line C A 1 3 Wall # 1 2 3 4 5 6 7 8 9 10 1 2 3 4 5 6 Wall Length Aspect Shear Wall Foundation Utilization Foundation 2 Utilization (ft) Ratio h/b<3. 5? 1 3 4 7. 000 10. 000 2. 229 2. 688 2. 229 10. 000 7. 000 0. 771 55. 417 0. 771 13. 833 1. 875 9. 375 1. 1 0. 8 3. 6 3. 0 3. 6 0. 8 1. 1 10. 4 0. 6 4. 3 0. 9 Yes Yes No Yes No Yes 36. 94 37. 27 x 14. 22 x 40. 01 38. 27 x 41. 65 x 96. 75 x 112. 04 113. 66 x 112. 78 Shear Wall Utilization (No Uplift) 13. 43 13. 55 x 5. 17 x 14. 55 13. 92 x 15. 15 x 35. 18 x 40. 74 41. 33 x 41. 01 38. 27 40. 14 x 13. 91 x 39. 75 38. 23 x 33. 51 x 92. 02 x 92. 15 100. 67 x 90. 47 13. 92 14. 60 x 5. 06 x 14. 45 13. 90 x 12. 19 x 33. 46 x 33. 51 36. 61 x 32. 90 37. 52 35. 36 x 9. 87 x 37. 80 38. 63 x 34. 33 x 94. 92 x 93. 87 102. 93 x 91. 44 13. 64 12. 86 x 3. 59 x 13. 75 14. 05 x 12. 48 x 34. 52 x 34. 13 37. 43 x 33. 25 37. 49 32. 77 x 9. 58 x 32. 86 37. 64 x 33. 92 x 93. 83 x 91. 29 101. 44 x 89. 59 13. 63 11. 92 x 3. 48 x 11. 95 13. 69 x 12. 33 x 34. 12 x 33. 20 36. 89 x 32. 58
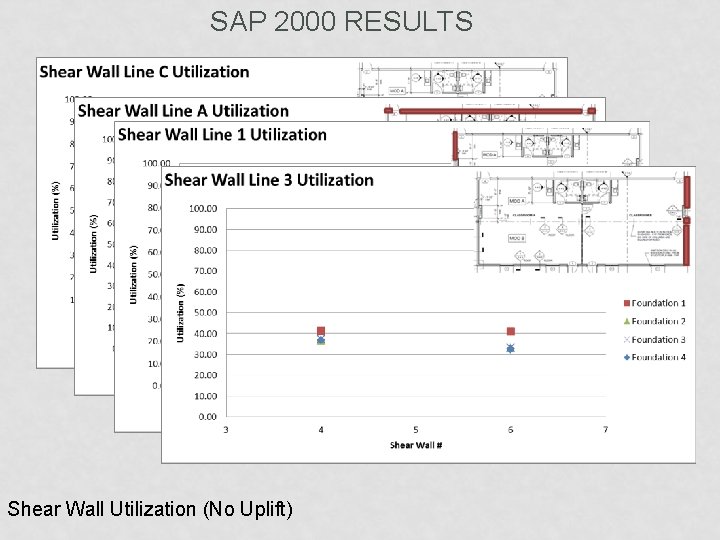
SAP 2000 RESULTS Shear Wall Utilization (No Uplift)
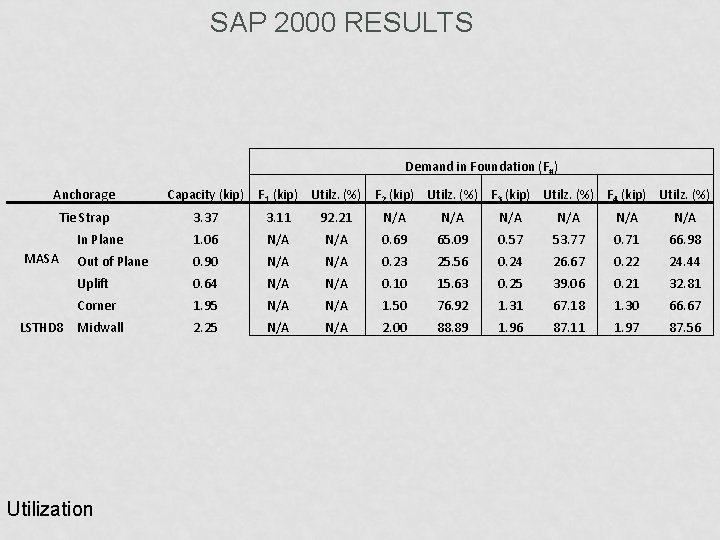
SAP 2000 RESULTS Demand in Foundation (F#) Anchorage Capacity (kip) Tie Strap 3. 37 3. 11 92. 21 N/A N/A N/A In Plane 1. 06 N/A 0. 69 65. 09 0. 57 53. 77 0. 71 66. 98 Out of Plane 0. 90 N/A 0. 23 25. 56 0. 24 26. 67 0. 22 24. 44 Uplift 0. 64 N/A 0. 10 15. 63 0. 25 39. 06 0. 21 32. 81 Corner 1. 95 N/A 1. 50 76. 92 1. 31 67. 18 1. 30 66. 67 2. 25 N/A 2. 00 88. 89 1. 96 87. 11 1. 97 87. 56 MASA LSTHD 8 Midwall Utilization F 1 (kip) Utilz. (%) F 2 (kip) Utilz. (%) F 3 (kip) Utilz. (%) F 4 (kip) Utilz. (%)
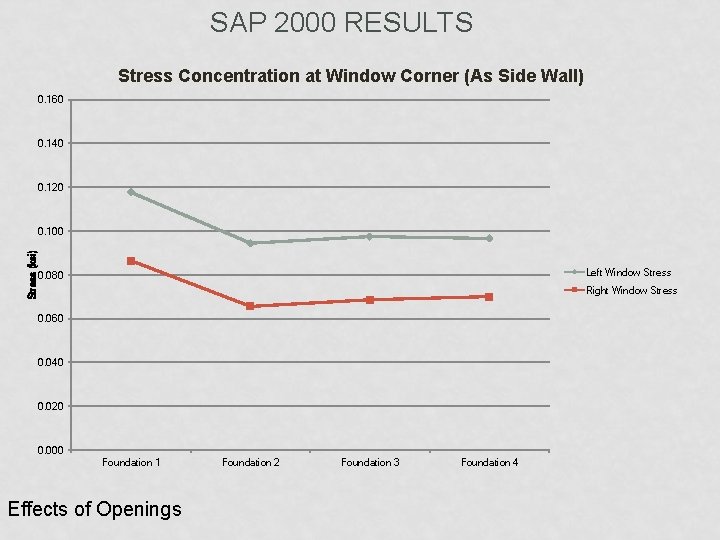
SAP 2000 RESULTS Stress Concentration at Window Corner (As Side Wall) 0. 160 0. 140 0. 120 Stress (ksi) 0. 100 Left Window Stress 0. 080 Right Window Stress 0. 060 0. 040 0. 020 0. 000 Foundation 1 Effects of Openings Foundation 2 Foundation 3 Foundation 4
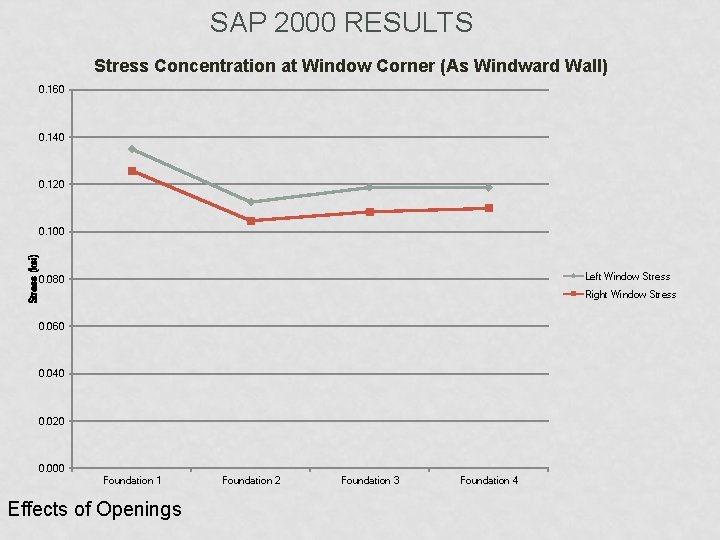
SAP 2000 RESULTS Stress Concentration at Window Corner (As Windward Wall) 0. 160 0. 140 0. 120 Stress (ksi) 0. 100 Left Window Stress 0. 080 Right Window Stress 0. 060 0. 040 0. 020 0. 000 Foundation 1 Effects of Openings Foundation 2 Foundation 3 Foundation 4
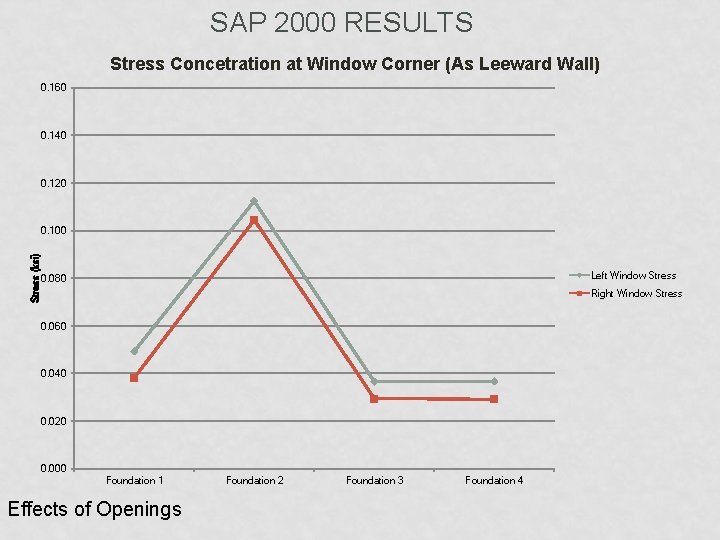
SAP 2000 RESULTS Stress Concetration at Window Corner (As Leeward Wall) 0. 160 0. 140 0. 120 Stress (ksi) 0. 100 Left Window Stress 0. 080 Right Window Stress 0. 060 0. 040 0. 020 0. 000 Foundation 1 Effects of Openings Foundation 2 Foundation 3 Foundation 4
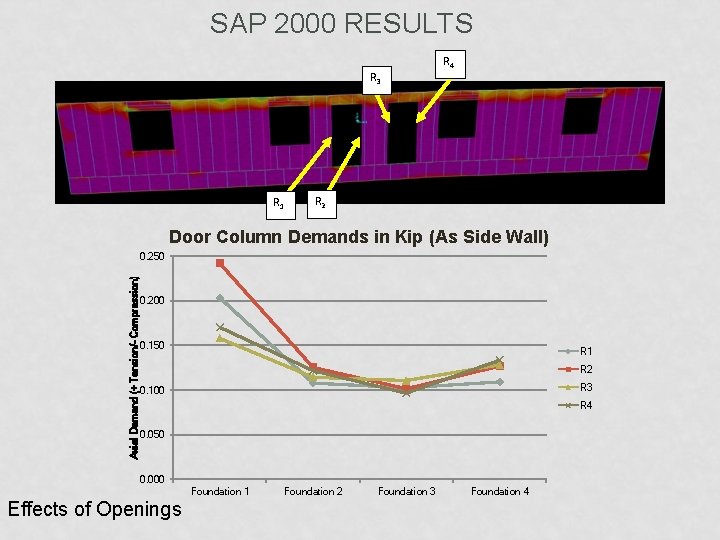
SAP 2000 RESULTS R 3 R 1 R 4 R 2 Door Column Demands in Kip (As Side Wall) Axial Demand (+ Tension/- Compression) 0. 250 0. 200 0. 150 R 1 R 2 R 3 0. 100 R 4 0. 050 0. 000 Foundation 1 Effects of Openings Foundation 2 Foundation 3 Foundation 4
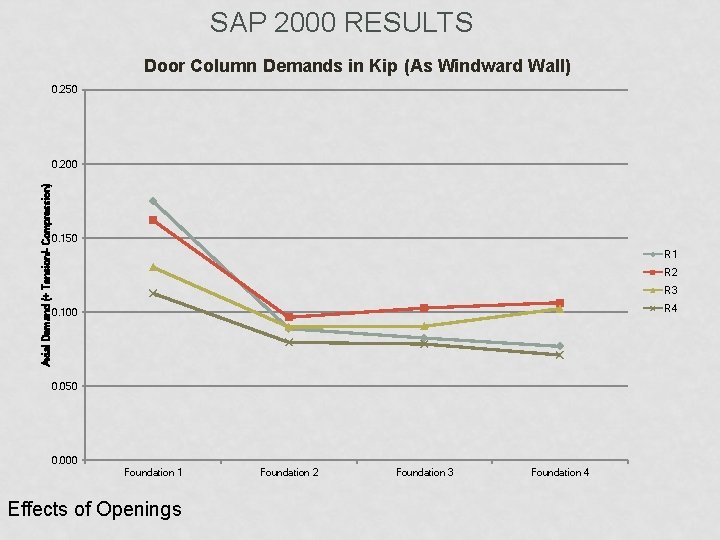
SAP 2000 RESULTS Door Column Demands in Kip (As Windward Wall) 0. 250 Axial Demand (+ Tension/- Compression) 0. 200 0. 150 R 1 R 2 R 3 R 4 0. 100 0. 050 0. 000 Foundation 1 Effects of Openings Foundation 2 Foundation 3 Foundation 4
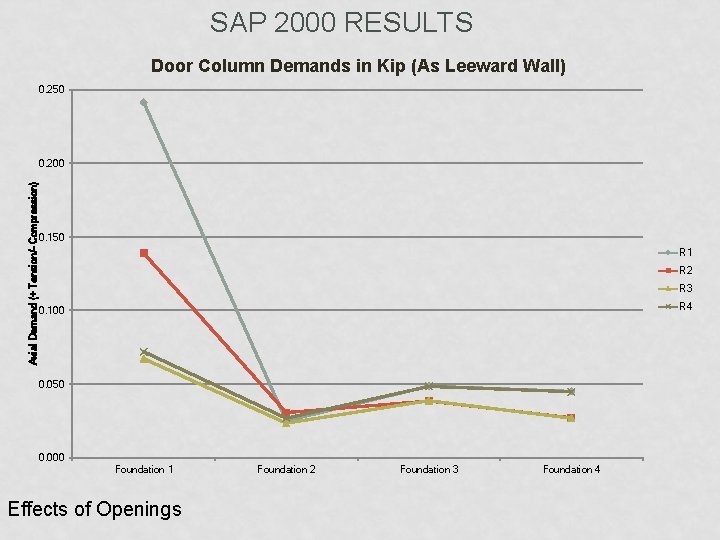
SAP 2000 RESULTS Door Column Demands in Kip (As Leeward Wall) 0. 250 Axial Demand (+ Tension/- Compression) 0. 200 0. 150 R 1 R 2 R 3 R 4 0. 100 0. 050 0. 000 Foundation 1 Effects of Openings Foundation 2 Foundation 3 Foundation 4
MODELING CONCLUSIONS
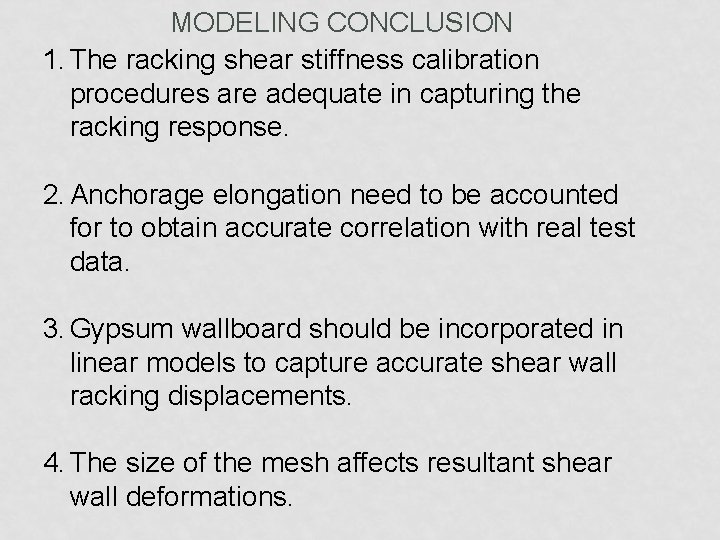
MODELING CONCLUSION 1. The racking shear stiffness calibration procedures are adequate in capturing the racking response. 2. Anchorage elongation need to be accounted for to obtain accurate correlation with real test data. 3. Gypsum wallboard should be incorporated in linear models to capture accurate shear wall racking displacements. 4. The size of the mesh affects resultant shear wall deformations.
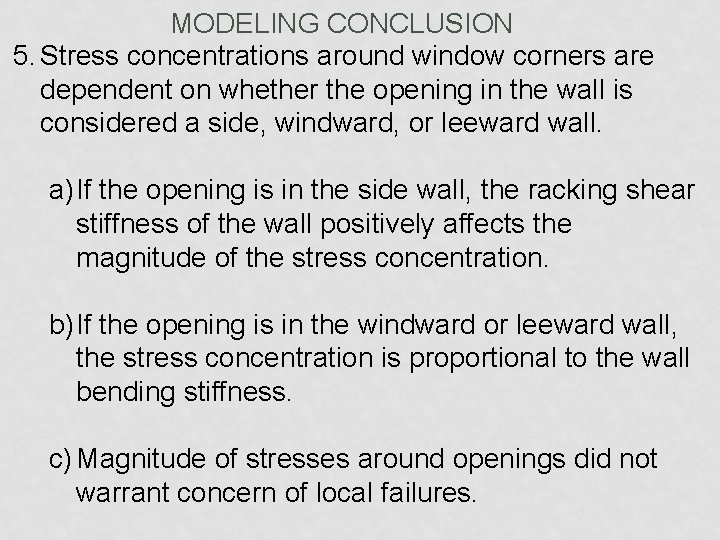
MODELING CONCLUSION 5. Stress concentrations around window corners are dependent on whether the opening in the wall is considered a side, windward, or leeward wall. a) If the opening is in the side wall, the racking shear stiffness of the wall positively affects the magnitude of the stress concentration. b) If the opening is in the windward or leeward wall, the stress concentration is proportional to the wall bending stiffness. c) Magnitude of stresses around openings did not warrant concern of local failures.
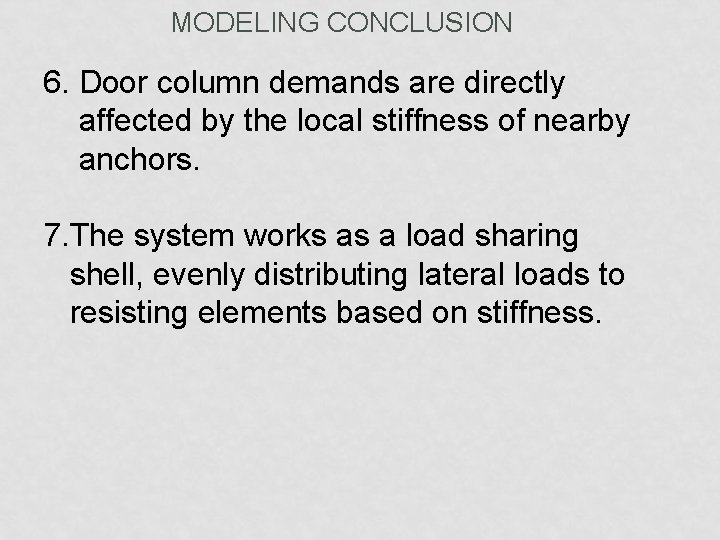
MODELING CONCLUSION 6. Door column demands are directly affected by the local stiffness of nearby anchors. 7. The system works as a load sharing shell, evenly distributing lateral loads to resisting elements based on stiffness.
RECOMMENDATIONS FOR FUTURE RESEARCH BASED ON CONCLUSIONS
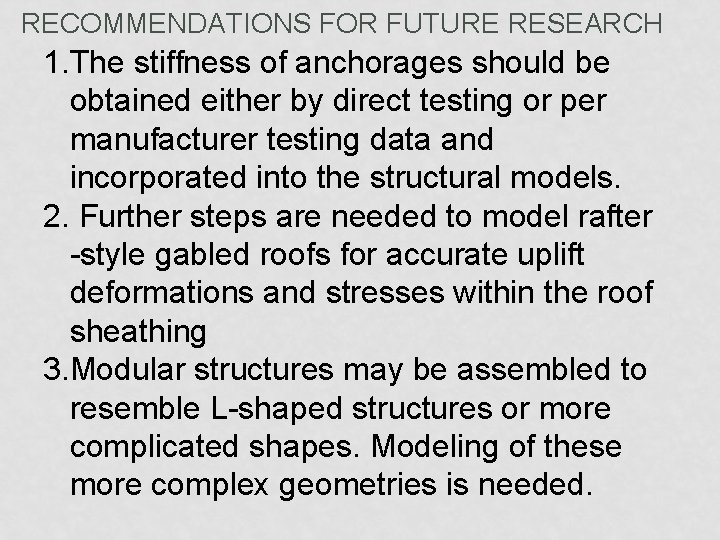
RECOMMENDATIONS FOR FUTURE RESEARCH 1. The stiffness of anchorages should be obtained either by direct testing or per manufacturer testing data and incorporated into the structural models. 2. Further steps are needed to model rafter -style gabled roofs for accurate uplift deformations and stresses within the roof sheathing 3. Modular structures may be assembled to resemble L-shaped structures or more complicated shapes. Modeling of these more complex geometries is needed.
RECOMMENDATIONS FOR FUTURE RESEARCH 4. Modular structures are often “married”, further investigation to model the composite action of the joined regions of the structure is necessary 5. Seismic response of modular structures should be investigated.